
|
市場調査レポート
商品コード
1664873
コンテナハンドリング機器の市場機会、成長促進要因、産業動向分析、2025年~2034年予測Container Handling Equipment Market Opportunity, Growth Drivers, Industry Trend Analysis, and Forecast 2025 - 2034 |
||||||
カスタマイズ可能
|
|||||||
| コンテナハンドリング機器の市場機会、成長促進要因、産業動向分析、2025年~2034年予測 |
|
出版日: 2024年12月03日
発行: Global Market Insights Inc.
ページ情報: 英文 180 Pages
納期: 2~3営業日
|

全表示
- 概要
- 目次
世界のコンテナハンドリング機器市場は、2024年に86億米ドルとなり、2025年から2034年にかけてCAGR5.4%の堅調な成長が見込まれています。
この成長は、国際貿易の増加やコンテナ貨物への選好の高まりに後押しされ、効率的なコンテナハンドリングソリューションへの需要が高まっていることに起因しています。グローバルサプライチェーンが複雑化するにつれ、クレーン、スタッカー、自動化技術などの先進システムの採用が急速に増加しています。港湾の拡張やインフラのアップグレードへの投資は、近代的物流の進化する需要に対応するための最新鋭機器の必要性をさらに加速させています。
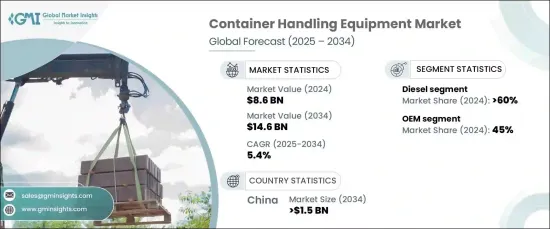
市場は推進力別にディーゼル、電気、ハイブリッド・システムに区分されます。ディーゼルエンジン搭載機器は2024年に60%の圧倒的シェアを占め、2034年には60億米ドルに達すると予測されています。ディーゼルは、その信頼性、確立されたインフラ、費用対効果により、引き続き人気の高い選択肢となっています。ディーゼルは高出力を実現するため、特に電気インフラが限られた環境下での重作業に最適です。ディーゼルパワーシステムの多用途性と信頼性は、特に大規模な港湾や物流ハブにおいて、その優位性を維持することを確実にしています。
| 市場範囲 | |
|---|---|
| 開始年 | 2024年 |
| 予測年 | 2025年~2034年 |
| 開始金額 | 86億米ドル |
| 予測金額 | 146億米ドル |
| CAGR | 5.4% |
容量は10トン以下、10~50トン、50トン以上に分けられます。容量10トン以下のセグメントは、その手頃な価格、柔軟性、業界を問わず広く使用されていることから、市場をリードしています。これらのシステムは、中規模貨物を扱う倉庫、製造施設、港湾でよく見られます。大容量の機器に比べて低コストであるため、幅広い事業者が利用でき、市場での優位性がさらに強まっています。
中国のコンテナハンドリング機器市場は、2024年には世界シェアの30%を占め、2034年までに15億米ドルを生み出すとみられています。中国のリーダーシップは、その強力な製造能力、コスト効率の高い生産、港湾インフラへの戦略的投資に起因しています。世界の貿易大国である中国は、その大規模な生産能力と競争力のある価格設定を活かして、コンテナハンドリング機器の需要拡大に対応し、市場で重要な役割を果たしています。
目次
第1章 調査手法と調査範囲
- 調査デザイン
- 調査アプローチ
- データ収集方法
- 基本推定と計算
- 基準年の算出
- 市場推計の主要動向
- 予測モデル
- 一次調査と検証
- 一次ソース
- データマイニングソース
- 市場定義
第2章 エグゼクティブサマリー
第3章 業界洞察
- 業界エコシステム分析
- サプライヤーの状況
- メーカー
- テクノロジープロバイダー
- 流通業者
- エンドユーザー
- 利益率分析
- 機器のコスト内訳
- 技術とイノベーションの展望
- 特許状況
- 使用事例
- 主要ニュース・イニシアチブ
- 規制状況
- 影響要因
- 成長促進要因
- 世界貿易とコンテナ貨物の成長
- 自動化とデジタル技術の採用
- 港湾の拡張とインフラ開発
- 機器の技術的進歩
- 業界の潜在的リスク・課題
- 高い初期資本投資
- 運用・保守コスト
- 成長促進要因
- 成長可能性分析
- ポーター分析
- PESTEL分析
第4章 競合情勢
- イントロダクション
- 企業市場シェア分析
- 競合のポジショニングマトリックス
- 戦略展望マトリックス
第5章 市場推計・予測:機器別、2021年~2034年
- 主要動向
- 自動スタッキングクレーン(ASC)
- 空コンテナ取扱フォークリフト(FLT)
- 積載型フォークリフト(FLT)
- 移動式港湾クレーン(MHC)
- レールマウントガントリ(RMG)クレーン
- リーチスタッカー
- ゴムタイヤガントリ(RTG)クレーン
- シップトゥショア(STS)クレーン
- その他
第6章 市場推計・予測:用途別、2021年~2034年
- 主要動向
- 港湾ターミナル
- 鉄道ターミナル
- 内陸コンテナデポ(ICD)
- 物流ハブ
第7章 市場推計・予測:推進力別、2021年~2034年
- 主要動向
- ディーゼル
- 電気
- ハイブリッド
第8章 市場推計・予測:容量別、2021年~2034年
- 主要動向
- 10トン以下
- 10~50トン
- 50トン以上
第9章 市場推計・予測:地域別、2021年~2034年
- 主要動向
- 北米
- 米国
- カナダ
- 欧州
- 英国
- ドイツ
- フランス
- スペイン
- イタリア
- ロシア
- 北欧
- アジア太平洋
- 中国
- インド
- 日本
- 韓国
- ニュージーランド
- 東南アジア
- ラテンアメリカ
- ブラジル
- メキシコ
- アルゼンチン
- 中東・アフリカ
- UAE
- 南アフリカ
- サウジアラビア
第10章 企業プロファイル
- Konecranes
- Cargotec
- Liebherr Group
- ZPMC(Shanghai Zhenhua Heavy Industries Company)
- Terex
- Doosan Heavy Industries &Construction
- Hyster-Yale Materials Handling
- Toyota Industries
- Mitsubishi Heavy Industries
- SANY Group
- Caterpillar Inc.
- Hyundai Heavy Industries
- Kalmar
- Manitowoc Crane Group
- STILL GmbH
- Jungheinrich AG
- Palfinger AG
- TMEIC Corporation
- Furukawa Electric Co., Ltd.
- ABUS Kransysteme GmbH
The Global Container Handling Equipment Market was valued at USD 8.6 billion in 2024 and is expected to grow at a robust CAGR of 5.4% from 2025 to 2034. This growth is driven by the increasing demand for efficient container handling solutions, fueled by rising international trade and the growing preference for containerized cargo. As global supply chains become more complex, the adoption of advanced systems such as cranes, stackers, and automated technologies is rapidly increasing. Investments in port expansions and infrastructure upgrades are further accelerating the need for state-of-the-art equipment to meet the evolving demands of modern logistics.
The market is segmented by propulsion into diesel, electric, and hybrid systems. Diesel-powered equipment held a dominant 60% share in 2024 and is projected to reach USD 6 billion by 2034. Diesel continues to be a popular choice due to its reliability, well-established infrastructure, and cost-effectiveness. It delivers high power output, making it ideal for heavy-duty operations, especially in environments with limited electric infrastructure. The versatility and dependability of diesel-powered systems ensure they will maintain their lead, particularly in large-scale ports and logistics hubs.
| Market Scope | |
|---|---|
| Start Year | 2024 |
| Forecast Year | 2025-2034 |
| Start Value | $8.6 Billion |
| Forecast Value | $14.6 Billion |
| CAGR | 5.4% |
By capacity, the market is divided into up to 10 tons, 10-50 tons, and 50 tons and above. The up to 10 tons capacity segment is leading the market thanks to its affordability, flexibility, and widespread use across industries. These systems are commonly found in warehouses, manufacturing facilities, and ports handling medium-sized cargo. Their lower cost compared to higher-capacity equipment makes them accessible to a wider range of operators, further strengthening their dominance in the market.
The container handling equipment market in China accounted for 30% of the global share in 2024 and is set to generate USD 1.5 billion by 2034. The country's leadership is attributed to its strong manufacturing capabilities, cost-effective production, and strategic investments in port infrastructure. As a global trade powerhouse, China plays a crucial role in the market, leveraging its large-scale production capacity and competitive pricing to meet the growing demand for container handling equipment.
Table of Contents
Chapter 1 Methodology & Scope
- 1.1 Research design
- 1.1.1 Research approach
- 1.1.2 Data collection methods
- 1.2 Base estimates and calculations
- 1.2.1 Base year calculation
- 1.2.2 Key trends for market estimates
- 1.3 Forecast model
- 1.4 Primary research & validation
- 1.4.1 Primary sources
- 1.4.2 Data mining sources
- 1.5 Market definitions
Chapter 2 Executive Summary
- 2.1 Industry 3600 synopsis, 2021 - 2034
Chapter 3 Industry Insights
- 3.1 Industry ecosystem analysis
- 3.2 Supplier landscape
- 3.2.1 Manufacturers
- 3.2.2 Technology providers
- 3.2.3 Distributors
- 3.2.4 End users
- 3.3 Profit margin analysis
- 3.4 Cost Breakdown of equipment
- 3.5 Technology & innovation landscape
- 3.6 Patent landscape
- 3.7 Use cases
- 3.8 Key news & initiatives
- 3.9 Regulatory landscape
- 3.10 Impact forces
- 3.10.1 Growth drivers
- 3.10.1.1 Growth in global trade and containerized cargo
- 3.10.1.2 Adoption of automation and digital technologies
- 3.10.1.3 Port expansion and infrastructure development
- 3.10.1.4 Technological advancements in equipment
- 3.10.2 Industry pitfalls & challenges
- 3.10.2.1 High initial capital investment
- 3.10.2.2 Operational and maintenance costs
- 3.10.1 Growth drivers
- 3.11 Growth potential analysis
- 3.12 Porter’s analysis
- 3.13 PESTEL analysis
Chapter 4 Competitive Landscape, 2024
- 4.1 Introduction
- 4.2 Company market share analysis
- 4.3 Competitive positioning matrix
- 4.4 Strategic outlook matrix
Chapter 5 Market Estimates & Forecast, By Equipment, 2021 - 2034 ($Bn, Units)
- 5.1 Key trends
- 5.2 Automated Stacking Crane (ASC)
- 5.3 Empty Container Handling Forklift Truck (FLT)
- 5.4 Laden Forklift Truck (FLT)
- 5.5 Mobile Harbor Crane (MHC)
- 5.6 Rail Mounted Gantry (RMG) Crane
- 5.7 Reach Stacker
- 5.8 Rubber Tired Gantry (RTG) Crane
- 5.9 Ship to Shore (STS) Crane
- 5.10 Others
Chapter 6 Market Estimates & Forecast, By Application, 2021 - 2034 ($Bn, Units)
- 6.1 Key trends
- 6.2 Port terminals
- 6.3 Railway terminals
- 6.4 Inland Container Depots (ICDs)
- 6.5 Logistics Hubs
Chapter 7 Market Estimates & Forecast, By Propulsion, 2021 - 2034 ($Bn, Units)
- 7.1 Key trends
- 7.2 Diesel
- 7.3 Electric
- 7.4 Hybrid
Chapter 8 Market Estimates & Forecast, By Capacity, 2021 - 2034 ($Bn, Units)
- 8.1 Key trends
- 8.2 Up to 10 tons
- 8.3 10-50 tons
- 8.4 50 tons and above
Chapter 9 Market Estimates & Forecast, By Region, 2021 - 2034 ($Bn, Units)
- 9.1 Key trends
- 9.2 North America
- 9.2.1 U.S.
- 9.2.2 Canada
- 9.3 Europe
- 9.3.1 UK
- 9.3.2 Germany
- 9.3.3 France
- 9.3.4 Spain
- 9.3.5 Italy
- 9.3.6 Russia
- 9.3.7 Nordics
- 9.4 Asia Pacific
- 9.4.1 China
- 9.4.2 India
- 9.4.3 Japan
- 9.4.4 South Korea
- 9.4.5 ANZ
- 9.4.6 Southeast Asia
- 9.5 Latin America
- 9.5.1 Brazil
- 9.5.2 Mexico
- 9.5.3 Argentina
- 9.6 MEA
- 9.6.1 UAE
- 9.6.2 South Africa
- 9.6.3 Saudi Arabia
Chapter 10 Company Profiles
- 10.1 Konecranes
- 10.2 Cargotec
- 10.3 Liebherr Group
- 10.4 ZPMC (Shanghai Zhenhua Heavy Industries Company)
- 10.5 Terex
- 10.6 Doosan Heavy Industries & Construction
- 10.7 Hyster-Yale Materials Handling
- 10.8 Toyota Industries
- 10.9 Mitsubishi Heavy Industries
- 10.10 SANY Group
- 10.11 Caterpillar Inc.
- 10.12 Hyundai Heavy Industries
- 10.13 Kalmar
- 10.14 Manitowoc Crane Group
- 10.15 STILL GmbH
- 10.16 Jungheinrich AG
- 10.17 Palfinger AG
- 10.18 TMEIC Corporation
- 10.19 Furukawa Electric Co., Ltd.
- 10.20 ABUS Kransysteme GmbH
