
|
市場調査レポート
商品コード
1928884
電子セラミックス市場の機会、成長要因、業界動向分析、および2026年から2035年までの予測Electronic Ceramics Market Opportunity, Growth Drivers, Industry Trend Analysis, and Forecast 2026 - 2035 |
||||||
カスタマイズ可能
|
|||||||
| 電子セラミックス市場の機会、成長要因、業界動向分析、および2026年から2035年までの予測 |
|
出版日: 2026年01月06日
発行: Global Market Insights Inc.
ページ情報: 英文 210 Pages
納期: 2~3営業日
|

概要
世界の電子セラミックス市場は、2025年に281億米ドルと評価され、2035年までにCAGR6.1%で成長し、522億米ドルに達すると予測されています。
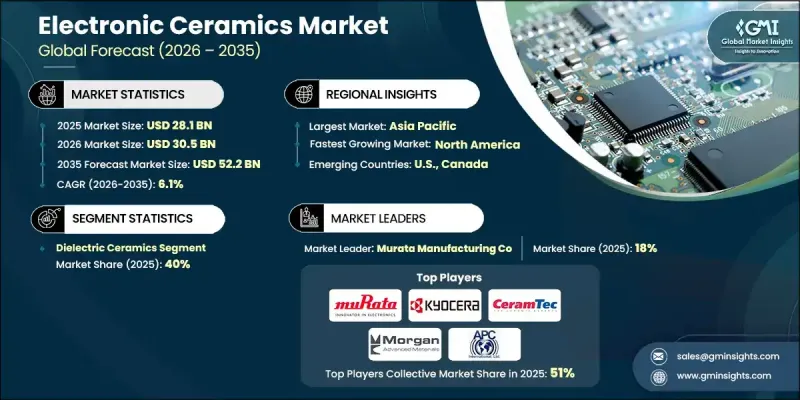
市場成長は、先進電子機器の継続的な拡大、高速接続性、電動化モビリティ、電力インフラのアップグレードによって支えられています。接続デバイスの大規模生産は、信号の完全性、エネルギー効率、熱安定性を実現するセラミックベースの部品に対する持続的な需要を牽引しています。無線通信および次世代ネットワークの進歩により、高周波・マイクロ波用途向けセラミック材料の性能要件が高まっています。自動車分野では、電気駆動システム、パワーエレクトロニクス、充電システムが高電圧・高温環境下で動作可能なセラミック基板および絶縁体を必要とするため、長期的な需要が強化されています。産業用電力システム、送電網の近代化、自動化ソリューションにおいても、絶縁、エネルギー貯蔵、制御システム向けにセラミック材料が採用され、市場拡大に寄与しています。アジア太平洋地域は電子機器製造が集中しているため、世界市場価値の約60%を占めております。一方、北米および欧州では、高信頼性・特殊用途向けの高価格製品に重点が置かれております。継続的な小型化、進化するメモリ技術、自動車の電動化、規制主導の材料革新により、応用分野の機会は拡大し続けております。
| 市場範囲 | |
|---|---|
| 開始年 | 2025年 |
| 予測年度 | 2026-2035 |
| 開始時価値 | 281億米ドル |
| 予測金額 | 522億米ドル |
| CAGR | 6.1% |
製品カテゴリー別では、誘電体セラミックスが2025年に40%のシェアを占めました。これは、積層セラミックコンデンサ、共振器、高周波部品に対する強い需要に支えられたものです。磁性セラミック材料は、誘導部品、電磁妨害対策、先進通信システムでの使用により、市場の約15%を占めました。
民生用電子機器および家電製品は主要な最終用途セグメントであり、接続デバイス、スマートシステム、デジタル家電に幅広く使用されるセラミック部品を大量に消費しています。インテリジェントで接続性が高く高性能な消費財の普及拡大は、信号処理、エネルギー貯蔵、熱管理を支えるコンパクトで信頼性の高いセラミック材料への需要を継続的に刺激しています。
米国電子セラミックス市場は2025年に61億米ドルに達し、リショアリング施策、半導体・先端製造への優遇措置、電気自動車生産の拡大を背景に、2035年までに120億米ドルに迫ると予測されます。同地域では航空宇宙、医療技術、防衛、先進パワーエレクトロニクス分野における高信頼性用途が重視されており、平均販売価格の上昇とサプライチェーン安全保障への投資拡大に寄与しています。
よくあるご質問
目次
第1章 調査手法と範囲
第2章 エグゼクティブサマリー
第3章 業界考察
- エコシステム分析
- サプライヤーの情勢
- 利益率
- 各段階における付加価値
- バリューチェーンに影響を与える要因
- ディスラプション
- 業界への影響要因
- 促進要因
- 業界の潜在的リスク&課題
- 市場機会
- 成長可能性分析
- 規制情勢
- 北米
- 欧州
- アジア太平洋地域
- ラテンアメリカ
- 中東・アフリカ
- ポーターの分析
- PESTEL分析
- 価格動向
- 地域別
- 製品タイプ別
- 将来の市場動向
- 技術とイノベーションの動向
- 現在の技術動向
- 新興技術
- 特許状況
- 貿易統計(HSコード)(注:貿易統計は主要国のみ提供されます)
- 主要輸入国
- 主要輸出国
- 持続可能性と環境面
- 持続可能な取り組み
- 廃棄物削減戦略
- 生産におけるエネルギー効率
- 環境に配慮した取り組み
- カーボンフットプリントに関する考慮事項
第4章 競合情勢
- イントロダクション
- 企業の市場シェア分析
- 地域別
- 北米
- 欧州
- アジア太平洋地域
- ラテンアメリカ
- 中東・アフリカ
- 地域別
- 企業マトリクス分析
- 主要市場企業の競合分析
- 競合ポジショニングマトリックス
- 主な発展
- 合併・買収
- 提携・協業
- 新製品の発売
- 拡大計画
第5章 電子セラミックス市場:製品タイプ別、2022-2035
- 強誘電体セラミックス
- 圧電セラミックス
- 焦電性セラミックス
- 誘電体セラミックス
- 磁性セラミックス
- 絶縁・基板用セラミックス
- 導電性・電極用セラミックス
- その他
第6章 電子セラミックス市場:形状別、2022-2035
- バルクセラミックス
- 薄膜
- 粉末
- ナノ粒子
- 複合材料
第7章 電子セラミックス市場:最終用途産業別、2022-2035
- 家電製品・民生用電子機器
- ヘルスケア
- 自動車・輸送機器
- 電気通信・送電
- 航空宇宙・防衛
- 産業オートメーション・パワーエレクトロニクス
- エネルギー・発電
- IoTおよびウェアラブル機器
- その他
第8章 市場規模・予測:地域別、2022-2035
- 北米
- 米国
- カナダ
- 欧州
- 英国
- ドイツ
- フランス
- イタリア
- スペイン
- その他欧州地域
- アジア太平洋地域
- 中国
- インド
- 日本
- 韓国
- オーストラリア
- その他アジア太平洋地域
- ラテンアメリカ
- ブラジル
- メキシコ
- アルゼンチン
- その他ラテンアメリカ地域
- 中東・アフリカ
- 南アフリカ
- サウジアラビア
- アラブ首長国連邦
- その他中東とアフリカ
第9章 企業プロファイル
- APC International
- CeramTec Holding
- Central Electronics
- Kyocera Corporation
- Maruwa
- Morgan Advanced Materials
- Murata Manufacturing
- PI Ceramics
- Sensor Technology
- Sparkler Ceramics

