|
|
市場調査レポート
商品コード
1402941
ソーラー型淡水化プラント市場:成長、将来展望、競合分析、2024~2032年Solar Water Desalination Plant Market - Growth, Future Prospects and Competitive Analysis, 2024 - 2032 |
||||||

|
|||||||
|
|||||||

| ソーラー型淡水化プラント市場:成長、将来展望、競合分析、2024~2032年 |
|
出版日: 2023年12月27日
発行: Acute Market Reports
ページ情報: 英文 115 Pages
納期: 即日から翌営業日
|

全表示
- 概要
- 図表
- 目次
ソーラー型淡水化プラント市場は、清潔な水の生産分野における重要かつ革新的なセグメントです。ソーラー型淡水化プラント市場は、再生可能エネルギーの統合、環境の持続可能性、水不足への緊急の対処が原動力となり、予測期間中にCAGR 7.7%の成長が見込まれています。初期資本コストの高さが大きな抑制要因となっているもの、特に太陽光造水が水供給の課題や持続可能性の目標に合致する地域では、市場の拡大が見込まれています。競合情勢は、環境に優しく信頼性の高い水ソリューションを提供し、地域社会や業界の変化するニーズに適応することを約束する主要プレーヤーによって特徴付けられます。
再生可能エネルギーの統合
太陽光発電の相乗効果:ソーラー型淡水化プラント市場を促進する一次情報は、再生可能エネルギー、特に太陽光発電の統合です。2024年には、海水淡水化プロセスへの太陽エネルギーの利用が大幅に増加しました。太陽光発電による海水淡水化プラントは、豊富な太陽エネルギーを利用できることから脚光を浴び、運転コストと環境への影響を低減しています。この動向は、2024年から2032年までの予測期間においても、再生可能エネルギーが世界の清浄水生産に不可欠となるにつれて継続すると予想されます。
環境の持続可能性
カーボンフットプリントの削減:第二の主要因は、環境の持続可能性への取り組みです。2024年には、気候変動と環境への影響に対する懸念から、ソーラー型淡水化の採用が増加しました。これらのプラントは、従来の海水淡水化方法と比較して、大幅に低いカーボンフットプリントで淡水を生産します。この動向は予測期間中も続くと予想され、政府、産業界、環境団体は、責任ある環境に優しいアプローチとして太陽熱を利用した海水淡水化を推進しています。
水不足の緩和
水不足への対応:第三の促進要因は、水不足への緊急対応です。2024年には、水不足に見舞われている地域、特に乾燥気候の地域が、戦略的解決策として太陽熱造水に投資しました。これらのシステムは、厳しい環境下でも信頼性の高い淡水源を提供し、水ストレスの緩和に貢献します。水不足は依然として世界の喫緊の課題であり、太陽熱造水の有効性が証明されるにつれて、この動向は予測期間中も続くと予想されます。
初期資本コストの高さ(300字)
資金面での障壁:ソーラー型淡水化プラント市場に大きな影響を与えている抑制要因は、初期資本コストの高さです。2024年には、ソーラー型淡水化プラントの設置に伴う初期費用が、一部の潜在的導入企業にとっての障壁となっていました。これらの費用には、ソーラーパネル、海水淡水化装置、インフラの購入が含まれます。この抑制は、特に財源が限られている地域では、予測期間中も続くと予想されます。この課題に対処するには、革新的な資金調達モデルとコスト削減策が必要です。
方法(直接法、間接法):直接法が市場を独占
2024年には、太陽エネルギーを真水に直接変換する効率と能力により、直接太陽熱造水法が最も高い収益を記録しました。しかし、2024年から2032年までの予測期間では、間接法が最も高いCAGRを示すと予想されます。発電とその後の淡水化に太陽エネルギーを利用する間接法は、より柔軟でスケーラブルなアプローチを提供します。直接法が収益の主導権を維持すると予想される一方で、間接法はその適応性の高さから急成長を遂げる可能性が高いです。
最終用途レベル(産業、農業、商業、自治体):産業部門が市場を独占
2024年、産業部門は様々なプロセスで水を大量に必要とするため、最も高い収益を記録しました。しかし、2024年から2032年までの予測期間では、自治体セクターが最も高いCAGRを示すと予想されます。自治体は、地域社会の持続可能な分散型水供給を確保するため、太陽熱脱塩の採用を増やしています。産業部門が収益の主導権を維持すると予想される一方で、自治体部門は大幅な成長を遂げる構えです。
中東とアフリカが世界のリーダーであり続ける
ソーラー型淡水化プラント市場の地理的動向から、中東・アフリカ(MENA)地域のように太陽放射照度が高く水不足が深刻な地域は、2024年に大幅な成長を遂げたことがわかる。また、これらの地域は予測期間中もCAGRが最も高いと予測されています。さらに、北米、特に十分な日照と水問題の両方を抱える地域は、2024年に大きな収益率を記録したもう1つの地域であり、水管理戦略への太陽熱脱塩の統合によって、予測期間中もこの地位を維持すると予想されます。
市場競争は予測期間中に激化へ
ソーラー型淡水化プラント市場の競合情勢では、Abengoa Solar、Acciona、IDEXX Laboratories、Elemental Water Makers B.V.、F Cubed Limited、Photon Energy Systems Limited、Sinovoltaics Group、Solar Water Solutions Ltd.、Sterlitech Corporation、Thermax Limited、Trunz Water Systems AG、Waaree Energies Ltd.、ANDRITZなどの主要企業が、技術革新と製品開発の最前線に立っています。これらの企業は、海水淡水化技術を強化するために一貫して研究開発に投資し、地方自治体や公益事業と戦略的パートナーシップを結んで、太陽光発電による海水淡水化ソリューションを導入してきました。2024年、これらの業界リーダーは大きな収益シェアを確保し、2024年から2032年までの予測期間中もその地位を維持すると予想されます。彼らの戦略には、水不足が深刻な地域へのソーラー型淡水化プラントの配備、有効性を実証するためのパイロットプロジェクトへの関与、ソーラー型淡水化に対する政策支援を推進するための政府や国際機関との協力などが含まれます。さらに、資金調達の選択肢や革新的なビジネスモデルを模索することで、高い資本コストへの対応にも積極的に取り組んでいます。
本レポートで扱う主な質問
ソーラー型淡水化プラント市場の成長に影響を与えている主要なミクロおよびマクロ環境要因は何か?
現在および予測期間中の製品セグメントと地域に関する主な投資ポケットは?
2032年までの推定推計・市場予測
予測期間中に最も速いCAGRを占めるセグメントは?
市場シェアの大きいセグメントとその理由は?
中低所得国はソーラー型淡水化プラント市場に投資しているか?
ソーラー型淡水化プラント市場で最大の地域市場はどこか?
アジア太平洋、ラテンアメリカ、中東・アフリカなどの新興市場における市場動向と力学は?
ソーラー型淡水化プラント市場の成長を促進する主要動向は?
世界のソーラー型淡水化プラント市場で存在感を高めるための主要な競合企業とその主要戦略とは?
目次
第1章 序文
- レポート内容
- 報告書の目的
- 対象者
- 主な提供商品
- 市場セグメンテーション
- 調査手法
- フェーズⅠ-二次調査
- フェーズⅡ-一次調査
- フェーズⅢ-有識者レビュー
- 前提条件
- 採用したアプローチ
第2章 エグゼクティブサマリー
第3章 ソーラー型淡水化プラント市場:競合分析
- 主要ベンダーの市場での位置付け
- ベンダーが採用する戦略
- 主要な産業戦略
- ティア分析:2023 vs 2031年
第4章 ソーラー型淡水化プラント市場:マクロ分析と市場力学
- イントロダクション
- 世界のソーラー型淡水化プラント市場金額 2021-2031年
- 市場力学
- 市場促進要因
- 市場抑制要因
- 主な課題
- 主な機会
- 促進要因と抑制要因の影響分析
- シーソー分析
- ポーターのファイブフォースモデル
- サプライヤーパワー
- バイヤーパワー
- 代替品の脅威
- 新規参入業者の脅威
- 競争企業間の敵対関係
- PESTEL分析
- 政治的情勢
- 経済情勢
- テクノロジーの情勢
- 法的情勢
- 社会的情勢
第5章 ソーラー型淡水化プラント市場:方法別 2022-2032年
- 市場概要
- 成長・収益分析:2023 vs 2031年
- 市場セグメンテーション
- 直接
- 間接的
第6章 ソーラー型淡水化プラント市場:容量別 2022-2032年
- 市場概要
- 成長・収益分析:2023 vs 2031年
- 市場セグメンテーション
- 5000立方メートル/日 未満
- 5001~10000立方メートル/日
- 10001~20000立方メートル/日
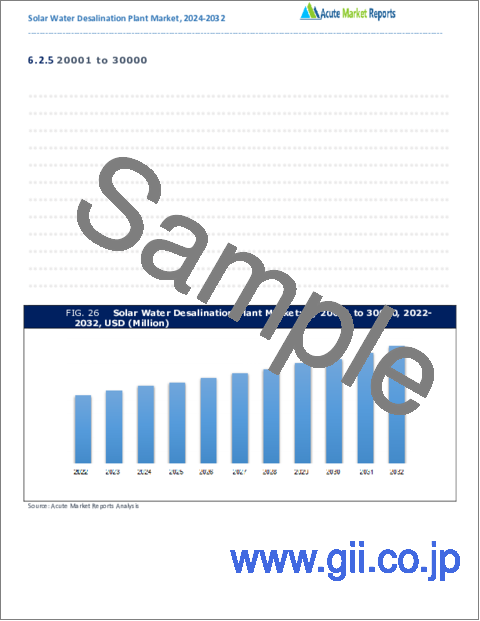
- 20001~30000立方メートル/日
- 30001~40000立方メートル/日
- 40001~50000立方メートル/日
- 50000立方メートル/日 超
第7章 ソーラー型淡水化プラント市場:技術別 2022-2032年
- 市場概要
- 成長・収益分析:2023 vs 2031年
- 市場セグメンテーション
- 熱淡水化
- シンプルスチル
- MEH(多重効用加湿)
- MED(多重効用蒸留)
- MES(多重効用ソーラー型淡水化)
- MSF(マルチステージフラッシュ)
- 膜脱塩
- RO(逆浸透)
- EDR(電気透析逆転)
- MD(膜蒸留)
- 熱淡水化
第8章 ソーラー型淡水化プラント市場:最終用途別 2022-2032年
- 市場概要
- 成長・収益分析:2023 vs 2031年
- 市場セグメンテーション
- 産業
- 農業
- 商業
- 自治体
第9章 北米のソーラー型淡水化プラント市場 2022-2032年
- 市場概要
- ソーラー型淡水化プラント市場:方法別 2022-2032年
- ソーラー型淡水化プラント市場:容量別 2022 -2032年
- ソーラー型淡水化プラント市場:技術別 2022-2032年
- ソーラー型淡水化プラント市場:最終用途別 2022-2032年
- ソーラー型淡水化プラント市場:地域別 2022-2032年
- 北米
- 米国
- カナダ
- その他北米地域
- 北米
第10章 英国と欧州連合のソーラー型淡水化プラント市場 2022-2032年
- 市場概要
- ソーラー型淡水化プラント市場:方法別 2022-2032年
- ソーラー型淡水化プラント市場:容量別 2022 -2032年
- ソーラー型淡水化プラント市場:技術別 2022-2032年
- ソーラー型淡水化プラント市場:最終用途別 2022-2032年
- ソーラー型淡水化プラント市場:地域別 2022-2032年
- 英国と欧州連合
- 英国
- ドイツ
- スペイン
- イタリア
- フランス
- その他欧州地域
- 英国と欧州連合
第11章 アジア太平洋のソーラー型淡水化プラント市場 2022-2032年
- 市場概要
- ソーラー型淡水化プラント市場:方法別 2022-2032年
- ソーラー型淡水化プラント市場:容量別 2022 -2032年
- ソーラー型淡水化プラント市場:技術別 2022-2032年
- ソーラー型淡水化プラント市場:最終用途別 2022-2032年
- ソーラー型淡水化プラント市場:地域別 2022-2032年
- アジア太平洋
- 中国
- 日本
- インド
- オーストラリア
- 韓国
- その他アジア太平洋
- アジア太平洋
第12章 ラテンアメリカのソーラー型淡水化プラント市場 2022-2032年
- 市場概要
- ソーラー型淡水化プラント市場:方法別 2022-2032年
- ソーラー型淡水化プラント市場:容量別 2022 -2032年
- ソーラー型淡水化プラント市場:技術別 2022-2032年
- ソーラー型淡水化プラント市場:最終用途別 2022-2032年
- ソーラー型淡水化プラント市場:地域別 2022-2032年
- ラテンアメリカ
- ブラジル
- メキシコ
- その他ラテンアメリカ地域
- ラテンアメリカ
第13章 中東・アフリカのソーラー型淡水化プラント市場 2022-2032年
- 市場概要
- ソーラー型淡水化プラント市場:方法別 2022-2032年
- ソーラー型淡水化プラント市場:容量別 2022 -2032年
- ソーラー型淡水化プラント市場:技術別 2022-2032年
- ソーラー型淡水化プラント市場:最終用途別 2022-2032年
- ソーラー型淡水化プラント市場:地域別 2022-2032年
- 中東・アフリカ
- GCC
- アフリカ
- その他中東・アフリカ地域
- 中東・アフリカ
第14章 企業プロファイル
- Abengoa Solar
- Acciona
- IDEXX Laboratories
- Elemental Water Makers B.V.
- F Cubed Limited
- Photon Energy Systems Limited
- Sinovoltaics Group
- Solar Water Solutions Ltd.
- Sterlitech Corporation
- Thermax Limited
- Trunz Water Systems AG
- Waaree Energies Ltd
- ANDRITZ
- その他の主要企業
List of Tables
- TABLE 1 Global Solar Water Desalination Plant Market By Method, 2022-2032, USD (Million)
- TABLE 2 Global Solar Water Desalination Plant Market By Capacity (Cubic Meter/Day), 2022-2032, USD (Million)
- TABLE 3 Global Solar Water Desalination Plant Market By Technology, 2022-2032, USD (Million)
- TABLE 4 Global Solar Water Desalination Plant Market By Thermal Desalination, 2022-2032, USD (Million)
TABLE 5 Global Solar Water Desalination Plant Market By Membrane Desalination, 2022-2032, USD (Million)
TABLE 6 Global Solar Water Desalination Plant Market By End-Use, 2022-2032, USD (Million)
- TABLE 7 North America Solar Water Desalination Plant Market By Method, 2022-2032, USD (Million)
- TABLE 8 North America Solar Water Desalination Plant Market By Capacity (Cubic Meter/Day), 2022-2032, USD (Million)
- TABLE 9 North America Solar Water Desalination Plant Market By Technology, 2022-2032, USD (Million)
- TABLE 10 North America Solar Water Desalination Plant Market By Thermal Desalination, 2022-2032, USD (Million)
TABLE 11 North America Solar Water Desalination Plant Market By Membrane Desalination, 2022-2032, USD (Million)
TABLE 12 North America Solar Water Desalination Plant Market By End-Use, 2022-2032, USD (Million)
- TABLE 13 U.S. Solar Water Desalination Plant Market By Method, 2022-2032, USD (Million)
- TABLE 14 U.S. Solar Water Desalination Plant Market By Capacity (Cubic Meter/Day), 2022-2032, USD (Million)
- TABLE 15 U.S. Solar Water Desalination Plant Market By Technology, 2022-2032, USD (Million)
- TABLE 16 U.S. Solar Water Desalination Plant Market By Thermal Desalination, 2022-2032, USD (Million)
TABLE 17 U.S. Solar Water Desalination Plant Market By Membrane Desalination, 2022-2032, USD (Million)
TABLE 18 U.S. Solar Water Desalination Plant Market By End-Use, 2022-2032, USD (Million)
- TABLE 19 Canada Solar Water Desalination Plant Market By Method, 2022-2032, USD (Million)
- TABLE 20 Canada Solar Water Desalination Plant Market By Capacity (Cubic Meter/Day), 2022-2032, USD (Million)
- TABLE 21 Canada Solar Water Desalination Plant Market By Technology, 2022-2032, USD (Million)
- TABLE 22 Canada Solar Water Desalination Plant Market By Thermal Desalination, 2022-2032, USD (Million)
TABLE 23 Canada Solar Water Desalination Plant Market By Membrane Desalination, 2022-2032, USD (Million)
TABLE 24 Canada Solar Water Desalination Plant Market By End-Use, 2022-2032, USD (Million)
- TABLE 25 Rest of North America Solar Water Desalination Plant Market By Method, 2022-2032, USD (Million)
- TABLE 26 Rest of North America Solar Water Desalination Plant Market By Capacity (Cubic Meter/Day), 2022-2032, USD (Million)
- TABLE 27 Rest of North America Solar Water Desalination Plant Market By Technology, 2022-2032, USD (Million)
- TABLE 28 Rest of North America Solar Water Desalination Plant Market By Thermal Desalination, 2022-2032, USD (Million)
TABLE 29 Rest of North America Solar Water Desalination Plant Market By Membrane Desalination, 2022-2032, USD (Million)
TABLE 30 Rest of North America Solar Water Desalination Plant Market By End-Use, 2022-2032, USD (Million)
- TABLE 31 UK and European Union Solar Water Desalination Plant Market By Method, 2022-2032, USD (Million)
- TABLE 32 UK and European Union Solar Water Desalination Plant Market By Capacity (Cubic Meter/Day), 2022-2032, USD (Million)
- TABLE 33 UK and European Union Solar Water Desalination Plant Market By Technology, 2022-2032, USD (Million)
- TABLE 34 UK and European Union Solar Water Desalination Plant Market By Thermal Desalination, 2022-2032, USD (Million)
TABLE 35 UK and European Union Solar Water Desalination Plant Market By Membrane Desalination, 2022-2032, USD (Million)
TABLE 36 UK and European Union Solar Water Desalination Plant Market By End-Use, 2022-2032, USD (Million)
- TABLE 37 UK Solar Water Desalination Plant Market By Method, 2022-2032, USD (Million)
- TABLE 38 UK Solar Water Desalination Plant Market By Capacity (Cubic Meter/Day), 2022-2032, USD (Million)
- TABLE 39 UK Solar Water Desalination Plant Market By Technology, 2022-2032, USD (Million)
- TABLE 40 UK Solar Water Desalination Plant Market By Thermal Desalination, 2022-2032, USD (Million)
TABLE 41 UK Solar Water Desalination Plant Market By Membrane Desalination, 2022-2032, USD (Million)
TABLE 42 UK Solar Water Desalination Plant Market By End-Use, 2022-2032, USD (Million)
- TABLE 43 Germany Solar Water Desalination Plant Market By Method, 2022-2032, USD (Million)
- TABLE 44 Germany Solar Water Desalination Plant Market By Capacity (Cubic Meter/Day), 2022-2032, USD (Million)
- TABLE 45 Germany Solar Water Desalination Plant Market By Technology, 2022-2032, USD (Million)
- TABLE 46 Germany Solar Water Desalination Plant Market By Thermal Desalination, 2022-2032, USD (Million)
TABLE 47 Germany Solar Water Desalination Plant Market By Membrane Desalination, 2022-2032, USD (Million)
TABLE 48 Germany Solar Water Desalination Plant Market By End-Use, 2022-2032, USD (Million)
- TABLE 49 Spain Solar Water Desalination Plant Market By Method, 2022-2032, USD (Million)
- TABLE 50 Spain Solar Water Desalination Plant Market By Capacity (Cubic Meter/Day), 2022-2032, USD (Million)
- TABLE 51 Spain Solar Water Desalination Plant Market By Technology, 2022-2032, USD (Million)
- TABLE 52 Spain Solar Water Desalination Plant Market By Thermal Desalination, 2022-2032, USD (Million)
TABLE 53 Spain Solar Water Desalination Plant Market By Membrane Desalination, 2022-2032, USD (Million)
TABLE 54 Spain Solar Water Desalination Plant Market By End-Use, 2022-2032, USD (Million)
- TABLE 55 Italy Solar Water Desalination Plant Market By Method, 2022-2032, USD (Million)
- TABLE 56 Italy Solar Water Desalination Plant Market By Capacity (Cubic Meter/Day), 2022-2032, USD (Million)
- TABLE 57 Italy Solar Water Desalination Plant Market By Technology, 2022-2032, USD (Million)
- TABLE 58 Italy Solar Water Desalination Plant Market By Thermal Desalination, 2022-2032, USD (Million)
TABLE 59 Italy Solar Water Desalination Plant Market By Membrane Desalination, 2022-2032, USD (Million)
TABLE 60 Italy Solar Water Desalination Plant Market By End-Use, 2022-2032, USD (Million)
- TABLE 61 France Solar Water Desalination Plant Market By Method, 2022-2032, USD (Million)
- TABLE 62 France Solar Water Desalination Plant Market By Capacity (Cubic Meter/Day), 2022-2032, USD (Million)
- TABLE 63 France Solar Water Desalination Plant Market By Technology, 2022-2032, USD (Million)
- TABLE 64 France Solar Water Desalination Plant Market By Thermal Desalination, 2022-2032, USD (Million)
TABLE 65 France Solar Water Desalination Plant Market By Membrane Desalination, 2022-2032, USD (Million)
TABLE 66 France Solar Water Desalination Plant Market By End-Use, 2022-2032, USD (Million)
- TABLE 67 Rest of Europe Solar Water Desalination Plant Market By Method, 2022-2032, USD (Million)
- TABLE 68 Rest of Europe Solar Water Desalination Plant Market By Capacity (Cubic Meter/Day), 2022-2032, USD (Million)
- TABLE 69 Rest of Europe Solar Water Desalination Plant Market By Technology, 2022-2032, USD (Million)
- TABLE 70 Rest of Europe Solar Water Desalination Plant Market By Thermal Desalination, 2022-2032, USD (Million)
TABLE 71 Rest of Europe Solar Water Desalination Plant Market By Membrane Desalination, 2022-2032, USD (Million)
TABLE 72 Rest of Europe Solar Water Desalination Plant Market By End-Use, 2022-2032, USD (Million)
- TABLE 73 Asia Solar Water Desalination Plant Market By Method, 2022-2032, USD (Million)
- TABLE 74 Asia Solar Water Desalination Plant Market By Capacity (Cubic Meter/Day), 2022-2032, USD (Million)
- TABLE 75 Asia Solar Water Desalination Plant Market By Technology, 2022-2032, USD (Million)
- TABLE 76 Asia Solar Water Desalination Plant Market By Thermal Desalination, 2022-2032, USD (Million)
TABLE 77 Asia Solar Water Desalination Plant Market By Membrane Desalination, 2022-2032, USD (Million)
TABLE 78 Asia Solar Water Desalination Plant Market By End-Use, 2022-2032, USD (Million)
- TABLE 79 China Solar Water Desalination Plant Market By Method, 2022-2032, USD (Million)
- TABLE 80 China Solar Water Desalination Plant Market By Capacity (Cubic Meter/Day), 2022-2032, USD (Million)
- TABLE 81 China Solar Water Desalination Plant Market By Technology, 2022-2032, USD (Million)
- TABLE 82 China Solar Water Desalination Plant Market By Thermal Desalination, 2022-2032, USD (Million)
TABLE 83 China Solar Water Desalination Plant Market By Membrane Desalination, 2022-2032, USD (Million)
TABLE 84 China Solar Water Desalination Plant Market By End-Use, 2022-2032, USD (Million)
- TABLE 85 Japan Solar Water Desalination Plant Market By Method, 2022-2032, USD (Million)
- TABLE 86 Japan Solar Water Desalination Plant Market By Capacity (Cubic Meter/Day), 2022-2032, USD (Million)
- TABLE 87 Japan Solar Water Desalination Plant Market By Technology, 2022-2032, USD (Million)
- TABLE 88 Japan Solar Water Desalination Plant Market By Thermal Desalination, 2022-2032, USD (Million)
TABLE 89 Japan Solar Water Desalination Plant Market By Membrane Desalination, 2022-2032, USD (Million)
TABLE 90 Japan Solar Water Desalination Plant Market By End-Use, 2022-2032, USD (Million)
- TABLE 91 India Solar Water Desalination Plant Market By Method, 2022-2032, USD (Million)
- TABLE 92 India Solar Water Desalination Plant Market By Capacity (Cubic Meter/Day), 2022-2032, USD (Million)
- TABLE 93 India Solar Water Desalination Plant Market By Technology, 2022-2032, USD (Million)
- TABLE 94 India Solar Water Desalination Plant Market By Thermal Desalination, 2022-2032, USD (Million)
TABLE 95 India Solar Water Desalination Plant Market By Membrane Desalination, 2022-2032, USD (Million)
TABLE 96 India Solar Water Desalination Plant Market By End-Use, 2022-2032, USD (Million)
- TABLE 97 Australia Solar Water Desalination Plant Market By Method, 2022-2032, USD (Million)
- TABLE 98 Australia Solar Water Desalination Plant Market By Capacity (Cubic Meter/Day), 2022-2032, USD (Million)
- TABLE 99 Australia Solar Water Desalination Plant Market By Technology, 2022-2032, USD (Million)
- TABLE 100 Australia Solar Water Desalination Plant Market By Thermal Desalination, 2022-2032, USD (Million)
TABLE 101 Australia Solar Water Desalination Plant Market By Membrane Desalination, 2022-2032, USD (Million)
TABLE 102 Australia Solar Water Desalination Plant Market By End-Use, 2022-2032, USD (Million)
- TABLE 103 South Korea Solar Water Desalination Plant Market By Method, 2022-2032, USD (Million)
- TABLE 104 South Korea Solar Water Desalination Plant Market By Capacity (Cubic Meter/Day), 2022-2032, USD (Million)
- TABLE 105 South Korea Solar Water Desalination Plant Market By Technology, 2022-2032, USD (Million)
- TABLE 106 South Korea Solar Water Desalination Plant Market By Thermal Desalination, 2022-2032, USD (Million)
TABLE 107 South Korea Solar Water Desalination Plant Market By Membrane Desalination, 2022-2032, USD (Million)
TABLE 108 South Korea Solar Water Desalination Plant Market By End-Use, 2022-2032, USD (Million)
- TABLE 109 Latin America Solar Water Desalination Plant Market By Method, 2022-2032, USD (Million)
- TABLE 110 Latin America Solar Water Desalination Plant Market By Capacity (Cubic Meter/Day), 2022-2032, USD (Million)
- TABLE 111 Latin America Solar Water Desalination Plant Market By Technology, 2022-2032, USD (Million)
- TABLE 112 Latin America Solar Water Desalination Plant Market By Thermal Desalination, 2022-2032, USD (Million)
TABLE 113 Latin America Solar Water Desalination Plant Market By Membrane Desalination, 2022-2032, USD (Million)
TABLE 114 Latin America Solar Water Desalination Plant Market By End-Use, 2022-2032, USD (Million)
- TABLE 115 Brazil Solar Water Desalination Plant Market By Method, 2022-2032, USD (Million)
- TABLE 116 Brazil Solar Water Desalination Plant Market By Capacity (Cubic Meter/Day), 2022-2032, USD (Million)
- TABLE 117 Brazil Solar Water Desalination Plant Market By Technology, 2022-2032, USD (Million)
- TABLE 118 Brazil Solar Water Desalination Plant Market By Thermal Desalination, 2022-2032, USD (Million)
TABLE 119 Brazil Solar Water Desalination Plant Market By Membrane Desalination, 2022-2032, USD (Million)
TABLE 120 Brazil Solar Water Desalination Plant Market By End-Use, 2022-2032, USD (Million)
- TABLE 121 Mexico Solar Water Desalination Plant Market By Method, 2022-2032, USD (Million)
- TABLE 122 Mexico Solar Water Desalination Plant Market By Capacity (Cubic Meter/Day), 2022-2032, USD (Million)
- TABLE 123 Mexico Solar Water Desalination Plant Market By Technology, 2022-2032, USD (Million)
- TABLE 124 Mexico Solar Water Desalination Plant Market By Thermal Desalination, 2022-2032, USD (Million)
TABLE 125 Mexico Solar Water Desalination Plant Market By Membrane Desalination, 2022-2032, USD (Million)
TABLE 126 Mexico Solar Water Desalination Plant Market By End-Use, 2022-2032, USD (Million)
- TABLE 127 Rest of Latin America Solar Water Desalination Plant Market By Method, 2022-2032, USD (Million)
- TABLE 128 Rest of Latin America Solar Water Desalination Plant Market By Capacity (Cubic Meter/Day), 2022-2032, USD (Million)
- TABLE 129 Rest of Latin America Solar Water Desalination Plant Market By Technology, 2022-2032, USD (Million)
- TABLE 130 Rest of Latin America Solar Water Desalination Plant Market By Thermal Desalination, 2022-2032, USD (Million)
TABLE 131 Rest of Latin America Solar Water Desalination Plant Market By Membrane Desalination, 2022-2032, USD (Million)
TABLE 132 Rest of Latin America Solar Water Desalination Plant Market By End-Use, 2022-2032, USD (Million)
- TABLE 133 Middle East and Africa Solar Water Desalination Plant Market By Method, 2022-2032, USD (Million)
- TABLE 134 Middle East and Africa Solar Water Desalination Plant Market By Capacity (Cubic Meter/Day), 2022-2032, USD (Million)
- TABLE 135 Middle East and Africa Solar Water Desalination Plant Market By Technology, 2022-2032, USD (Million)
- TABLE 136 Middle East and Africa Solar Water Desalination Plant Market By Thermal Desalination, 2022-2032, USD (Million)
TABLE 137 Middle East and Africa Solar Water Desalination Plant Market By Membrane Desalination, 2022-2032, USD (Million)
TABLE 138 Middle East and Africa Solar Water Desalination Plant Market By End-Use, 2022-2032, USD (Million)
- TABLE 139 GCC Solar Water Desalination Plant Market By Method, 2022-2032, USD (Million)
- TABLE 140 GCC Solar Water Desalination Plant Market By Capacity (Cubic Meter/Day), 2022-2032, USD (Million)
- TABLE 141 GCC Solar Water Desalination Plant Market By Technology, 2022-2032, USD (Million)
- TABLE 142 GCC Solar Water Desalination Plant Market By Thermal Desalination, 2022-2032, USD (Million)
TABLE 143 GCC Solar Water Desalination Plant Market By Membrane Desalination, 2022-2032, USD (Million)
TABLE 144 GCC Solar Water Desalination Plant Market By End-Use, 2022-2032, USD (Million)
- TABLE 145 Africa Solar Water Desalination Plant Market By Method, 2022-2032, USD (Million)
- TABLE 146 Africa Solar Water Desalination Plant Market By Capacity (Cubic Meter/Day), 2022-2032, USD (Million)
- TABLE 147 Africa Solar Water Desalination Plant Market By Technology, 2022-2032, USD (Million)
- TABLE 148 Africa Solar Water Desalination Plant Market By Thermal Desalination, 2022-2032, USD (Million)
TABLE 149 Africa Solar Water Desalination Plant Market By Membrane Desalination, 2022-2032, USD (Million)
TABLE 150 Africa Solar Water Desalination Plant Market By End-Use, 2022-2032, USD (Million)
- TABLE 151 Rest of Middle East and Africa Solar Water Desalination Plant Market By Method, 2022-2032, USD (Million)
- TABLE 152 Rest of Middle East and Africa Solar Water Desalination Plant Market By Capacity (Cubic Meter/Day), 2022-2032, USD (Million)
- TABLE 153 Rest of Middle East and Africa Solar Water Desalination Plant Market By Technology, 2022-2032, USD (Million)
- TABLE 154 Rest of Middle East and Africa Solar Water Desalination Plant Market By Thermal Desalination, 2022-2032, USD (Million)
TABLE 155 Rest of Middle East and Africa Solar Water Desalination Plant Market By Membrane Desalination, 2022-2032, USD (Million)
TABLE 156 Rest of Middle East and Africa Solar Water Desalination Plant Market By End-Use, 2022-2032, USD (Million)
List of Figures
- FIG. 1 Global Solar Water Desalination Plant Market: Market Coverage
- FIG. 2 Research Methodology and Data Sources
- FIG. 3 Market Size Estimation - Top Down & Bottom-Up Approach
- FIG. 4 Global Solar Water Desalination Plant Market: Quality Assurance
- FIG. 5 Global Solar Water Desalination Plant Market, By Method, 2023
- FIG. 6 Global Solar Water Desalination Plant Market, By Capacity (Cubic Meter/Day), 2023
- FIG. 7 Global Solar Water Desalination Plant Market, By Technology, 2023
- FIG. 8 Global Solar Water Desalination Plant Market, By End-Use, 2023
- FIG. 9 Global Solar Water Desalination Plant Market, By Geography, 2023
- FIG. 10 Market Geographical Opportunity Matrix - Global Solar Water Desalination Plant Market, 2023
FIG. 11Market Positioning of Key Solar Water Desalination Plant Market Players, 2023
FIG. 12Global Solar Water Desalination Plant Market - Tier Analysis - Percentage of Revenues by Tier Level, 2023 Versus 2031
- FIG. 13 Global Solar Water Desalination Plant Market, By Method, 2023 Vs 2032, %
- FIG. 14 Global Solar Water Desalination Plant Market, By Capacity (Cubic Meter/Day), 2023 Vs 2032, %
- FIG. 15 Global Solar Water Desalination Plant Market, By Technology, 2023 Vs 2032, %
- FIG. 16 Global Solar Water Desalination Plant Market, By End-Use, 2023 Vs 2032, %
- FIG. 17 U.S. Solar Water Desalination Plant Market (US$ Million), 2022 - 2032
- FIG. 18 Canada Solar Water Desalination Plant Market (US$ Million), 2022 - 2032
- FIG. 19 Rest of North America Solar Water Desalination Plant Market (US$ Million), 2022 - 2032
- FIG. 20 UK Solar Water Desalination Plant Market (US$ Million), 2022 - 2032
- FIG. 21 Germany Solar Water Desalination Plant Market (US$ Million), 2022 - 2032
- FIG. 22 Spain Solar Water Desalination Plant Market (US$ Million), 2022 - 2032
- FIG. 23 Italy Solar Water Desalination Plant Market (US$ Million), 2022 - 2032
- FIG. 24 France Solar Water Desalination Plant Market (US$ Million), 2022 - 2032
- FIG. 25 Rest of Europe Solar Water Desalination Plant Market (US$ Million), 2022 - 2032
- FIG. 26 China Solar Water Desalination Plant Market (US$ Million), 2022 - 2032
- FIG. 27 Japan Solar Water Desalination Plant Market (US$ Million), 2022 - 2032
- FIG. 28 India Solar Water Desalination Plant Market (US$ Million), 2022 - 2032
- FIG. 29 Australia Solar Water Desalination Plant Market (US$ Million), 2022 - 2032
- FIG. 30 South Korea Solar Water Desalination Plant Market (US$ Million), 2022 - 2032
- FIG. 31 Rest of Asia Solar Water Desalination Plant Market (US$ Million), 2022 - 2032
- FIG. 32 Brazil Solar Water Desalination Plant Market (US$ Million), 2022 - 2032
- FIG. 33 Mexico Solar Water Desalination Plant Market (US$ Million), 2022 - 2032
- FIG. 34 Rest of Latin America Solar Water Desalination Plant Market (US$ Million), 2022 - 2032
- FIG. 35 GCC Solar Water Desalination Plant Market (US$ Million), 2022 - 2032
- FIG. 36 Africa Solar Water Desalination Plant Market (US$ Million), 2022 - 2032
- FIG. 37 Rest of Middle East and Africa Solar Water Desalination Plant Market (US$ Million), 2022 - 2032
The solar water desalination plant market is a critical and innovative segment in the field of clean water production. The solar water desalination plant market is expected to experience a CAGR of 7.7% during the forecast period, driven by renewable energy integration, environmental sustainability, and the urgent need to address water scarcity. While high initial capital costs present a significant restraint, the market is expected to expand, especially in regions where solar desalination aligns with water supply challenges and sustainability goals. The competitive landscape is marked by key players committed to delivering eco-friendly and reliable water solutions and adapting to the changing needs of communities and industries.
Renewable Energy Integration
Solar Power Synergy: One of the primary drivers propelling the solar water desalination plant market is the integration of renewable energy sources, particularly solar power. In 2024, there was a substantial increase in the use of solar energy for desalination processes. Solar desalination plants have gained prominence due to their ability to harness abundant solar energy, reducing operational costs and environmental impact. This trend is expected to continue into the forecast period from 2024 to 2032 as renewable energy becomes more integral to global clean water production.
Energy Independence and Grid Resilience: The growing emphasis on energy independence and grid resilience is another significant driver. In 2024, regions prone to water scarcity explored solar water desalination as a means to secure their water supply independently of centralized power grids. Solar desalination plants offer a decentralized and reliable solution, particularly in remote or disaster-prone areas. This trend is anticipated to persist during the forecast period as communities and industries seek energy-efficient and self-sustaining water sources.
Environmental Sustainability
Reducing Carbon Footprint: The second key driver is the commitment to environmental sustainability. In 2024, concerns over climate change and environmental impact led to increased adoption of solar desalination. These plants produce fresh water with a significantly lower carbon footprint compared to traditional desalination methods. This trend is expected to continue into the forecast period, with governments, industries, and environmental organizations promoting solar-powered desalination as a responsible and eco-friendly approach
Water Scarcity Mitigation
Addressing Water Scarcity: The third driver is the urgent need to address water scarcity. In 2024, regions experiencing water scarcity, particularly in arid climates, invested in solar water desalination as a strategic solution. These systems provide a reliable source of fresh water, even in challenging environments, and contribute to mitigating water stress. This trend is anticipated to persist during the forecast period as water scarcity remains a pressing global issue, and solar desalination proves its effectiveness.
High Initial Capital Costs (300 words)
Financial Barrier: A significant restraint impacting the solar water desalination plant market is the high initial capital costs. In 2024, the upfront expenses associated with the establishment of solar desalination plants were a barrier for some potential adopters. These costs encompass the purchase of solar panels, desalination equipment, and infrastructure. This restraint is expected to persist during the forecast period, especially in regions with limited financial resources. Addressing this challenge requires innovative financing models and cost-reduction measures.
Method (Direct, Indirect): Direct Methods Dominate the Market
In 2024, direct solar water desalination methods recorded the highest revenue due to their efficiency and ability to convert solar energy directly into fresh water. However, during the forecast period from 2024 to 2032, the indirect method is expected to exhibit the highest compound annual growth rate (CAGR). Indirect methods, which involve the use of solar energy for electricity generation and subsequent desalination, offer a more flexible and scalable approach. While direct methods are expected to maintain their revenue leadership, indirect methods are likely to experience rapid growth due to their adaptability.
End-Use Levels (Industrial, Agriculture, Commercial, Municipal): The Industrial Sector Dominates the Market
In 2024, the industrial sector recorded the highest revenue due to its significant water requirements for various processes. However, during the forecast period from 2024 to 2032, the municipal sector is expected to exhibit the highest CAGR. Municipalities are increasingly adopting solar desalination to ensure a sustainable and decentralized water supply for their communities. While the industrial sector is expected to maintain its revenue leadership, the municipal sector is poised for substantial growth.
Middle East and Africa Remain as Global Leaders
The geographic trends in the solar water desalination plant market indicate that regions with high solar irradiance and severe water scarcity, such as the Middle East and Africa (MENA) region, witnessed substantial growth in 2024. These regions are also expected to continue experiencing the highest CAGR during the forecast period. Additionally, North America, particularly areas with both ample sunlight and water challenges, is another region with significant revenue percentages in 2024 and is expected to maintain this position during the forecast period, driven by the integration of solar desalination into water management strategies.
Market Competition to Intensify during the Forecast Period
In the competitive landscape of the solar water desalination plant market, key players such as Abengoa Solar, Acciona, IDEXX Laboratories, Elemental Water Makers B.V., F Cubed Limited, Photon Energy Systems Limited, Sinovoltaics Group, Solar Water Solutions Ltd., Sterlitech Corporation, Thermax Limited, Trunz Water Systems AG, Waaree Energies Ltd, and ANDRITZ have been at the forefront of innovation and product development. These companies have consistently invested in research and development to enhance their desalination technologies and have formed strategic partnerships with local governments and utilities to implement solar desalination solutions. In 2024, these industry leaders secured substantial revenue shares, and they are expected to maintain their positions during the forecast period from 2024 to 2032. Their strategies encompass deploying solar desalination plants in regions with severe water scarcity, engaging in pilot projects to demonstrate effectiveness, and collaborating with governments and international organizations to drive policy support for solar water desalination. Moreover, they are actively involved in addressing high capital costs by exploring financing options and innovative business models
Historical & Forecast Period
This study report represents analysis of each segment from 2022 to 2032 considering 2023 as the base year. Compounded Annual Growth Rate (CAGR) for each of the respective segments estimated for the forecast period of 2024 to 2032.
The current report comprises of quantitative market estimations for each micro market for every geographical region and qualitative market analysis such as micro and macro environment analysis, market trends, competitive intelligence, segment analysis, porters five force model, top winning strategies, top investment markets, emerging trends and technological analysis, case studies, strategic conclusions and recommendations and other key market insights.
Research Methodology
The complete research study was conducted in three phases, namely: secondary research, primary research, and expert panel review. key data point that enables the estimation ofSolar Water Desalination Plant market are as follows:
Research and development budgets of manufacturers and government spending
Revenues of key companies in the market segment
Number of end users and consumption volume, price and value.
Geographical revenues generate by countries considered in the report
Micro and macro environment factors that are currently influencing the Solar Water Desalination Plant market and their expected impact during the forecast period.
Market forecast was performed through proprietary software that analyzes various qualitative and quantitative factors. Growth rate and CAGR were estimated through intensive secondary and primary research. Data triangulation across various data points provides accuracy across various analyzed market segments in the report. Application of both top down and bottom-up approach for validation of market estimation assures logical, methodical and mathematical consistency of the quantitative data.
Market Segmentation
Method
- Direct
- Indirect
Capacity (Cubic Meter/Day)
- Up to 5000
5001 to 10000
10001 to 20000
20001 to 300000
30001 to 40000
40001 to 50000
- Above 50000
Technology
- Thermal Desalination
- Simple Still
- MEH (Multi-effect Humidification)
- MED (Multi-effect Distillation)
- MES (Multi-effect Solar Desalination)
- MSF (Multi-stage Flash)
- Membrane Desalination
- RO (Reverse Osmosis)
- EDR (Electrodialysis Reversal)
- MD (Membrane Distillation)
End-Use
- Industrial
- Agriculture
- Commercial
- Municipal
Region Segment (2022-2032; US$ Million)
North America
U.S.
Canada
Rest of North America
UK and European Union
UK
Germany
Spain
Italy
France
Rest of Europe
Asia Pacific
China
Japan
India
Australia
South Korea
Rest of Asia Pacific
Latin America
Brazil
Mexico
Rest of Latin America
Middle East and Africa
GCC
Africa
Rest of Middle East and Africa
Key questions answered in this report
What are the key micro and macro environmental factors that are impacting the growth of Solar Water Desalination Plant market?
What are the key investment pockets with respect to product segments and geographies currently and during the forecast period?
Estimated forecast and market projections up to 2032.
Which segment accounts for the fastest CAGR during the forecast period?
Which market segment holds a larger market share and why?
Are low and middle-income economies investing in the Solar Water Desalination Plant market?
Which is the largest regional market for Solar Water Desalination Plant market?
What are the market trends and dynamics in emerging markets such as Asia Pacific, Latin America, and Middle East & Africa?
Which are the key trends driving Solar Water Desalination Plant market growth?
Who are the key competitors and what are their key strategies to enhance their market presence in the Solar Water Desalination Plant market worldwide?
Table of Contents
1. Preface
- 1.1. Report Description
- 1.1.1. Purpose of the Report
- 1.1.2. Target Audience
- 1.1.3. Key Offerings
- 1.2. Market Segmentation
- 1.3. Research Methodology
- 1.3.1. Phase I - Secondary Research
- 1.3.2. Phase II - Primary Research
- 1.3.3. Phase III - Expert Panel Review
- 1.3.4. Assumptions
- 1.3.5. Approach Adopted
2. Executive Summary
- 2.1. Market Snapshot: Global Solar Water Desalination Plant Market
- 2.2. Global Solar Water Desalination Plant Market, By Method, 2023 (US$ Million)
- 2.3. Global Solar Water Desalination Plant Market, By Capacity (Cubic Meter/Day), 2023 (US$ Million)
- 2.4. Global Solar Water Desalination Plant Market, By Technology, 2023 (US$ Million)
- 2.5. Global Solar Water Desalination Plant Market, By End-Use, 2023 (US$ Million)
- 2.6. Global Solar Water Desalination Plant Market, By Geography, 2023 (US$ Million)
- 2.7. Attractive Investment Proposition by Geography, 2023
3. Solar Water Desalination Plant Market: Competitive Analysis
- 3.1. Market Positioning of Key Solar Water Desalination Plant Market Vendors
- 3.2. Strategies Adopted by Solar Water Desalination Plant Market Vendors
- 3.3. Key Industry Strategies
- 3.4. Tier Analysis 2023 Versus 2031
4. Solar Water Desalination Plant Market: Macro Analysis & Market Dynamics
- 4.1. Introduction
- 4.2. Global Solar Water Desalination Plant Market Value, 2021 - 2031, (US$ Million)
- 4.3. Market Dynamics
- 4.3.1. Market Drivers
- 4.3.2. Market Restraints
- 4.3.3. Key Challenges
- 4.3.4. Key Opportunities
- 4.4. Impact Analysis of Drivers and Restraints
- 4.5. See-Saw Analysis
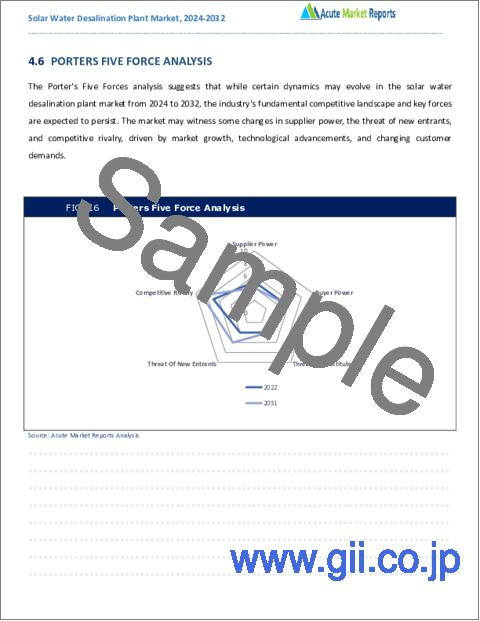
- 4.6. Porter's Five Force Model
- 4.6.1. Supplier Power
- 4.6.2. Buyer Power
- 4.6.3. Threat Of Substitutes
- 4.6.4. Threat Of New Entrants
- 4.6.5. Competitive Rivalry
- 4.7. PESTEL Analysis
- 4.7.1. Political Landscape
- 4.7.2. Economic Landscape
- 4.7.3. Technology Landscape
- 4.7.4. Legal Landscape
- 4.7.5. Social Landscape
5. Solar Water Desalination Plant Market: By Method, 2022-2032, USD (Million)
- 5.1. Market Overview
- 5.2. Growth & Revenue Analysis: 2023 Versus 2031
- 5.3. Market Segmentation
- 5.3.1. Direct
- 5.3.2. Indirect
6. Solar Water Desalination Plant Market: By Capacity (Cubic Meter/Day), 2022-2032, USD (Million)
- 6.1. Market Overview
- 6.2. Growth & Revenue Analysis: 2023 Versus 2031
- 6.3. Market Segmentation
- 6.3.1. Up to 5000
- 6.3.2. 5001 to 10000
- 6.3.3. 10001 to 20000
- 6.3.4. 20001 to 300000
- 6.3.5. 30001 to 40000
- 6.3.6. 40001 to 50000
- 6.3.7. Above 50000
7. Solar Water Desalination Plant Market: By Technology, 2022-2032, USD (Million)
- 7.1. Market Overview
- 7.2. Growth & Revenue Analysis: 2023 Versus 2031
- 7.3. Market Segmentation
- 7.3.1. Thermal Desalination
- 7.3.1.1. Simple Still
- 7.3.1.2. MEH (Multi-effect Humidification)
- 7.3.1.3. MED (Multi-effect Distillation)
- 7.3.1.4. MES (Multi-effect Solar Desalination)
- 7.3.1.5. MSF (Multi-stage Flash)
- 7.3.2. Membrane Desalination
- 7.3.2.1. RO (Reverse Osmosis)
- 7.3.2.2. EDR (Electrodialysis Reversal)
- 7.3.2.3. MD (Membrane Distillation)
- 7.3.1. Thermal Desalination
8. Solar Water Desalination Plant Market: By End-Use, 2022-2032, USD (Million)
- 8.1. Market Overview
- 8.2. Growth & Revenue Analysis: 2023 Versus 2031
- 8.3. Market Segmentation
- 8.3.1. Industrial
- 8.3.2. Agriculture
- 8.3.3. Commercial
- 8.3.4. Municipal
9. North America Solar Water Desalination Plant Market, 2022-2032, USD (Million)
- 9.1. Market Overview
- 9.2. Solar Water Desalination Plant Market: By Method, 2022-2032, USD (Million)
- 9.3. Solar Water Desalination Plant Market: By Capacity (Cubic Meter/Day), 2022-2032, USD (Million)
- 9.4. Solar Water Desalination Plant Market: By Technology, 2022-2032, USD (Million)
- 9.5. Solar Water Desalination Plant Market: By End-Use, 2022-2032, USD (Million)
- 9.6.Solar Water Desalination Plant Market: By Region, 2022-2032, USD (Million)
- 9.6.1.North America
- 9.6.1.1. U.S.
- 9.6.1.1.1. Solar Water Desalination Plant Market: By Method, 2022-2032, USD (Million)
- 9.6.1.1.2. Solar Water Desalination Plant Market: By Capacity (Cubic Meter/Day), 2022-2032, USD (Million)
- 9.6.1.1.3. Solar Water Desalination Plant Market: By Technology, 2022-2032, USD (Million)
- 9.6.1.1.4. Solar Water Desalination Plant Market: By End-Use, 2022-2032, USD (Million)
- 9.6.1.2. Canada
- 9.6.1.2.1. Solar Water Desalination Plant Market: By Method, 2022-2032, USD (Million)
- 9.6.1.2.2. Solar Water Desalination Plant Market: By Capacity (Cubic Meter/Day), 2022-2032, USD (Million)
- 9.6.1.2.3. Solar Water Desalination Plant Market: By Technology, 2022-2032, USD (Million)
- 9.6.1.2.4. Solar Water Desalination Plant Market: By End-Use, 2022-2032, USD (Million)
- 9.6.1.3. Rest of North America
- 9.6.1.3.1. Solar Water Desalination Plant Market: By Method, 2022-2032, USD (Million)
- 9.6.1.3.2. Solar Water Desalination Plant Market: By Capacity (Cubic Meter/Day), 2022-2032, USD (Million)
- 9.6.1.3.3. Solar Water Desalination Plant Market: By Technology, 2022-2032, USD (Million)
- 9.6.1.3.4. Solar Water Desalination Plant Market: By End-Use, 2022-2032, USD (Million)
- 9.6.1.1. U.S.
- 9.6.1.North America
10. UK and European Union Solar Water Desalination Plant Market, 2022-2032, USD (Million)
- 10.1. Market Overview
- 10.2. Solar Water Desalination Plant Market: By Method, 2022-2032, USD (Million)
- 10.3. Solar Water Desalination Plant Market: By Capacity (Cubic Meter/Day), 2022-2032, USD (Million)
- 10.4. Solar Water Desalination Plant Market: By Technology, 2022-2032, USD (Million)
- 10.5. Solar Water Desalination Plant Market: By End-Use, 2022-2032, USD (Million)
- 10.6.Solar Water Desalination Plant Market: By Region, 2022-2032, USD (Million)
- 10.6.1.UK and European Union
- 10.6.1.1. UK
- 10.6.1.1.1. Solar Water Desalination Plant Market: By Method, 2022-2032, USD (Million)
- 10.6.1.1.2. Solar Water Desalination Plant Market: By Capacity (Cubic Meter/Day), 2022-2032, USD (Million)
- 10.6.1.1.3. Solar Water Desalination Plant Market: By Technology, 2022-2032, USD (Million)
- 10.6.1.1.4. Solar Water Desalination Plant Market: By End-Use, 2022-2032, USD (Million)
- 10.6.1.2. Germany
- 10.6.1.2.1. Solar Water Desalination Plant Market: By Method, 2022-2032, USD (Million)
- 10.6.1.2.2. Solar Water Desalination Plant Market: By Capacity (Cubic Meter/Day), 2022-2032, USD (Million)
- 10.6.1.2.3. Solar Water Desalination Plant Market: By Technology, 2022-2032, USD (Million)
- 10.6.1.2.4. Solar Water Desalination Plant Market: By End-Use, 2022-2032, USD (Million)
- 10.6.1.3. Spain
- 10.6.1.3.1. Solar Water Desalination Plant Market: By Method, 2022-2032, USD (Million)
- 10.6.1.3.2. Solar Water Desalination Plant Market: By Capacity (Cubic Meter/Day), 2022-2032, USD (Million)
- 10.6.1.3.3. Solar Water Desalination Plant Market: By Technology, 2022-2032, USD (Million)
- 10.6.1.3.4. Solar Water Desalination Plant Market: By End-Use, 2022-2032, USD (Million)
- 10.6.1.4. Italy
- 10.6.1.4.1. Solar Water Desalination Plant Market: By Method, 2022-2032, USD (Million)
- 10.6.1.4.2. Solar Water Desalination Plant Market: By Capacity (Cubic Meter/Day), 2022-2032, USD (Million)
- 10.6.1.4.3. Solar Water Desalination Plant Market: By Technology, 2022-2032, USD (Million)
- 10.6.1.4.4. Solar Water Desalination Plant Market: By End-Use, 2022-2032, USD (Million)
- 10.6.1.5. France
- 10.6.1.5.1. Solar Water Desalination Plant Market: By Method, 2022-2032, USD (Million)
- 10.6.1.5.2. Solar Water Desalination Plant Market: By Capacity (Cubic Meter/Day), 2022-2032, USD (Million)
- 10.6.1.5.3. Solar Water Desalination Plant Market: By Technology, 2022-2032, USD (Million)
- 10.6.1.5.4. Solar Water Desalination Plant Market: By End-Use, 2022-2032, USD (Million)
- 10.6.1.6. Rest of Europe
- 10.6.1.6.1. Solar Water Desalination Plant Market: By Method, 2022-2032, USD (Million)
- 10.6.1.6.2. Solar Water Desalination Plant Market: By Capacity (Cubic Meter/Day), 2022-2032, USD (Million)
- 10.6.1.6.3. Solar Water Desalination Plant Market: By Technology, 2022-2032, USD (Million)
- 10.6.1.6.4. Solar Water Desalination Plant Market: By End-Use, 2022-2032, USD (Million)
- 10.6.1.1. UK
- 10.6.1.UK and European Union
11. Asia Pacific Solar Water Desalination Plant Market, 2022-2032, USD (Million)
- 11.1. Market Overview
- 11.2. Solar Water Desalination Plant Market: By Method, 2022-2032, USD (Million)
- 11.3. Solar Water Desalination Plant Market: By Capacity (Cubic Meter/Day), 2022-2032, USD (Million)
- 11.4. Solar Water Desalination Plant Market: By Technology, 2022-2032, USD (Million)
- 11.5. Solar Water Desalination Plant Market: By End-Use, 2022-2032, USD (Million)
- 11.6.Solar Water Desalination Plant Market: By Region, 2022-2032, USD (Million)
- 11.6.1.Asia Pacific
- 11.6.1.1. China
- 11.6.1.1.1. Solar Water Desalination Plant Market: By Method, 2022-2032, USD (Million)
- 11.6.1.1.2. Solar Water Desalination Plant Market: By Capacity (Cubic Meter/Day), 2022-2032, USD (Million)
- 11.6.1.1.3. Solar Water Desalination Plant Market: By Technology, 2022-2032, USD (Million)
- 11.6.1.1.4. Solar Water Desalination Plant Market: By End-Use, 2022-2032, USD (Million)
- 11.6.1.2. Japan
- 11.6.1.2.1. Solar Water Desalination Plant Market: By Method, 2022-2032, USD (Million)
- 11.6.1.2.2. Solar Water Desalination Plant Market: By Capacity (Cubic Meter/Day), 2022-2032, USD (Million)
- 11.6.1.2.3. Solar Water Desalination Plant Market: By Technology, 2022-2032, USD (Million)
- 11.6.1.2.4. Solar Water Desalination Plant Market: By End-Use, 2022-2032, USD (Million)
- 11.6.1.3. India
- 11.6.1.3.1. Solar Water Desalination Plant Market: By Method, 2022-2032, USD (Million)
- 11.6.1.3.2. Solar Water Desalination Plant Market: By Capacity (Cubic Meter/Day), 2022-2032, USD (Million)
- 11.6.1.3.3. Solar Water Desalination Plant Market: By Technology, 2022-2032, USD (Million)
- 11.6.1.3.4. Solar Water Desalination Plant Market: By End-Use, 2022-2032, USD (Million)
- 11.6.1.4. Australia
- 11.6.1.4.1. Solar Water Desalination Plant Market: By Method, 2022-2032, USD (Million)
- 11.6.1.4.2. Solar Water Desalination Plant Market: By Capacity (Cubic Meter/Day), 2022-2032, USD (Million)
- 11.6.1.4.3. Solar Water Desalination Plant Market: By Technology, 2022-2032, USD (Million)
- 11.6.1.4.4. Solar Water Desalination Plant Market: By End-Use, 2022-2032, USD (Million)
- 11.6.1.5. South Korea
- 11.6.1.5.1. Solar Water Desalination Plant Market: By Method, 2022-2032, USD (Million)
- 11.6.1.5.2. Solar Water Desalination Plant Market: By Capacity (Cubic Meter/Day), 2022-2032, USD (Million)
- 11.6.1.5.3. Solar Water Desalination Plant Market: By Technology, 2022-2032, USD (Million)
- 11.6.1.5.4. Solar Water Desalination Plant Market: By End-Use, 2022-2032, USD (Million)
- 11.6.1.6. Rest of Asia Pacific
- 11.6.1.6.1. Solar Water Desalination Plant Market: By Method, 2022-2032, USD (Million)
- 11.6.1.6.2. Solar Water Desalination Plant Market: By Capacity (Cubic Meter/Day), 2022-2032, USD (Million)
- 11.6.1.6.3. Solar Water Desalination Plant Market: By Technology, 2022-2032, USD (Million)
- 11.6.1.6.4. Solar Water Desalination Plant Market: By End-Use, 2022-2032, USD (Million)
- 11.6.1.1. China
- 11.6.1.Asia Pacific
12. Latin America Solar Water Desalination Plant Market, 2022-2032, USD (Million)
- 12.1. Market Overview
- 12.2. Solar Water Desalination Plant Market: By Method, 2022-2032, USD (Million)
- 12.3. Solar Water Desalination Plant Market: By Capacity (Cubic Meter/Day), 2022-2032, USD (Million)
- 12.4. Solar Water Desalination Plant Market: By Technology, 2022-2032, USD (Million)
- 12.5. Solar Water Desalination Plant Market: By End-Use, 2022-2032, USD (Million)
- 12.6.Solar Water Desalination Plant Market: By Region, 2022-2032, USD (Million)
- 12.6.1.Latin America
- 12.6.1.1. Brazil
- 12.6.1.1.1. Solar Water Desalination Plant Market: By Method, 2022-2032, USD (Million)
- 12.6.1.1.2. Solar Water Desalination Plant Market: By Capacity (Cubic Meter/Day), 2022-2032, USD (Million)
- 12.6.1.1.3. Solar Water Desalination Plant Market: By Technology, 2022-2032, USD (Million)
- 12.6.1.1.4. Solar Water Desalination Plant Market: By End-Use, 2022-2032, USD (Million)
- 12.6.1.2. Mexico
- 12.6.1.2.1. Solar Water Desalination Plant Market: By Method, 2022-2032, USD (Million)
- 12.6.1.2.2. Solar Water Desalination Plant Market: By Capacity (Cubic Meter/Day), 2022-2032, USD (Million)
- 12.6.1.2.3. Solar Water Desalination Plant Market: By Technology, 2022-2032, USD (Million)
- 12.6.1.2.4. Solar Water Desalination Plant Market: By End-Use, 2022-2032, USD (Million)
- 12.6.1.3. Rest of Latin America
- 12.6.1.3.1. Solar Water Desalination Plant Market: By Method, 2022-2032, USD (Million)
- 12.6.1.3.2. Solar Water Desalination Plant Market: By Capacity (Cubic Meter/Day), 2022-2032, USD (Million)
- 12.6.1.3.3. Solar Water Desalination Plant Market: By Technology, 2022-2032, USD (Million)
- 12.6.1.3.4. Solar Water Desalination Plant Market: By End-Use, 2022-2032, USD (Million)
- 12.6.1.1. Brazil
- 12.6.1.Latin America
13. Middle East and Africa Solar Water Desalination Plant Market, 2022-2032, USD (Million)
- 13.1. Market Overview
- 13.2. Solar Water Desalination Plant Market: By Method, 2022-2032, USD (Million)
- 13.3. Solar Water Desalination Plant Market: By Capacity (Cubic Meter/Day), 2022-2032, USD (Million)
- 13.4. Solar Water Desalination Plant Market: By Technology, 2022-2032, USD (Million)
- 13.5. Solar Water Desalination Plant Market: By End-Use, 2022-2032, USD (Million)
- 13.6.Solar Water Desalination Plant Market: By Region, 2022-2032, USD (Million)
- 13.6.1.Middle East and Africa
- 13.6.1.1. GCC
- 13.6.1.1.1. Solar Water Desalination Plant Market: By Method, 2022-2032, USD (Million)
- 13.6.1.1.2. Solar Water Desalination Plant Market: By Capacity (Cubic Meter/Day), 2022-2032, USD (Million)
- 13.6.1.1.3. Solar Water Desalination Plant Market: By Technology, 2022-2032, USD (Million)
- 13.6.1.1.4. Solar Water Desalination Plant Market: By End-Use, 2022-2032, USD (Million)
- 13.6.1.2. Africa
- 13.6.1.2.1. Solar Water Desalination Plant Market: By Method, 2022-2032, USD (Million)
- 13.6.1.2.2. Solar Water Desalination Plant Market: By Capacity (Cubic Meter/Day), 2022-2032, USD (Million)
- 13.6.1.2.3. Solar Water Desalination Plant Market: By Technology, 2022-2032, USD (Million)
- 13.6.1.2.4. Solar Water Desalination Plant Market: By End-Use, 2022-2032, USD (Million)
- 13.6.1.3. Rest of Middle East and Africa
- 13.6.1.3.1. Solar Water Desalination Plant Market: By Method, 2022-2032, USD (Million)
- 13.6.1.3.2. Solar Water Desalination Plant Market: By Capacity (Cubic Meter/Day), 2022-2032, USD (Million)
- 13.6.1.3.3. Solar Water Desalination Plant Market: By Technology, 2022-2032, USD (Million)
- 13.6.1.3.4. Solar Water Desalination Plant Market: By End-Use, 2022-2032, USD (Million)
- 13.6.1.1. GCC
- 13.6.1.Middle East and Africa
14. Company Profile
- 14.1. Abengoa Solar
- 14.1.1. Company Overview
- 14.1.2. Financial Performance
- 14.1.3. Product Portfolio
- 14.1.4. Strategic Initiatives
- 14.2. Acciona
- 14.2.1. Company Overview
- 14.2.2. Financial Performance
- 14.2.3. Product Portfolio
- 14.2.4. Strategic Initiatives
- 14.3. IDEXX Laboratories
- 14.3.1. Company Overview
- 14.3.2. Financial Performance
- 14.3.3. Product Portfolio
- 14.3.4. Strategic Initiatives
- 14.4. Elemental Water Makers B.V.
- 14.4.1. Company Overview
- 14.4.2. Financial Performance
- 14.4.3. Product Portfolio
- 14.4.4. Strategic Initiatives
- 14.5. F Cubed Limited
- 14.5.1. Company Overview
- 14.5.2. Financial Performance
- 14.5.3. Product Portfolio
- 14.5.4. Strategic Initiatives
- 14.6. Photon Energy Systems Limited
- 14.6.1. Company Overview
- 14.6.2. Financial Performance
- 14.6.3. Product Portfolio
- 14.6.4. Strategic Initiatives
- 14.7. Sinovoltaics Group
- 14.7.1. Company Overview
- 14.7.2. Financial Performance
- 14.7.3. Product Portfolio
- 14.7.4. Strategic Initiatives
- 14.8. Solar Water Solutions Ltd.
- 14.8.1. Company Overview
- 14.8.2. Financial Performance
- 14.8.3. Product Portfolio
- 14.8.4. Strategic Initiatives
- 14.9. Sterlitech Corporation
- 14.9.1. Company Overview
- 14.9.2. Financial Performance
- 14.9.3. Product Portfolio
- 14.9.4. Strategic Initiatives
- 14.10. Thermax Limited
- 14.10.1. Company Overview
- 14.10.2. Financial Performance
- 14.10.3. Product Portfolio
- 14.10.4. Strategic Initiatives
- 14.11. Trunz Water Systems AG
- 14.11.1. Company Overview
- 14.11.2. Financial Performance
- 14.11.3. Product Portfolio
- 14.11.4. Strategic Initiatives
- 14.12. Waaree Energies Ltd
- 14.12.1. Company Overview
- 14.12.2. Financial Performance
- 14.12.3. Product Portfolio
- 14.12.4. Strategic Initiatives
- 14.13. ANDRITZ
- 14.13.1. Company Overview
- 14.13.2. Financial Performance
- 14.13.3. Product Portfolio
- 14.13.4. Strategic Initiatives
- 14.14. Other Notable Players
- 14.14.1. Company Overview
- 14.14.2. Financial Performance
- 14.14.3. Product Portfolio
- 14.14.4. Strategic Initiatives
