
|
市場調査レポート
商品コード
1801936
コンピュータビジョンシステム市場の機会、成長促進要因、産業動向分析、2025年~2034年の予測Computer Vision Systems Market Opportunity, Growth Drivers, Industry Trend Analysis, and Forecast 2025 - 2034 |
||||||
カスタマイズ可能
|
|||||||
| コンピュータビジョンシステム市場の機会、成長促進要因、産業動向分析、2025年~2034年の予測 |
|
出版日: 2025年08月12日
発行: Global Market Insights Inc.
ページ情報: 英文 300 Pages
納期: 2~3営業日
|

全表示
- 概要
- 目次
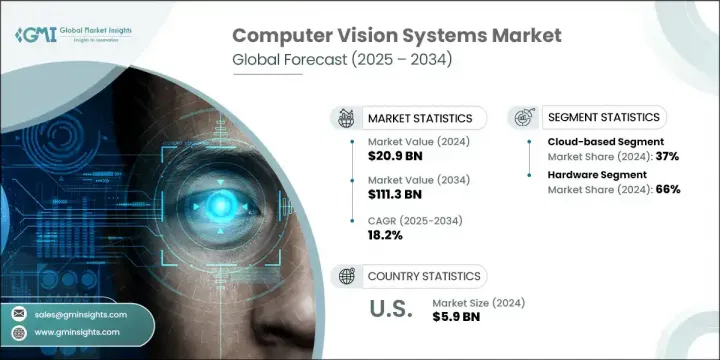
コンピュータビジョンシステムの世界市場規模は2024年に209億米ドルとなり、CAGR 18.2%で成長し、2034年には1,113億米ドルに達すると予測されています。
人工知能、ディープラーニング、センサー技術の急速な進歩が、複数の分野にわたるコンピュータビジョンアプリケーションの拡大に拍車をかけています。製造、自動車、小売などの業界では、自動化の改善、品質管理の強化、安全性の向上を目的としたビジョンシステムの導入が進んでいます。ヘルスケアでは、これらの技術を診断や患者のモニタリングに活用し、セキュリティではリアルタイムの脅威認識が役立っています。
都市インフラ管理や精密農業も、こうしたシステムを活用して業務の合理化を図っています。エネルギーやエレクトロニクス分野では、コンピュータ・ビジョンがモニタリングやデバイスのインタラクティブ性を最適化するのに役立っています。高度なアルゴリズムが画像の鮮明度を高め、低解像度のデータを高解像度の出力に変換することで、自律走行ナビゲーションや医療診断など、高い精度が求められるアプリケーションの可能性が広がっています。
| 市場範囲 | |
|---|---|
| 開始年 | 2024 |
| 予測年 | 2025-2034 |
| 開始金額 | 209億米ドル |
| 予測金額 | 1,113億米ドル |
| CAGR | 18.2% |
インダストリー4.0とスマート環境の台頭により、インテリジェント・ビジュアル・システムの需要が加速し続けています。クラウドコンピューティング、エッジ処理、IoT技術の統合により、リアルタイムのデータ分析と拡張性が企業にとって利用しやすくなりました。機械学習モデルの改善により、これらのシステムの信頼性と性能も向上しています。
クラウドベースのコンピュータビジョンプラットフォームは2024年に37%のシェアを占め、2025年から2034年にかけてCAGR 19%で成長すると予測されています。クラウドベースのコンピュータビジョンプラットフォームの人気は、スケーラビリティ、コスト効率、重いローカルインフラなしで複雑な処理タスクを展開できることに起因しています。企業はクラウドを活用して、ビジュアルデータを大規模に処理し、高度な学習モデルを組み込み、合理的な方法で多様な環境にビジョンツールを展開しています。
ハードウェア分野のシェアは66%で、2034年までのCAGRは18%と予想されています。ビジョンシステムの中核機能に不可欠な高性能カメラ、プロセッサ、メモリ、ストレージ、ディスプレイユニットなどのハードウェアコンポーネントは、産業製造、自動車技術、ヘルスケア診断を含むさまざまな分野向けにカスタマイズされています。人工知能と専用ハードウェアの組み合わせにより、顔認識、自動検査、視覚追跡などのタスクが進展しています。
米国のコンピュータビジョンシステム市場は2024年に90%のシェアを占め、59億米ドルに達しました。同国は、堅牢な技術エコシステムと、いくつかの高成長分野での早期導入の恩恵を受けています。自律型モビリティやスマート生産ラインから医療画像や監視に至るまで、アプリケーションの急増が需要を押し上げています。広範なデジタルトランスフォーメーションと高度な通信インフラが、クラウドとエッジの展開モデルをさらに後押ししています。さらに、小売業界では、リアルタイムの在庫追跡やパーソナライズされたユーザーとのインタラクションにビジョンシステムを活用し、企業全体の自動化イニシアチブを強化しています。
世界のコンピュータビジョンシステム市場を形成する主要プレーヤーには、Google、Intel、Teledyne、NVIDIA、Amazon Web Services、Microsoft、IBMが含まれます。コンピュータビジョンシステム市場の主要プレーヤーは、競争優位性を獲得するために、イノベーション、エコシステム・パートナーシップ、戦略的拡大に注力しています。各社は、特に自律システムやリアルタイムアナリティクスなど、AI主導のビジョン機能を進化させるための研究開発に投資しています。領域固有の専門知識を強化し、製品開発を加速するために戦略的買収が行われています。クラウドインフラの拡大とエッジ対応ビジョンプラットフォームの立ち上げは、様々なスケーラビリティニーズを持つ顧客へのアプローチに役立っています。ヘルスケア、小売業、自動車、製造業などの主要な業種向けのソリューションのカスタマイズも、中核的な戦術の1つです。
目次
第1章 調査手法
第2章 エグゼクティブサマリー
第3章 業界考察
- 市場イントロダクションと進化
- コンピュータビジョン技術の歴史的開発
- 現在の市場情勢
- 将来の見通しと新たな動向
- サプライヤーの情勢
- 原材料および部品サプライヤー
- ハードウェアメーカー
- ソフトウェア開発者
- システムインテグレーター
- エンドユーザー
- 利益率分析
- テクノロジーとイノベーションの情勢
- ディープラーニングとニューラルネットワーク
- 3Dコンピュータービジョン
- コンピュータービジョンのためのエッジAI
- 拡張現実の統合
- ディスプレイ技術におけるコンピュータービジョン
- 視覚アプリケーション向けニューロモルフィックコンピューティング
- 量子コンピューティングがコンピュータービジョンに与える影響
- トレーニング用の合成データ生成
- 業界固有のコンピュータビジョンアプリケーションを表示する
- ディスプレイの自動光学検査(AOI)
- ディスプレイ製造における欠陥検出
- 色調整と品質管理
- スマートディスプレイインタラクションテクノロジー
- マイクロLEDおよびOLED製造のためのコンピュータービジョン
- ディスプレイ製造におけるインラインプロセス監視
- パネル均一性評価システム
- フレキシブルディスプレイの自動目視検査
- エコシステム分析
- ベンダーマトリックス
- 流通チャネル分析
- 戦略的パートナーシップとコラボレーション
- 業界団体およびコンソーシアム
- 調査・学術機関
- 特許分析
- 地域別の特許出願と付与
- ディスプレイ関連のコンピュータビジョンにおける主要特許
- 特許動向分析
- 特許訴訟の情勢
- ディスプレイビジョンシステムにおける新たな特許分野
- 主なニュースと取り組み
- 規制情勢
- データ保護規制
- コンピュータービジョンの業界標準
- 地域の規制状況
- さまざまな業種のコンプライアンス要件
- 将来の規制の動向
- ケーススタディ
- ディスプレイ製造におけるコンピュータービジョン
- エレクトロニクス業界における品質管理アプリケーション
- スマートリテール導入の成功事例
- コンピュータビジョンのヘルスケアアプリケーション
- 車載ディスプレイ統合事例
- 投資と資金調達の情勢
- ベンチャーキャピタル投資
- プライベートエクイティ資金調達
- 企業投資とM&A活動
- 政府と公的資金
- 地域別の投資動向
- コスト構造分析
- ハードウェアコンポーネントのコスト
- ソフトウェア開発およびライセンシング費用
- 実装および統合コスト
- 保守およびサポートコスト
- 総所有コスト分析
- 将来の技術ロードマップ
- 短期的な開発(1~2年)
- 中期的展開(3~5年)
- 長期開発(5年以上)
- テクノロジーの融合の機会
- 業界のベストプラクティス
- 開発および実装方法論
- 品質保証とテストのフレームワーク
- データ管理とプライバシーの実践
- ROI最適化戦略
- 市場参入戦略
- 新製品開発
- 戦略的パートナーシップと提携
- 合併と買収
- 地域拡大戦略
- 持続可能性とESG分析
- コンピュータービジョン技術の環境への影響
- 社会的影響と倫理的配慮
- ガバナンスとコンプライアンスのフレームワーク
- 持続可能な開発開発の整合
- 影響要因
- 促進要因
- 品質検査と自動化の需要の高まり
- AIとML技術の統合の拡大
- スマート製造におけるアプリケーションの増加
- ディープラーニングアルゴリズムの進歩
- エッジコンピューティングデバイスの普及
- 非接触ソリューションの需要増加
- 業界の潜在的リスク&課題
- 高い導入コスト
- 技術的な複雑さと統合の課題
- データのプライバシーとセキュリティに関する懸念
- 業界間の標準化が限られている
- 計算リソース要件
- 市場機会
- エッジコンピューティングとIoTとの統合
- ディスプレイ製造における新たなアプリケーション
- 小売業とヘルスケア分野の成長
- アジア太平洋地域への拡大
- センサー技術の進歩
- 業界横断的なアプリケーションとソリューション
- 市場の課題
- 精度と信頼性の問題
- 熟練労働者の不足
- 規制とコンプライアンスの課題
- パフォーマンスに影響を与える環境要因
- スケーラビリティと展開の課題
- 促進要因
- 成長可能性分析
- ポーターの分析
- PESTEL分析
第4章 競合情勢
- 市場シェア分析
- 主要企業による世界市場シェア
- 地域別市場シェア分布
- ティア分析市場参入企業
- 競合ベンチマーキング
- 製品ポートフォリオ分析
- ビジネス戦略分析
- 研究開発投資の比較
- 技術力評価
- 戦略的取り組み
- 新製品の発売とイノベーション
- 合併と買収
- パートナーシップとコラボレーション
- 拡大戦略
- 競合ダッシュボード
- 市場ポジショニングマトリックス
- パフォーマンス比較マトリックス
- 戦略開発ヒートマップ
- 主要プレーヤーのSWOT分析
- 強みと弱みの分析
- 機会と脅威の分析
- 競合ポジショニングマトリックス
- ベンダー情勢
- 販売代理店およびチャネルパートナーのリスト
- 主な購入基準
- 価格モデルと戦略
- 業界固有の競合分析を表示する
- ディスプレイ製造向けコンピュータービジョンソリューション
- 品質管理システムプロバイダー
- スマートディスプレイ技術の競合
第5章 市場推計・予測:展開モード別、2021年~2034年
- 主要動向
- クラウドベース
- パブリッククラウド
- プライベートクラウド
- ハイブリッドクラウド
- オンプレミス
- エンタープライズ展開
- 産業展開
- エッジベース
- エッジコンピューティングデバイス
- IoT統合システム
- スマートカメラとセンサー
第6章 市場推計・予測:コンポーネント別、2021年~2034年
- 主要動向
- ハードウェア
- カメラと画像センサー
- 産業用カメラ
- スマートカメラ
- 3Dカメラ
- 赤外線カメラ
- プロセッサとコンピューティングユニット
- CPU
- GPU
- FPGA
- ASIC
- エッジAIプロセッサ
- メモリとストレージ
- 表示単位
- その他
- カメラと画像センサー
- ソフトウェア
- コンピュータービジョンプラットフォーム
- ディープラーニングフレームワーク
- 画像処理ソフトウェア
- 分析ソフトウェア
- カスタムアプリケーション
- サービス
- プロフェッショナルサービス
- コンサルティングサービス
- 統合と実装
- トレーニングとサポート
- マネージドサービス
- クラウドベースのサービス
- オンプレミスサービス
- プロフェッショナルサービス
第7章 市場推計・予測:用途別、2021年~2034年
- 主要動向
- 顔認識
- セキュリティと監視
- アクセス制御
- 感情認識
- マーケティングと顧客分析
- 画像分類
- 製品分類
- コンテンツモデレーション
- 医療画像解析
- 産業分類
- 物体検出
- 小売在庫管理
- 製造欠陥検出
- セキュリティアプリケーション
- 自律システム
- オブジェクト追跡
- 監視とセキュリティ
- スポーツ分析
- 小売顧客追跡
- 製造プロセスの監視
- 光学文字認識(OCR)
- 文書のデジタル化
- ナンバープレート認識
- 製造業におけるテキスト認識
- 小売アプリケーション
- 画像セグメンテーション
- 医療画像のセグメンテーション
- 産業用途
- 小売アプリケーション
- 自動運転車
- 自動光学検査
- ディスプレイパネル検査
- PCB検査
- 半導体検査
- 消費者向け電子機器の品質管理
- 3Dビジョンと奥行き検知
- 拡張現実アプリケーション
- ロボット工学と自動化
- スマート製造
- 自動車用途
- ジェスチャー認識
- コンシューマーエレクトロニクス
- 自動車用HMI
- ヘルスケアアプリケーション
- スマートホームコントロール
- その他
第8章 市場推計・予測:業界別、2021年~2034年
- 主要動向
- 製造業
- エレクトロニクスおよび半導体
- ディスプレイ製造
- PCBアセンブリ
- 半導体生産
- コンシューマーエレクトロニクス
- 自動車
- 航空宇宙および防衛
- 医薬品
- 食品と飲料
- その他
- エレクトロニクスおよび半導体
- ヘルスケア
- 医療画像診断
- 患者モニタリング
- 外科手術の補助
- ヘルスケア行政
- その他
- 小売り
- 在庫管理
- 顧客分析
- セルフチェックアウトシステム
- デジタルサイネージとスマートディスプレイ
- その他
- 自動車
- ADAS(先進運転支援システム)(ADAS)
- 自動運転車
- 車内モニタリング
- スマートコックピットディスプレイ
- その他
- セキュリティと監視
- 公共安全
- 小売店のセキュリティ
- 産業セキュリティ
- 住宅セキュリティ
- その他
- 農業
- 作物の監視
- 家畜管理
- 精密農業
- その他
- スマートシティ
- 交通管理
- 公共安全
- インフラ監視
- エネルギー管理
- その他
- コンシューマーエレクトロニクス
- スマートフォンとタブレット
- スマートテレビとディスプレイ
- AR/VRデバイス
- スマートホームデバイス
- その他
- エネルギーと公益事業
- 電力網監視
- 再生可能エネルギーシステム
- インフラ検査
- その他
- その他
第9章 市場推計・予測:地域別、2021年~2034年
- 主要動向
- 北米
- 米国
- カナダ
- 欧州
- 英国
- ドイツ
- フランス
- イタリア
- スペイン
- ロシア
- 北欧諸国
- アジア太平洋地域
- 中国
- インド
- 日本
- 韓国
- オーストラリア・ニュージーランド
- 東南アジア
- ラテンアメリカ
- ブラジル
- メキシコ
- アルゼンチン
- 中東・アフリカ
- 南アフリカ
- サウジアラビア
- アラブ首長国連邦
第10章 企業プロファイル
- 世界のテクノロジーリーダー
- NVIDIA
- Intel
- Microsoft
- IBM
- Qualcomm
- Sony
- 産業ビジョンおよびオートメーション専門企業
- Cognex
- Keyence
- Basler
- Omron
- Teledyne
- AIおよびビジョンソフトウェアイノベーター
- Clarifai
- Matterport
- Visionatics
- SmartCow
- ZH-AOI
- 半導体およびコンポーネントサプライヤー
- MediaTek
- Himax
- Renesas Electronics
- AUO Display Plus(ADP)
- エッジコンピューティングおよびエンベデッドビジョン企業
- Aetina
- Advantech
- AAEON
- Neousys
The Global Computer Vision Systems Market was valued at USD 20.9 billion in 2024 and is estimated to grow at a CAGR of 18.2% to reach USD 111.3 billion by 2034. Rapid advances in artificial intelligence, deep learning, and sensor technologies are fueling the expansion of computer vision applications across multiple sectors. Industries such as manufacturing, automotive, and retail are seeing strong adoption of vision systems to improve automation, enhance quality control, and boost safety. Healthcare is utilizing these technologies for diagnostics and patient monitoring, while security is benefiting from real-time threat recognition.
Urban infrastructure management and precision agriculture are also tapping into these systems to streamline operations. In energy and electronics, computer vision helps optimize monitoring and device interactivity. Advanced algorithms now enhance image clarity, transforming low-resolution data into high-resolution outputs, which opens up possibilities for applications that demand high precision, including autonomous navigation and medical diagnostics.
| Market Scope | |
|---|---|
| Start Year | 2024 |
| Forecast Year | 2025-2034 |
| Start Value | $20.9 Billion |
| Forecast Value | $111.3 Billion |
| CAGR | 18.2% |
The rise of Industry 4.0 and smart environments continues to accelerate demand for intelligent visual systems. With the integration of cloud computing, edge processing, and IoT technologies, real-time data analysis and scalability have become accessible to enterprises. Improved machine learning models are also increasing the reliability and performance of these systems.
The cloud-based computer vision platforms held 37% share in 2024 and is anticipated to grow at a CAGR of 19% between 2025 and 2034. Their popularity stems from scalability, cost efficiency, and the ability to deploy complex processing tasks without heavy local infrastructure. Businesses are leveraging the cloud to process visual data at scale, incorporate advanced learning models, and deploy vision tools across diverse environments in a streamlined way.
The hardware segment held 66% share and is expected to grow at a CAGR of 18% through 2034. Essential to the core function of vision systems, hardware components like high-performance cameras, processors, memory, storage, and display units are being customized for various sectors including industrial manufacturing, automotive technologies, and healthcare diagnostics. The combination of artificial intelligence with dedicated hardware is advancing tasks such as facial recognition, automated inspection, and visual tracking.
US Computer Vision Systems Market held 90% share in 2024, contributing USD 5.9 billion. The country benefits from a robust tech ecosystem and early adoption across several high-growth sectors. A surge in applications ranging from autonomous mobility and smart production lines to medical imaging and surveillance has boosted demand. Widespread digital transformation and sophisticated telecom infrastructure further support cloud and edge deployment models. Additionally, the retail space is leveraging vision systems for real-time inventory tracking and personalized user interactions, intensifying automation initiatives across businesses.
The leading players shaping the Global Computer Vision Systems Market include Google, Intel, Teledyne, NVIDIA, Amazon Web Services, Microsoft, and IBM. Major players in the computer vision systems market are focusing on innovation, ecosystem partnerships, and strategic expansion to gain a competitive edge. Companies are channeling investment into research and development to advance AI-driven vision capabilities, particularly for autonomous systems and real-time analytics. Strategic acquisitions are being made to strengthen domain-specific expertise and accelerate product development. Expanding cloud infrastructure and launching edge-compatible vision platforms are helping players reach clients with varying scalability needs. Customization of solutions for key verticals like healthcare, retail, automotive, and manufacturing is another core tactic.
Table of Contents
Chapter 1 Methodology
- 1.1 Market scope and definition
- 1.2 Research design
- 1.2.1 Research approach
- 1.2.2 Data collection methods
- 1.3 Data mining sources
- 1.3.1 Global
- 1.3.2 Regional/Country
- 1.4 Base estimates and calculations
- 1.4.1 Base year calculation
- 1.4.2 Key trends for market estimation
- 1.5 Primary research and validation
- 1.5.1 Primary sources
- 1.6 Forecast model
- 1.7 Research assumptions and limitations
Chapter 2 Executive Summary
- 2.1 Industry 360° synopsis, 2021 - 2034
- 2.2 Key market trends
- 2.2.1 Regional
- 2.2.2 Deployment Mode
- 2.2.3 Component
- 2.2.4 Application
- 2.2.5 Industry vertical
- 2.3 TAM Analysis, 2025-2034
- 2.4 CXO perspectives: Strategic imperatives
- 2.4.1 Executive decision points
- 2.4.2 Critical success factors
- 2.5 Future outlook and strategic recommendations
Chapter 3 Industry Insights
- 3.1 Market introduction and evolution
- 3.1.1 Historical development of computer vision technology
- 3.1.2 Current market landscape
- 3.1.3 Future outlook and emerging trends
- 3.2 Supplier landscape
- 3.2.1 Raw material and component suppliers
- 3.2.2 Hardware manufacturers
- 3.2.3 Software developers
- 3.2.4 System integrators
- 3.2.5 End users
- 3.3 Profit margin analysis
- 3.4 Technology & innovation landscape
- 3.4.1 Deep learning and neural networks
- 3.4.2 3D computer vision
- 3.4.3 Edge AI for computer vision
- 3.4.4 Augmented reality integration
- 3.4.5 Computer vision in display technology
- 3.4.6 Neuromorphic computing for vision applications
- 3.4.7 Quantum computing implications for computer vision
- 3.4.8 Synthetic data generation for training
- 3.5 Display industry-specific computer vision applications
- 3.5.1 Automated optical inspection (AOI) for displays
- 3.5.2 Defect detection in display manufacturing
- 3.5.3 Color calibration and quality control
- 3.5.4 Smart display interaction technologies
- 3.5.5 Computer vision for micro LED and OLED manufacturing
- 3.5.6 In-line process monitoring for display production
- 3.5.7 Panel uniformity assessment systems
- 3.5.8 Automated visual inspection for flexible displays
- 3.6 Industry ecosystem analysis
- 3.6.1 Vendor matrix
- 3.6.2 Distribution channel analysis
- 3.6.3 Strategic partnerships and collaborations
- 3.6.4 Industry associations and consortiums
- 3.6.5 Research and academic institutions
- 3.7 Patent analysis
- 3.7.1 Patent applications and grants by region
- 3.7.2 Key patents in display-related computer vision
- 3.7.3 Patent trend analysis
- 3.7.4 Patent litigation landscape
- 3.7.5 Emerging patent areas in display vision systems
- 3.8 Key news & initiatives
- 3.9 Regulatory landscape
- 3.9.1 Data protection regulations
- 3.9.2 Industry standards for computer vision
- 3.9.3 Regional regulatory landscape
- 3.9.4 Compliance requirements for different verticals
- 3.9.5 Future regulatory developments
- 3.10 Case studies
- 3.10.1 Computer vision in display manufacturing
- 3.10.2 Quality control applications in electronics industry
- 3.10.3 Smart retail implementation success stories
- 3.10.4 Healthcare applications of computer vision
- 3.10.5 Automotive display integration cases
- 3.11 Investment and funding landscape
- 3.11.1 Venture capital investments
- 3.11.2 Private equity funding
- 3.11.3 Corporate investments and M&A activity
- 3.11.4 Government and public funding
- 3.11.5 Investment trends by region
- 3.12 Cost structure analysis
- 3.12.1 Hardware component costs
- 3.12.2 Software development and licensing costs
- 3.12.3 Implementation and integration costs
- 3.12.4 Maintenance and support costs
- 3.12.5 Total cost of ownership analysis
- 3.13 Future technology roadmap
- 3.13.1 Short-term developments (1-2 Years)
- 3.13.2 Medium-term developments (3-5 Years)
- 3.13.3 Long-term developments (5+ Years)
- 3.13.4 Technology convergence opportunities
- 3.14 Industry best practices
- 3.14.1 Development and implementation methodologies
- 3.14.2 Quality assurance and testing frameworks
- 3.14.3 Data management and privacy practices
- 3.14.4 ROI optimization strategies
- 3.15 Market entry strategies
- 3.15.1 New product development
- 3.15.2 Strategic partnerships and alliances
- 3.15.3 Mergers and acquisitions
- 3.15.4 Regional expansion strategies
- 3.16 Sustainability and ESG analysis
- 3.16.1 Environmental impact of computer vision technologies
- 3.16.2 Social implications and ethical considerations
- 3.16.3 Governance and compliance frameworks
- 3.16.4 Sustainable development goals alignment
- 3.17 Impact forces
- 3.17.1 Growth drivers
- 3.17.1.1 Rising demand for quality inspection and automation
- 3.17.1.2 Growing integration of AI and ML technologies
- 3.17.1.3 Increasing applications in smart manufacturing
- 3.17.1.4 Advancements in deep learning algorithms
- 3.17.1.5 Proliferation of edge computing devices
- 3.17.1.6 Growing demand for contactless solutions
- 3.17.2 Industry pitfalls & challenges
- 3.17.2.1 High implementation costs
- 3.17.2.2 Technical complexity and integration challenges
- 3.17.2.3 Data privacy and security concerns
- 3.17.2.4 Limited standardization across industries
- 3.17.2.5 Computational resource requirements
- 3.17.3 Market opportunities
- 3.17.3.1 Integration with edge computing and IoT
- 3.17.3.2 Emerging applications in display manufacturing
- 3.17.3.3 Growth in retail and healthcare sectors
- 3.17.3.4 Expansion in APAC region
- 3.17.3.5 Advancements in sensor technologies
- 3.17.3.6 Cross-industry applications and solutions
- 3.17.4 Market Challenges
- 3.17.4.1 Accuracy and reliability issues
- 3.17.4.2 Skilled workforce shortage
- 3.17.4.3 Regulatory and compliance challenges
- 3.17.4.4 Environmental factors affecting performance
- 3.17.4.5 Scalability and deployment challenges
- 3.17.1 Growth drivers
- 3.18 Growth potential analysis
- 3.19 Porter’s analysis
- 3.20 PESTEL analysis
Chapter 4 Competitive Landscape, 2024
- 4.1 Market share analysis
- 4.1.1 Global market share by key players
- 4.1.2 Regional market share distribution
- 4.1.3 Tier analysis of market players
- 4.2 Competitive benchmarking
- 4.2.1 Product portfolio analysis
- 4.2.2 Business strategy analysis
- 4.2.3 R&D investment comparison
- 4.2.4 Technological capabilities assessment
- 4.3 Strategic initiatives
- 4.3.1 New product launches and innovations
- 4.3.2 Mergers and acquisitions
- 4.3.3 Partnerships and collaborations
- 4.3.4 Expansion strategies
- 4.4 Competitive dashboard
- 4.4.1 Market positioning matrix
- 4.4.2 Performance comparison matrix
- 4.4.3 Strategic developments heatmap
- 4.5 SWOT analysis of key players
- 4.5.1 Strengths and weaknesses analysis
- 4.5.2 Opportunities and threats analysis
- 4.6 Competitive positioning matrix
- 4.6.1 Leaders
- 4.6.2 Challengers
- 4.6.3 Innovators
- 4.6.4 Emerging players
- 4.7 Vendor landscape
- 4.7.1 List of distributors and channel partners
- 4.7.2 Key buying criteria
- 4.7.3 Pricing models and strategies
- 4.8 Display industry-specific competitive analysis
- 4.8.1 Computer vision solutions for display manufacturing
- 4.8.2 Quality control systems providers
- 4.8.3 Smart display technology competitors
Chapter 5 Market Estimates & Forecast, By Deployment Mode, 2021-2034 ($Bn)
- 5.1 Key trends
- 5.2 Cloud-based
- 5.2.1 Public cloud
- 5.2.2 Private cloud
- 5.2.3 Hybrid cloud
- 5.3 On-premises
- 5.3.1 Enterprise deployment
- 5.3.2 Industrial deployment
- 5.4 Edge-based
- 5.4.1 Edge computing devices
- 5.4.2 IoT-integrated systems
- 5.4.3 Smart cameras and sensors
Chapter 6 Market Estimates & Forecast, By Component, 2021-2034 ($Bn)
- 6.1 Key trends
- 6.2 Hardware
- 6.2.1 Cameras And Image Sensors
- 6.2.1.1 Industrial Cameras
- 6.2.1.2 Smart Cameras
- 6.2.1.3 3D Cameras
- 6.2.1.4 Infrared Cameras
- 6.2.2 Processors And Computing Units
- 6.2.2.1 CPUs
- 6.2.2.2 GPUs
- 6.2.2.3 FPGAs
- 6.2.2.4 ASICs
- 6.2.2.5 Edge AI Processors
- 6.2.3 Memory And Storage
- 6.2.4 Display Units
- 6.2.5 Others
- 6.2.1 Cameras And Image Sensors
- 6.3 Software
- 6.3.1 Computer Vision Platforms
- 6.3.2 Deep Learning Frameworks
- 6.3.3 Image Processing Software
- 6.3.4 Analytics Software
- 6.3.5 Custom Applications
- 6.4 Services
- 6.4.1 Professional Services
- 6.4.1.1 Consulting Services
- 6.4.1.2 Integration And Implementation
- 6.4.1.3 Training And Support
- 6.4.2 Managed services
- 6.4.2.1 Cloud-based services
- 6.4.2.2 On-premise services
- 6.4.1 Professional Services
Chapter 7 Market Estimates & Forecast, By Application, 2021-2034 ($Bn)
- 7.1 Key trends
- 7.2 Facial recognition
- 7.2.1 Security and surveillance
- 7.2.2 Access control
- 7.2.3 Emotion recognition
- 7.2.4 Marketing and customer analytics
- 7.3 Image classification
- 7.3.1 Product categorization
- 7.3.2 Content moderation
- 7.3.3 Medical image analysis
- 7.3.4 Industrial classification
- 7.4 Object detection
- 7.4.1 Retail Inventory management
- 7.4.2 Manufacturing defect detection
- 7.4.3 Security applications
- 7.4.4 Autonomous systems
- 7.5 Object tracking
- 7.5.1 Surveillance and security
- 7.5.2 Sports analytics
- 7.5.3 Retail customer tracking
- 7.5.4 Manufacturing process monitoring
- 7.6 Optical Character Recognition (OCR)
- 7.6.1 Document digitization
- 7.6.2 License plate recognition
- 7.6.3 Text recognition in manufacturing
- 7.6.4 Retail applications
- 7.7 Image Segmentation
- 7.7.1 Medical image segmentation
- 7.7.2 Industrial applications
- 7.7.3 Retail applications
- 7.7.4 Autonomous vehicles
- 7.8 Automated optical inspection
- 7.8.1 Display panel inspection
- 7.8.2 PCB inspection
- 7.8.3 Semiconductor inspection
- 7.8.4 Consumer electronics quality control
- 7.9 3D vision and depth sensing
- 7.9.1 Augmented reality applications
- 7.9.2 Robotics and automation
- 7.9.3 Smart manufacturing
- 7.9.4 Automotive applications
- 7.10 Gesture recognition
- 7.10.1 Consumer electronics
- 7.10.2 Automotive HMI
- 7.10.3 Healthcare applications
- 7.10.4 Smart home controls
- 7.11 Others
Chapter 8 Market Estimates & Forecast, By Industry Vertical, 2021-2034 ($Bn)
- 8.1 Key trends
- 8.2 Manufacturing
- 8.2.1 Electronics and semiconductor
- 8.2.1.1 Display manufacturing
- 8.2.1.2 PCB assembly
- 8.2.1.3 Semiconductor production
- 8.2.1.4 Consumer electronics
- 8.2.2 Automotive
- 8.2.3 Aerospace and defense
- 8.2.4 Pharmaceuticals
- 8.2.5 Food and beverage
- 8.2.6 Others
- 8.2.1 Electronics and semiconductor
- 8.3 Healthcare
- 8.3.1 Medical imaging and diagnostics
- 8.3.2 Patient monitoring
- 8.3.3 Surgical assistance
- 8.3.4 Healthcare administration
- 8.3.5 Others
- 8.4 Retail
- 8.4.1 Inventory management
- 8.4.2 Customer analytics
- 8.4.3 Self-checkout systems
- 8.4.4 Digital signage and smart displays
- 8.4.5 Others
- 8.5 Automotive
- 8.5.1 Advanced Driver Assistance Systems (ADAS)
- 8.5.2 Autonomous vehicles
- 8.5.3 In-cabin monitoring
- 8.5.4 Smart cockpit displays
- 8.5.5 Others
- 8.6 Security and surveillance
- 8.6.1 Public safety
- 8.6.2 Retail security
- 8.6.3 Industrial security
- 8.6.4 Residential security
- 8.6.5 Others
- 8.7 Agriculture
- 8.7.1 Crop monitoring
- 8.7.2 Livestock management
- 8.7.3 Precision farming
- 8.7.4 Others
- 8.8 Smart cities
- 8.8.1 Traffic management
- 8.8.2 Public safety
- 8.8.3 Infrastructure monitoring
- 8.8.4 Energy management
- 8.8.5 Others
- 8.9 Consumer electronics
- 8.9.1 Smartphones and tablets
- 8.9.2 Smart TVs and displays
- 8.9.3 AR/VR devices
- 8.9.4 Smart home devices
- 8.9.5 Others
- 8.10 Energy and utilities
- 8.10.1 Power grid monitoring
- 8.10.2 Renewable energy systems
- 8.10.3 Infrastructure inspection
- 8.10.4 Others
- 8.11 Others
Chapter 9 Market Estimates & Forecast, By Region, 2021-2034 ($Bn)
- 9.1 Key trends
- 9.2 North America
- 9.2.1 U.S.
- 9.2.2 Canada
- 9.3 Europe
- 9.3.1 UK
- 9.3.2 Germany
- 9.3.3 France
- 9.3.4 Italy
- 9.3.5 Spain
- 9.3.6 Russia
- 9.3.7 Nordics
- 9.4 Asia Pacific
- 9.4.1 China
- 9.4.2 India
- 9.4.3 Japan
- 9.4.4 South Korea
- 9.4.5 ANZ
- 9.4.6 Southeast Asia
- 9.5 Latin America
- 9.5.1 Brazil
- 9.5.2 Mexico
- 9.5.3 Argentina
- 9.6 MEA
- 9.6.1 South Africa
- 9.6.2 Saudi Arabia
- 9.6.3 UAE
Chapter 10 Company Profiles
- 10.1 Global Technology Leaders
- 10.1.1 NVIDIA
- 10.1.2 Intel
- 10.1.3 Microsoft
- 10.1.4 IBM
- 10.1.5 Google
- 10.1.6 Qualcomm
- 10.1.7 Sony
- 10.2 Industrial Vision and Automation Specialists
- 10.2.1 Cognex
- 10.2.2 Keyence
- 10.2.3 Basler
- 10.2.4 Omron
- 10.2.5 Teledyne
- 10.3 AI and Vision Software Innovators
- 10.3.1 Clarifai
- 10.3.2 Matterport
- 10.3.3 Visionatics
- 10.3.4 SmartCow
- 10.3.5 ZH-AOI
- 10.4 Semiconductor and Component Suppliers
- 10.4.1 MediaTek
- 10.4.2 Himax
- 10.4.3 Renesas Electronics
- 10.4.4 AUO Display Plus (ADP)
- 10.5 Edge Computing and Embedded Vision Companies
- 10.5.1 Aetina
- 10.5.2 Advantech
- 10.5.3 AAEON
- 10.5.4 Neousys

