|
|
市場調査レポート
商品コード
1616676
GPUaaS(GPU-as-a-Service)機会と促進要因、業界動向分析、2024年~2032年予測GPU as a Service (GPUaaS) Market Opportunity, Growth Drivers, Industry Trend Analysis, and Forecast 2024 - 2032 |
||||||
カスタマイズ可能
|
|||||||
| GPUaaS(GPU-as-a-Service)機会と促進要因、業界動向分析、2024年~2032年予測 |
|
出版日: 2024年09月10日
発行: Global Market Insights Inc.
ページ情報: 英文 200 Pages
納期: 2~3営業日
|
全表示
- 概要
- 目次
世界のGPUaaS(GPU-as-a-Service)市場は、2023年に64億米ドルと評価され、2024~2032年にかけてCAGR 30%で成長すると予測されています。
この急成長の主要要因は、スケーラビリティ、費用対効果、効率性で有名なクラウドコンピューティングサービスの採用が増加していることです。欧州委員会のデータによると、2023年にはEU企業の45%以上が、電子メールホスティング、ファイルストレージ、オフィスソフトウェアなどの業務にクラウドコンピューティングサービスを利用しています。この産業では、科学シミュレーション、天気予報、金融モデリングなど、ハイパフォーマンスコンピューティング(HPC)タスクへの傾斜がますます強まっています。HPCアプリケーションでは、シミュレーションやモデリングに大きな計算能力が求められます。
GPUは、膨大なデータセットや複雑な計算の処理を高速化し、素粒子の衝突などのより迅速で微妙なシミュレーションを容易にします。気候科学者は、天気予報や気候モデリングを強化するためにGPUaaSを利用しています。GPUの並列処理能力を活用することで、研究者は膨大な気象データをふるいにかけることができ、より正確な気象予測や気候変動モデルにつながります。このような進歩は、気候変動がもたらす課題を理解し、対処する上で重要な役割を果たします。
| 市場範囲 | |
|---|---|
| 開始年 | 2023年 |
| 予測年 | 2024~2032年 |
| 開始価格 | 64億米ドル |
| 予想価格 | 739億米ドル |
| CAGR | 30% |
GPUaaS市場のエンドユーザーセグメントには、ゲーム、設計・製造、自動車、不動産、医療などが含まれます。2023年には、ゲームセグメントが市場の約31%を占める。今日のゲームは、最高レベルのグラフィックス、リアルタイムのレンダリング、没入感のある設定を要求しており、そのすべてが堅牢なGPUに依存しています。GPUaaSを利用することで、ゲーム会社はレイトレイシングや4K解像度のような優れたビジュアル体験を参入企業に提供することができ、高価なゲーミングリグの必要性を回避することができます。
北米は、2023年にGPUaaS市場シェアの約37%を獲得し、2032年まで顕著な成長を遂げる見込みです。この地域の拡大は、AWS、Microsoft Corporation、Google LLCなどの大手クラウドサービスプロバイダーがGPUaaSの成長を先導していることが主要要因です。
目次
第1章 調査手法と調査範囲
第2章 エグゼクティブサマリー
第3章 産業洞察
- エコシステム分析
- サプライヤーの状況
- 原料サプライヤー
- 相手先商標製品メーカー(OEM)
- 技術プロバイダー
- システムインテグレーター
- サービスプロバイダー
- エンドユーザー
- 利益率分析
- 技術とイノベーションの展望
- ケーススタディ
- 特許分析
- 主要ニュースとイニシアチブ
- 提携/協力
- 合併/買収
- 投資
- 製品上市とイノベーション
- 規制状況
- 影響要因
- 促進要因
- AIと機械学習ワークロードに対する需要の高まり
- クラウドゲーミングの人気上昇
- 産業全体におけるデータ分析とリアルタイム処理の利用の増加
- 従量課金モデルによるコスト削減と運用の柔軟性
- 産業の潜在的リスク・課題
- データのプライバシーとセキュリティに関する懸念
- カスタマイズとコントロールの制限
- 促進要因
- 成長可能性分析
- ポーター分析
- PESTEL分析
第4章 競合情勢
- イントロダクション
- 企業シェア分析
- 競合のポジショニングマトリックス
- 戦略展望マトリックス
第5章 市場推定・予測:コンポーネント別、2021~2032年
- 主要動向
- ソフトウェア
- CAD/CAM
- シミュレーション
- イメージング
- デジタルビデオ
- モデリングとアニメーション
- その他
- サービス
- マネージドサービス
- アップデートとメンテナンス
- コンプライアンスとセキュリティ
- その他
第6章 市場推定・予測:デリバリーモデル別、2021~2032年
- 主要動向
- パブリッククラウド
- プライベートクラウド
- ハイブリッドクラウド
第7章 市場推定・予測:サービスモデル別、2021~2032年
- 主要動向
- SaaS
- PaaS
- IaaS
第8章 市場推定・予測:エンドユーザー別、2021~2032年
- 主要動向
- ゲーム
- 設計・製造
- 自動車
- 不動産
- 医療
- その他
第9章 市場推定・予測:用途別、2021~2032年
- 主要動向
- AIとML
- グラフィックスレンダリング
- データ分析
- 科学シミュレーション
- メディカルイメージング
- 暗号通貨マイニング
- その他
第10章 市場推定・予測:地域別、2021~2032年
- 主要動向
- 北米
- 米国
- カナダ
- 欧州
- 英国
- ドイツ
- フランス
- イタリア
- スペイン
- ロシア
- 北欧
- その他の欧州
- アジア太平洋
- 中国
- インド
- 日本
- 韓国
- ニュージーランド
- 東南アジア
- その他のアジア太平洋
- ラテンアメリカ
- ブラジル
- メキシコ
- アルゼンチン
- その他のラテンアメリカ
- 中東・アフリカ
- 南アフリカ
- アラブ首長国連邦
- サウジアラビア
- その他の中東・アフリカ
第11章 企業プロファイル
- Advanced Micro Devices, Inc
- Alibaba Cloud
- Amazon Web Services Inc.
- Autodesk Inc.
- Dassault Systems, Inc.
- dinCloud
- FluidStack, Ltd.
- Google LLC
- IBM Corporation
- Intel Corporation
- Lamba, Inc.
- Linode LLC
- Microsoft Corporation
- Nimbix, Inc.
- NVIDIA Corporation
- OVH Cloud
- Penguin Computing Inc.
- Qualcomm Technologies, Inc.
- ScaleMatrix Holdings, Inc.
- VULTR(The Constant Company LLC)
The Global GPU As A Service (GPUaaS) Market was valued at USD 6.4 billion in 2023 and is projected to grow at a CAGR of 30% from 2024 to 2032. This surge is primarily fueled by the rising adoption of cloud computing services, celebrated for their scalability, cost-effectiveness, and efficiency. Data from the European Commission reveals that in 2023, over 45% of EU businesses turned to cloud computing services for tasks like email hosting, file storage, and office software. The industry is increasingly leaning towards high-performance computing (HPC) tasks, encompassing scientific simulations, weather forecasting, and financial modeling. HPC applications demand significant computational power for their simulations and modeling.
GPUs expedite the processing of vast datasets and intricate calculations to facilitate quicker and more nuanced simulations, such as particle collisions. Climate scientists are turning to GPUaaS for enhanced weather forecasting and climate modeling. By harnessing the parallel processing prowess of GPUs, researchers can sift through extensive meteorological data, leading to more precise weather predictions and climate change models. Such advancements play a crucial role in comprehending and addressing the challenges posed by climate change.
The overall industry is segmented into component, service model, delivery model, end-user, application, and region. The market, categorized by service models, includes SaaS, PaaS, and IaaS. In 2023, the SaaS segment dominated with over 55% market share and is on track to surpass USD 35 billion by 2032. The SaaS model alleviates concerns of hardware maintenance and updates, as service providers oversee software management, patching, and scaling. This convenience appeals to companies eager to lighten operational loads while tapping into high-performance computing.
| Market Scope | |
|---|---|
| Start Year | 2023 |
| Forecast Year | 2024-2032 |
| Start Value | $6.4 Billion |
| Forecast Value | $73.9 Billion |
| CAGR | 30% |
End-user segmentation of the GPU as a service market encompasses gaming, design & manufacturing, automotive, real estate, healthcare, and more. In 2023, the gaming segment accounted for approximately 31% of the market. Today's games demand top-tier graphics, real-time rendering, and immersive settings, all reliant on robust GPUs. With GPUaaS, gaming firms can offer players superior visual experiences, like ray tracing and 4K resolution, sidestepping the need for costly gaming rigs.
North America captured roughly 37% of the GPU as a service market share in 2023 and is poised for notable growth through 2032. This regional expansion is largely due to the dominance of major cloud service providers, including AWS, Microsoft Corporation, and Google LLC, who are spearheading the growth of GPUaaS offerings.
Table of Contents
Chapter 1 Methodology & Scope
- 1.1 Research design
- 1.1.1 Research approach
- 1.1.2 Data collection methods
- 1.2 Base estimates and calculations
- 1.2.1 Base year calculation
- 1.2.2 Key trends for market estimates
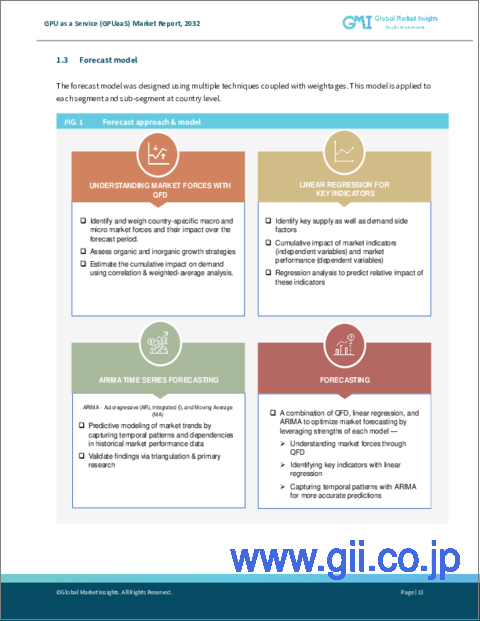
- 1.3 Forecast model
- 1.4 Primary research & validation
- 1.4.1 Primary sources
- 1.4.2 Data mining sources
- 1.5 Market definitions
Chapter 2 Executive Summary
- 2.1 Market 360° synopsis, 2021 - 2032
Chapter 3 Industry Insights
- 3.1 Industry ecosystem analysis
- 3.2 Supplier landscape
- 3.2.1 Raw material suppliers
- 3.2.2 Original equipment manufacturer (OEMs)
- 3.2.3 Technology providers
- 3.2.4 System integrators
- 3.2.5 Service providers
- 3.2.6 End user
- 3.3 Profit margin analysis
- 3.4 Technology & innovation landscape
- 3.5 Case studies
- 3.6 Patent analysis
- 3.7 Key news and initiatives
- 3.7.1 Partnership/Collaboration
- 3.7.2 Merger/Acquisition
- 3.7.3 Investment
- 3.7.4 Product launch & innovation
- 3.8 Regulatory landscape
- 3.9 Impact forces
- 3.9.1 Growth drivers
- 3.9.1.1 Growing demand for AI and machine learning workloads
- 3.9.1.2 Rising popularity of cloud gaming
- 3.9.1.3 Increased use of data analytics and real-time processing across industries
- 3.9.1.4 Cost savings and operational flexibility from the pay-as-you-go model
- 3.9.2 Industry pitfalls & challenges
- 3.9.2.1 Data privacy and security concerns
- 3.9.2.2 Limited customization and control
- 3.9.1 Growth drivers
- 3.10 Growth potential analysis
- 3.11 Porter's analysis
- 3.12 PESTEL analysis
Chapter 4 Competitive Landscape, 2023
- 4.1 Introduction
- 4.2 Company market share analysis
- 4.3 Competitive positioning matrix
- 4.4 Strategic outlook matrix
Chapter 5 Market Estimates & Forecast, By Component, 2021-2032 ($Bn)
- 5.1 Key trends
- 5.2 Software
- 5.2.1 CAD/CAM
- 5.2.2 Simulation
- 5.2.3 Imaging
- 5.2.4 Digital video
- 5.2.5 Modeling and animation
- 5.2.6 Others
- 5.3 Service
- 5.3.1 Managed services
- 5.3.2 Updates and maintenance
- 5.3.3 Compliance and security
- 5.3.4 Others
Chapter 6 Market Estimates & Forecast, By Delivery Model, 2021-2032 ($Bn)
- 6.1 Key trends
- 6.2 Public cloud
- 6.3 Private cloud
- 6.4 Hybrid cloud
Chapter 7 Market Estimates & Forecast, By Service Model, 2021-2032 ($Bn)
- 7.1 Key trends
- 7.2 SaaS
- 7.3 PaaS
- 7.4 IaaS
Chapter 8 Market Estimates & Forecast, By End-User, 2021-2032 ($Bn)
- 8.1 Key trends
- 8.2 Gaming
- 8.3 Design and manufacturing
- 8.4 Automotive
- 8.5 Real estate
- 8.6 Healthcare
- 8.7 Others
Chapter 9 Market Estimates & Forecast, By Application, 2021-2032 ($Bn)
- 9.1 Key trends
- 9.2 AI & ML
- 9.3 Graphics rendering
- 9.4 Data analytics
- 9.5 Scientific simulations
- 9.6 Medical imaging
- 9.7 Cryptocurrency mining
- 9.8 Others
Chapter 10 Market Estimates & Forecast, By Region, 2021-2032 ($Mn)
- 10.1 Key trends
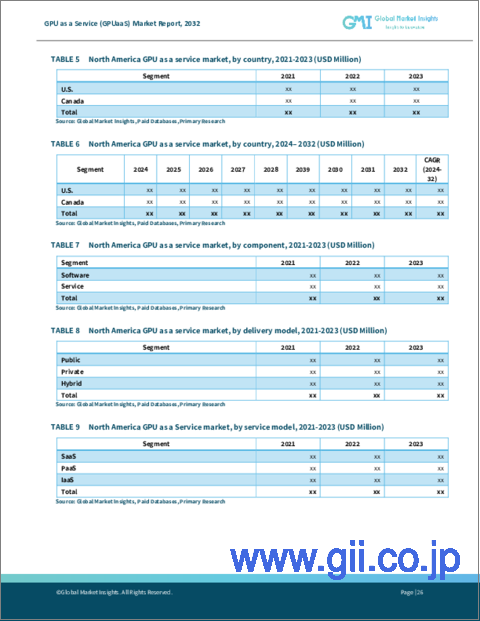
- 10.2 North America
- 10.2.1 U.S.
- 10.2.2 Canada
- 10.3 Europe
- 10.3.1 UK
- 10.3.2 Germany
- 10.3.3 France
- 10.3.4 Italy
- 10.3.5 Spain
- 10.3.6 Russia
- 10.3.7 Nordics
- 10.3.8 Rest of Europe
- 10.4 Asia Pacific
- 10.4.1 China
- 10.4.2 India
- 10.4.3 Japan
- 10.4.4 South Korea
- 10.4.5 ANZ
- 10.4.6 Southeast Asia
- 10.4.7 Rest of Asia Pacific
- 10.5 Latin America
- 10.5.1 Brazil
- 10.5.2 Mexico
- 10.5.3 Argentina
- 10.5.4 Rest of Latin America
- 10.6 MEA
- 10.6.1 South Africa
- 10.6.2 UAE
- 10.6.3 Saudi Arabia
- 10.6.4 Rest of MEA
Chapter 11 Company Profiles
- 11.1 Advanced Micro Devices, Inc
- 11.2 Alibaba Cloud
- 11.3 Amazon Web Services Inc.
- 11.4 Autodesk Inc.
- 11.5 Dassault Systems, Inc.
- 11.6 dinCloud
- 11.7 FluidStack, Ltd.
- 11.8 Google LLC
- 11.9 IBM Corporation
- 11.10 Intel Corporation
- 11.11 Lamba, Inc.
- 11.12 Linode LLC
- 11.13 Microsoft Corporation
- 11.14 Nimbix, Inc.
- 11.15 NVIDIA Corporation
- 11.16 OVH Cloud
- 11.17 Penguin Computing Inc.
- 11.18 Qualcomm Technologies, Inc.
- 11.19 ScaleMatrix Holdings, Inc.
- 11.20 VULTR (The Constant Company LLC)


