|
|
市場調査レポート
商品コード
1462554
中古電子製品市場規模:製品タイプ別、最終用途別、流通チャネル別、2024-2032年予測Second-hand Electronic Products Market Size - By Product Type, By End Use, By Distribution Channel & Forecast 2024 -2032 |
||||||

|
|||||||
カスタマイズ可能
|
|||||||


| 中古電子製品市場規模:製品タイプ別、最終用途別、流通チャネル別、2024-2032年予測 |
|
出版日: 2024年02月26日
発行: Global Market Insights Inc.
ページ情報: 英文 161 Pages
納期: 2~3営業日
|

全表示
- 概要
- 目次
中古電子製品の市場規模は、2024年から2032年にかけてCAGR 3.8%以上で拡大すると予測されます。
環境維持に対する意識の高まりにより、消費者は電子機器廃棄物やカーボンフットプリントを削減するために中古電子機器を選ぶようになっています。特に予算に敏感な消費者や新興市場の消費者の間で、手頃な価格の電子機器に対する需要が高まっていることが、中古電子製品の需要を促進しています。
インド・ブランド・エクイティ財団(IBEF)によると、国内の電子機器製造業は2025-26年までに3,000億米ドル規模になるといいます。電子部門の拡大は、中古電子製品の需要に拍車をかけると思われます。技術の大幅な進歩により、製品のライフサイクルが短くなり、消費者が機器を頻繁にアップグレードするようになった結果、中古電子機器の供給が増加しています。最近では、中古電子機器の売買に特化したオンラインマーケットプレースやプラットフォームが普及したことで、消費者がこれらの製品にアクセスし、取引することが容易になり、市場の成長をさらに後押ししています。
中古電子製品産業は、製品タイプ、最終用途、流通チャネル、地域に分類されます。
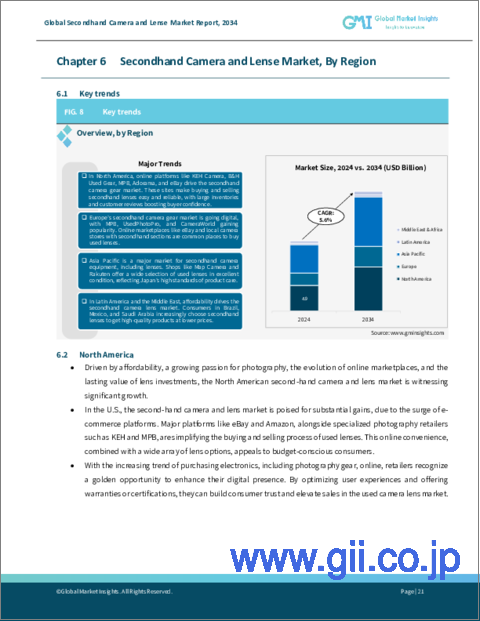
製品タイプ別では、カメラ・レンズ分野の市場規模が2024年から2032年にかけて3.1%の成長率で拡大すると予測されています。これは、カメラ技術の急速な製品化とアップグレードによるものです。趣味や職業としての写真撮影の人気が高まっていることが、高品質でありながら手頃な価格の機器への需要に拍車をかけています。中古カメラやレンズの売買に特化したオンライン・プラットフォームの動向の高まりは、消費者に幅広い選択肢への便利なアクセスを提供し、セグメントの成長に拍車をかけています。
個人向け最終用途セグメントの中古電子製品市場は、コスト削減と環境持続可能性に対する消費者の意識の高まりにより、2032年までCAGR 2.2%で成長すると推定されます。最新技術にアクセスするために電子機器を頻繁にアップグレードする動向の高まりが、中古電子機器の供給を加速させています。中古電子機器の売買にオンライン・プラットフォームが提供する利便性も、個人にとっての市場アクセシビリティを高めています。
地域別では、欧州の中古電子製品市場は2024年から2032年にかけてCAGR 3.6%になると予測されています。厳しい環境規制の流入は、持続可能な消費文化を育むためにリサイクルと再利用を奨励しています。コスト削減や、手頃な価格でありながら機能的な電子機器の入手可能性といった経済的要因が、中古機器に対する消費者の嗜好を後押ししています。中古電子機器の売買に便利な手段を提供するオンライン・マーケットプレースやeコマース・プラットフォームの普及は、この地域の産業成長に貢献すると思われます。
目次
第1章 調査手法と調査範囲
第2章 エグゼクティブサマリー
第3章 市場洞察
- エコシステム分析
- 原材料分析
- 主要ニュースと取り組み
- パートナーシップ/提携
- 合併/買収
- 投資
- 製品上市とイノベーション
- 規制状況
- 影響要因
- 促進要因
- 業界の潜在的リスク&課題
- 消費者の購買行動分析
- 成長ポテンシャル分析
- ポーター分析
- PESTEL分析
- 貿易分析
- 輸出データ
- 輸入データ
第4章 競合情勢
- イントロダクション
- 各社の市場シェア
- 主要市場企業の競合分析
- 競合のポジショニング・マトリックス
- 戦略展望マトリックス
第5章 市場推計・予測:製品タイプ別、2018年~2032年
- 主要動向
- スマートフォン&タブレット
- テレビ・AV機器
- コンピュータ&ノートパソコン
- カメラ・レンズ
- ハードディスク・プリンター・モニター
- キッチン用品
- 洗濯機・冷蔵庫
- その他
第6章 市場推計・予測:最終用途別、2018年~2032年
- 主要動向
- 個人
- 商業
第7章 市場推計・予測:流通チャネル別、2018年~2032年
- 主要動向
- オンライン
- オフライン
第8章 市場推計・予測:地域別、2018年~2032年
- 主要動向
- 北米
- 米国
- カナダ
- 欧州
- 英国
- ドイツ
- フランス
- イタリア
- スペイン
- その他欧州
- アジア太平洋
- 中国
- インド
- 日本
- 韓国
- オーストラリア
- マレーシア
- インドネシア
- その他アジア太平洋地域
- ラテンアメリカ
- ブラジル
- メキシコ
- その他ラテンアメリカ
- 中東・アフリカ
- サウジアラビア
- UAE
- 南アフリカ
- その他のMEA
第9章 企業プロファイル
- Amazon
- eBay Marketplace
- Facebook Marketplace
- Shopify
- OfferUp
- Poshmark Marketplace
- ThreadUp Marketplace
- Tradesy Marketplace
- Mercari, Inc.
- Olx
- Walmart
Second-hand Electronic Products Market size is projected to expand at over 3.8% CAGR from 2024 to 2032. The increasing awareness of environmental sustainability is prompting consumers to opt for pre-owned electronics to reduce electronic waste and carbon footprint. The rising demand for affordable electronic devices, especially among budget-conscious consumers and those in emerging markets is driving the demand for second-hand electronic products.
As per the India Brand Equity Foundation (IBEF), the electronics manufacturing industry in the country will be worth USD 300 billion by 2025-26. The expansion of electronic sector will spur the demand for used electronic items. Significant technology advancements are leading to shorter product lifecycles and encouraging consumers to upgrade their devices more frequently, resulting in a higher supply of second-hand electronics. Of late, the proliferation of online marketplaces and platforms dedicated to buying and selling pre-owned electronics has also made it easier for consumers to access and trade these products, further driving the market growth.
The second-hand electronic products industry is segregated into product type, end-use, distribution channel, and region.
In terms of product type, the market value from the cameras and lens segment is anticipated to expand at 3.1% rate from 2024 to 2032. This is owing to the rapid product iterations and upgrades in camera technology. The increasing popularity of photography as a hobby and profession is fueling the demand for high-quality yet affordable equipment. The rising trend of online platforms dedicated to buying and selling used cameras and lenses is providing consumers with convenient access to a wide range of options, adding to the segment growth.
Second-hand electronic products market from the individual end-use segment is estimated to rise at 2.2% CAGR until 2032, due to the increasing consumer awareness of cost savings and environmental sustainability. The growing trend of upgrading electronic devices frequently to access the latest technologies is accelerating the supply of used electronics. The convenience offered by online platforms for buying and selling second-hand electronics is also enhancing the market accessibility for the individuals.
Regionally, the Europe second-hand electronic products market is projected to witness 3.6% CAGR between 2024 and 2032. The influx of stringent environmental regulations is encouraging recycling and reuse for fostering a sustainable consumption culture. Economic factors like cost savings and the availability of affordable yet functional electronics is driving the consumer preference for used devices. The proliferation of online marketplaces and e-commerce platforms for offering convenient avenues for buying and selling second-hand electronics will contribute to the regional industry growth.
Table of Contents
Chapter 1 Methodology & Scope
- 1.1 Market scope & definition
- 1.2 Base estimates & calculations
- 1.3 Forecast calculation
- 1.4 Data sources
- 1.4.1 Primary
- 1.4.2 Secondary
- 1.4.2.1 Paid sources
- 1.4.2.2 Public sources
Chapter 2 Executive Summary
- 2.1 Market 360 degree synopsis, 2018 - 2032
- 2.2 Business trends
- 2.3 Regional trends
- 2.4 Product type trends
- 2.5 End use trends
- 2.6 Distribution channel trends
Chapter 3 Market Insights
- 3.1 Industry ecosystem analysis
- 3.2 Raw material analysis
- 3.3 Key news and initiatives
- 3.3.1 Partnership/Collaboration
- 3.3.2 Merger/Acquisition
- 3.3.3 Investment
- 3.3.4 Product launch & innovation
- 3.4 Regulatory landscape
- 3.5 Impact forces
- 3.5.1 Growth drivers
- 3.5.2 Industry pitfalls & challenges
- 3.6 Consumer buying behavior analysis
- 3.7 Growth potential analysis
- 3.8 Porter's analysis
- 3.9 PESTEL analysis
- 3.10 Trade analysis
- 3.10.1 Export data
- 3.10.2 Import data
Chapter 4 Competitive Landscape, 2023
- 4.1 Introduction
- 4.2 Company market share, 2023
- 4.3 Competitive analysis of major market players, 2023
- 4.4 Competitive positioning matrix, 2023
- 4.5 Strategic outlook matrix, 2023
Chapter 5 Market Estimates & Forecast, By Product Type 2018 - 2032, (USD Billion; Million Units)
- 5.1 Key trends
- 5.2 Smartphones & tablets
- 5.3 TVs & audio-video devices
- 5.4 Computers & laptops
- 5.5 Cameras & lens
- 5.6 Hard disks/printers and monitors
- 5.7 Kitchen appliances
- 5.8 Washing machines/refrigerators
- 5.9 Others
Chapter 6 Market Estimates & Forecast, By End Use 2018 - 2032, (USD Billion; Million Units)
- 6.1 Key trends
- 6.2 Individual
- 6.3 Commercial
Chapter 7 Market Estimates & Forecast, By Distribution Channel 2018 - 2032, (USD Billion; Million Units)
- 7.1 Key trends
- 7.2 Online
- 7.3 Offline
Chapter 8 Market Estimates & Forecast, By Region 2018 - 2032, (USD Billion; Million Units)
- 8.1 Key trends
- 8.2 North America
- 8.2.1 U.S.
- 8.2.2 Canada
- 8.3 Europe
- 8.3.1 UK
- 8.3.2 Germany
- 8.3.3 France
- 8.3.4 Italy
- 8.3.5 Spain
- 8.3.6 Rest of Europe
- 8.4 Asia Pacific
- 8.4.1 China
- 8.4.2 India
- 8.4.3 Japan
- 8.4.4 South Korea
- 8.4.5 Australia
- 8.4.6 Malaysia
- 8.4.7 Indonesia
- 8.4.8 Rest of Asia Pacific
- 8.5 Latin America
- 8.5.1 Brazil
- 8.5.2 Mexico
- 8.5.3 Rest of Latin America
- 8.6 MEA
- 8.6.1 Saudi Arabia
- 8.6.2 UAE
- 8.6.3 South Africa
- 8.6.4 Rest of MEA
Chapter 9 Company Profiles
- 9.1 Amazon
- 9.2 eBay Marketplace
- 9.3 Facebook Marketplace
- 9.4 Shopify
- 9.5 OfferUp
- 9.6 Poshmark Marketplace
- 9.7 ThreadUp Marketplace
- 9.8 Tradesy Marketplace
- 9.9 Mercari, Inc.
- 9.10 Olx
- 9.11 Walmart

