
|
市場調査レポート
商品コード
1716590
生物防除剤市場の機会、成長促進要因、産業動向分析、2025年~2034年の予測Biocontrol Agents Market Opportunity, Growth Drivers, Industry Trend Analysis, and Forecast 2025 - 2034 |
||||||
カスタマイズ可能
|
|||||||
| 生物防除剤市場の機会、成長促進要因、産業動向分析、2025年~2034年の予測 |
|
出版日: 2025年03月28日
発行: Global Market Insights Inc.
ページ情報: 英文 263 Pages
納期: 2~3営業日
|

全表示
- 概要
- 目次
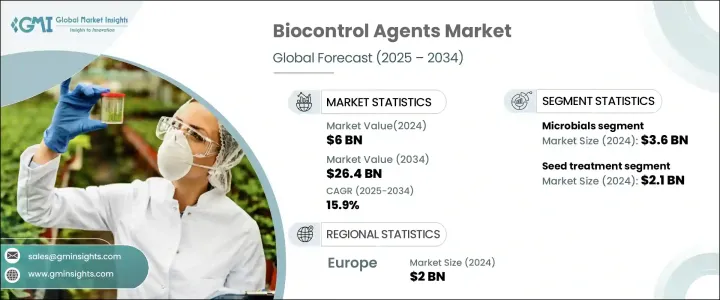
世界の生物防除剤市場は、2024年に60億米ドルと評価され、2025年から2034年にかけて15.9%のCAGRで拡大すると予測されています。
生物防除剤は、細菌、真菌、ウイルスなどの天然生物で、農業やその他の分野における害虫や病気を防除します。合成農薬とは異なり、これらの薬剤は有害な種を管理するために生態学的相互作用に依存しており、より持続可能な解決策を提供しています。この成長の主な原動力は、世界の有機生産方式に対する需要の高まりです。消費者は食品の生産方法に対する関心を高めており、環境にやさしく健康や生態系への害が少ない方法を好むようになっています。
生物防除剤の需要も、生物多様性の損失、生態系の損傷、健康リスクへの寄与など、化学農薬の有害性に対する意識の高まりによって後押しされています。持続可能な農法へのシフトは、農家が生物防除法を採用する動機付けとなっています。生物防除法は非常に効果的で環境に優しく、総合的有害生物管理(IPM)システムの中でうまく機能するからです。害虫を選択的に標的にする能力を持つ生物防除剤は、環境への影響を最小限に抑えながら長期的な解決策を提供します。
| 市場範囲 | |
|---|---|
| 開始年 | 2024 |
| 予測年 | 2025-2034 |
| 開始金額 | 60億米ドル |
| 予測金額 | 264億米ドル |
| CAGR | 15.9% |
市場は、活性物質、作物の種類、適用方法によって区分されます。細菌、真菌、ウイルスなどの有益微生物を含む微生物分野は、2024年に36億米ドルの最大シェアを占めました。この分野は、農家が環境的に安全な害虫管理の代替手段を求めているため、成長を続けています。生物防除剤は、果物・野菜、穀物・穀類、豆類など、さまざまな作物の種類で広く使用されています。果実・野菜分野は2024年に26億米ドルを占め、無農薬農産物に対する消費者の需要によって大きく成長すると予想されます。さらに、2024年に21億米ドルと評価された種子処理分野は、予測期間中にCAGR 16.7%で成長すると予測されています。この用途は、作物を植える前に害虫の問題を予防し、植物の健全な成長を確保するのに役立ちます。
欧州は世界の生物防除剤市場をリードしており、2024年の評価額は20億米ドルです。欧州諸国、特にフランス、ドイツ、オランダは、持続可能な農業への取り組みにより、生物防除剤を急速に採用しています。農薬使用の削減と有機農業の拡大を目指す欧州グリーンディールは、生物防除剤の採用を大幅に後押ししています。この転換は、総合的害虫管理と生物学的代替物を推進するEUの政策や国のプログラムによって支えられています。残留農薬のない食品に対する消費者の嗜好の高まりも、この地域の市場を牽引する重要な要因です。
目次
第1章 調査手法と調査範囲
第2章 エグゼクティブサマリー
第3章 業界洞察
- エコシステム分析
- バリューチェーンに影響を与える要因
- 利益率分析
- ディスラプション
- 将来の展望
- メーカー
- 流通業者
- サプライヤーの状況
- 利益率分析
- 主要ニュースと取り組み
- 規制状況
- 影響要因
- 促進要因
- 欧州における有機農業への需要の高まり
- 化学肥料に対する厳しい規制
- 業界の潜在的リスク&課題
- 害虫に対する効果の遅さ
- 従来の肥料と比較して高コスト
- 促進要因
- 成長可能性分析
- ポーター分析
- PESTEL分析
第4章 競合情勢
- イントロダクション
- 企業シェア分析
- 競合のポジショニング・マトリックス
- 戦略展望マトリックス
第5章 市場推計・予測:活性物質別、2021年~2034年
- 主要動向
- 微生物
- 細菌
- 菌類
- ウイルス
- 原虫
- 酵母
- その他
- マクロ生物
- 昆虫
- ダニ類
- 線虫類
- その他
- バイオケミカル
- セミケミカル
- 植物抽出物
- 植物成長調整剤
- 有機酸
- ミネラル
第6章 市場推計・予測:作物別、2021年~2034年
- 主要動向
- 果物・野菜
- 穀物・穀類
- 豆類
- その他
第7章 市場推計・予測:用途別、2021年~2034年
- 主要動向
- 種子処理
- オンフィールド
- ポストハーベスト
第8章 市場推計・予測:地域別、2021年~2034年
- 主要動向
- 北米
- 米国
- カナダ
- 欧州
- ドイツ
- 英国
- フランス
- スペイン
- イタリア
- オランダ
- アジア太平洋
- 中国
- インド
- 日本
- オーストラリア
- 韓国
- ラテンアメリカ
- ブラジル
- メキシコ
- アルゼンチン
- 中東・アフリカ
- サウジアラビア
- 南アフリカ
- アラブ首長国連邦
第9章 企業プロファイル
- Andermatt Biocontrol
- Basf
- Biobest
- Bioworks
- Cbc
- Certis
- Cropscience Bayer
- Isagro
- Koppert Biological Systems
- Marrone Bio Innovations
- Novozymes
- Nufarm
- Syngenta
- Valent Bioscience
The Global Biocontrol Agents Market was valued at USD 6 billion in 2024 and is projected to expand at a CAGR of 15.9% from 2025 to 2034. Biocontrol agents are natural organisms, such as bacteria, fungi, and viruses, that control pests and diseases in agriculture and other sectors. Unlike synthetic pesticides, these agents rely on ecological interactions to manage harmful species, offering a more sustainable solution. This growth is largely driven by the rising demand for organic production methods worldwide. Consumers are increasingly concerned about how food is produced, favoring methods that are environmentally friendly and less harmful to both health and ecosystems.
The demand for biocontrol agents is also being fueled by the growing awareness of the harmful effects of chemical pesticides, including their contribution to biodiversity loss, ecosystem damage, and health risks. This shift towards sustainable agricultural practices is motivating farmers to adopt biocontrol methods, as they are highly effective, eco-friendly, and work well within integrated pest management (IPM) systems. With their ability to target pests selectively, biocontrol agents offer long-lasting solutions with minimal environmental impact.
| Market Scope | |
|---|---|
| Start Year | 2024 |
| Forecast Year | 2025-2034 |
| Start Value | $6 Billion |
| Forecast Value | $26.4 Billion |
| CAGR | 15.9% |
The market is segmented by active substance, crop type, and method of application. The microbials segment, which includes beneficial microorganisms like bacteria, fungi, and viruses, held the largest share of USD 3.6 billion in 2024. This segment continues to grow as farmers seek environmentally safe pest management alternatives. Biocontrol agents are widely used across different crop types, including fruits and vegetables, cereals and grains, and pulses. The fruits and vegetables segment accounted for USD 2.6 billion in 2024 and is expected to grow significantly, driven by consumer demand for pesticide-free produce. Additionally, the seed treatment segment, valued at USD 2.1 billion in 2024, is predicted to grow at a CAGR of 16.7% during the forecast period. This application helps prevent pest problems before crops are planted, ensuring healthy plant growth.
Europe leads the global biocontrol agents market, with a valuation of USD 2 billion in 2024. European countries, particularly France, Germany, and the Netherlands, are adopting biocontrol products rapidly due to their commitment to sustainable farming. The European Green Deal, which aims to reduce pesticide use and increase organic farming, is significantly boosting biocontrol adoption. This shift is supported by EU policies and national programs promoting integrated pest management and biological alternatives. The growing consumer preference for food without pesticide residues is also a key factor driving the market in this region.
Table of Contents
Chapter 1 Methodology and Scope
- 1.1 Market scope and definition
- 1.2 Base estimates and calculations
- 1.3 Forecast calculation
- 1.4 Data sources
- 1.4.1 Primary
- 1.4.2 Secondary
- 1.4.2.1 Paid sources
- 1.4.2.2 Public sources
- 1.5 Primary research and validation
- 1.5.1 Primary sources
- 1.5.2 Data mining sources
Chapter 2 Executive Summary
- 2.1 Industry synopsis, 2021-2034
Chapter 3 Industry Insights
- 3.1 Industry ecosystem analysis
- 3.1.1 Factor affecting the value chain
- 3.1.2 Profit margin analysis
- 3.1.3 Disruptions
- 3.1.4 Future outlook
- 3.1.5 Manufacturers
- 3.1.6 Distributors
- 3.2 Supplier landscape
- 3.3 Profit margin analysis
- 3.4 Key news and initiatives
- 3.5 Regulatory landscape
- 3.6 Impact forces
- 3.6.1 Growth drivers
- 3.6.1.1 Rising demand for organic farming in Europe
- 3.6.1.2 Stringent regulations against chemical fertilizers
- 3.6.2 Industry pitfalls and challenges
- 3.6.2.1 Slow effect on pest
- 3.6.2.2 High cost in comparison with conventional fertilizers
- 3.6.1 Growth drivers
- 3.7 Growth potential analysis
- 3.8 Porter's analysis
- 3.9 PESTEL analysis
Chapter 4 Competitive Landscape, 2024
- 4.1 Introduction
- 4.2 Company market share analysis
- 4.3 Competitive positioning matrix
- 4.4 Strategic outlook matrix
Chapter 5 Market Estimates and Forecast, By Active Substance, 2021 - 2034 (USD Billion) (Kilo Tons)
- 5.1 Key trends
- 5.2 Microbials
- 5.2.1 Bacteria
- 5.2.2 Fungi
- 5.2.3 Virus
- 5.2.4 Protozoa
- 5.2.5 Yeast
- 5.2.6 Others
- 5.3 Macro-organisms
- 5.3.1 Insects
- 5.3.2 Mites
- 5.3.3 Nematodes
- 5.3.4 Others
- 5.4 Bio-chemicals
- 5.4.1 Semio-chemicals
- 5.4.2 Plant extracts
- 5.4.3 Plant growth regulators
- 5.4.4 Organic acids
- 5.4.5 Minerals
Chapter 6 Market Estimates and Forecast, By Crop, 2021 - 2034 (USD Billion) (Kilo Tons)
- 6.1 Key trends
- 6.2 Fruits and vegetables
- 6.3 Cereals & grains
- 6.4 Pulses
- 6.5 Others
Chapter 7 Market Estimates and Forecast, By Application, 2021 – 2034 (USD Billion) (Kilo Tons)
- 7.1 Key trends
- 7.2 Seed treatment
- 7.3 On-field
- 7.4 Post-harvest
Chapter 8 Market Estimates and Forecast, By Region, 2021 – 2034 (USD Billion) (Kilo Tons)
- 8.1 Key trends
- 8.2 North America
- 8.2.1 U.S.
- 8.2.2 Canada
- 8.3 Europe
- 8.3.1 Germany
- 8.3.2 UK
- 8.3.3 France
- 8.3.4 Spain
- 8.3.5 Italy
- 8.3.6 Netherlands
- 8.4 Asia Pacific
- 8.4.1 China
- 8.4.2 India
- 8.4.3 Japan
- 8.4.4 Australia
- 8.4.5 South Korea
- 8.5 Latin America
- 8.5.1 Brazil
- 8.5.2 Mexico
- 8.5.3 Argentina
- 8.6 Middle East and Africa
- 8.6.1 Saudi Arabia
- 8.6.2 South Africa
- 8.6.3 UAE
Chapter 9 Company Profiles
- 9.1 Andermatt Biocontrol
- 9.2 Basf
- 9.3 Biobest
- 9.4 Bioworks
- 9.5 Cbc
- 9.6 Certis
- 9.7 Cropscience Bayer
- 9.8 Isagro
- 9.9 Koppert Biological Systems
- 9.10 Marrone Bio Innovations
- 9.11 Novozymes
- 9.12 Nufarm
- 9.13 Syngenta
- 9.14 Valent Bioscience
