|
|
市場調査レポート
商品コード
1422700
データセンター向けGPU市場規模:展開モデル、機能、エンドユーザー別、成長見通し、地域別展望、世界予測、2024~2032年Data Center GPU Market Size - By Deployment Model (On-Premises, Cloud), Function (Training, Inference), End User (Cloud Service Providers, Enterprises, Government), Growth Prospects, Regional Outlook & Global Forecast, 2024 - 2032 |
||||||
|
|
|||||||
カスタマイズ可能
|
|||||||


| データセンター向けGPU市場規模:展開モデル、機能、エンドユーザー別、成長見通し、地域別展望、世界予測、2024~2032年 |
|
出版日: 2023年12月07日
発行: Global Market Insights Inc.
ページ情報: 英文 220 Pages
納期: 2~3営業日
|

- 全表示
- 概要
- 図表
- 目次
データセンター向けGPU市場は、ハイパフォーマンス・コンピューティング(HPC)とデータ集約型アプリケーションの需要増加を背景に、2024年から2032年にかけて28.5%以上のCAGRを記録すると予測されています。
GPUは処理能力に優れているため、AIやML、科学研究などの分野で複雑な計算を処理するのに適しています。2023年12月、インドのIITブバネスワールは、AIと高性能コンピューティングの分野で学際的かつ共同研究を行うため、AI・HPC研究センター(AHRC)を新設しました。
クラウドサービスプロバイダーはGPUを活用して仮想マシンの処理能力を強化し、多様なワークロードに効率的に対応できるようにしています。これは、各分野のビジネスがクラウドベースのソリューションにシフトする中で特に顕著であり、データセンターにおける強力なGPUセットアップの需要にさらに拍車をかけています。
データセンター向けGPU産業は、展開モデル、機能、エンドユーザー、地域によって分類されます。
特に画像認識、自然言語処理、自律システムなどの分野で人工知能(AI)アプリケーションの導入が増加しているため、推論分野は2024~2032年に大幅な成長が見込まれています。事前に訓練されたモデルがリアルタイムの意思決定を行う推論機能に重点が置かれていることが、業界の成長に寄与しています。
エンドユーザーの範囲別では、データ集約型アプリケーションのための高度なコンピューティング技術への依存度が高まっていることから、政府部門が2032年まで適正な成長を遂げると予測されています。政府機関は、データ分析、シミュレーション、サイバーセキュリティなどの分野で能力を強化するため、データセンター向けGPUへの依存を強めています。生成されるデータ量は増加の一途をたどっており、データの安全性を確保しながらそれを処理する必要があるため、同分野のシェアは高まると思われます。
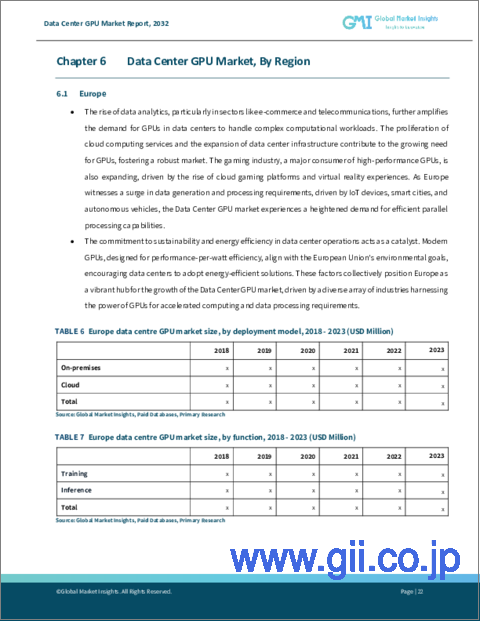
欧州のデータセンター向けGPU産業は、データセンターにおける持続可能性とエネルギー効率の重視の高まりを背景に、予測期間中に収益を上げる見込みです。ヘルスケア、金融、製造などの業界でGPUアクセラレーション・アプリケーションの採用が増加しており、イノベーションとデジタルトランスフォーメーションが欧州市場の拡大に寄与しています。
目次
第1章 調査手法と調査範囲
第2章 エグゼクティブサマリー
第3章 データセンター向けGPU業界考察
- エコシステム分析
- サプライヤーの情勢
- 原材料および部品サプライヤー
- メーカー
- ソフトウェアおよびテクノロジープロバイダー
- サービスプロバイダー
- エンドユーザー
- 利益率分析
- テクノロジーとイノベーションの展望
- 特許分析
- 主要ニュースとイニシアチブ
- パートナーシップ/コラボレーション
- 合併/買収
- 投資
- 展開モデルの立ち上げと革新
- 規制状況
- 影響要因
- 促進要因
- AIと機械学習に対する需要の高まり
- エッジコンピューティングの出現
- データの可視化とレンダリングの進歩
- 科学研究のための並列処理
- 業界の潜在的リスク&課題
- 高い初期コスト
- 消費電力と冷却要件
- 促進要因
- 成長可能性分析
- ポーター分析
- PESTEL分析
第4章 競合情勢
- イントロダクション
- 各社の市場シェア
- 主要市場プレーヤーの競合分析
- NVIDIA Corporation
- Intel Corporation
- Advanced Micro Devices, Inc
- Samsung Electronics Co., Ltd.
- Huawei Technologies Co., Ltd.
- Advantech Co., Ltd.
- 競合のポジショニング・マトリックス
- 戦略展望マトリックス
第5章 データセンター向けGPU市場推定・予測:展開モデル別
- 主要動向:展開モデル別
- オンプレミス
- クラウド
第6章 データセンター向けGPU市場推定・予測:機能別
- 主要動向:機能別
- トレーニング
- 推論
第7章 データセンター向けGPU市場推定・予測:エンドユーザー別
- 主要動向:エンドユーザー別
- クラウド事業者
- 企業
- 政府機関
第8章 データセンター向けGPU市場推定・予測:地域別
- 主要動向:地域別
- 北米
- 米国
- カナダ
- 欧州
- 英国
- ドイツ
- フランス
- イタリア
- スペイン
- 北欧
- アジア太平洋
- 中国
- インド
- 日本
- オーストラリア
- 韓国
- シンガポール
- ラテンアメリカ
- ブラジル
- メキシコ
- アルゼンチン
- 中東・アフリカ
- UAE
- サウジアラビア
- 南アフリカ
第9章 企業プロファイル
- Advanced Micro Devices, Inc
- Advantech Co., Ltd.
- Apple Inc.
- Arm Ltd.
- GIGABYTE Technology Co., Ltd.
- Google Inc.
- Graphcore
- Huawei Technologies Co., Ltd.
- Imagination Technologies
- Intel Corporation
- IBM Corporation
- Microchip Technology Inc.
- Micron Technology, Inc.
- Microsoft Corporation
- Nimbix, Inc.
- NVIDIA Corporation
- Penguin Computing, Inc
- Qualcomm Technologies, Inc.
- Samsung Electronics Co., Ltd.
- ZOTAC Technology Ltd.
Data Tables
- TABLE 1 Global data center GPU market 360 degree synopsis, 2018-2032
- TABLE 2 Data center GPU market, 2018 - 2023,
- TABLE 3 Data center GPU market, 2024 - 2032,
- TABLE 4 Data center GPU TAM, 2023 - 2032
- TABLE 5 Data center GPU market, by deployment model, 2018 - 2023 (USD Million)
- TABLE 6 Data center GPU market, by deployment model, 2024 - 2032 (USD Million)
- TABLE 7 Data center GPU market, by function, 2018 - 2023 (USD Million)
- TABLE 8 Data center GPU market, by function, 2024 - 2032 (USD Million)
- TABLE 9 Data center GPU market, by end user, 2018 - 2023 (USD Million)
- TABLE 10 Data center GPU market, by end user, 2024 - 2032 (USD Million)
- TABLE 11 COVID-19 impact on the North America data center GPU market
- TABLE 12 COVID-19 impact on the Europe data center GPU market
- TABLE 13 COVID-19 impact on the Asia Pacific data center GPU market
- TABLE 14 COVID-19 impact on the Latin America data center GPU market
- TABLE 15 COVID-19 impact on the MEA data center GPU market
- TABLE 16 Supplier landscape
- TABLE 17 Patent analysis
- TABLE 18 Industry impact forces
- TABLE 19 Company market share, 2022
- TABLE 20 Competitive analysis of major market players, 2022
- TABLE 21 On-premises market, 2018 - 2023 (USD Million)
- TABLE 22 On-premises market, 2024 - 2032 (USD Million)
- TABLE 23 Others market, 2024 - 2032 (USD Million)
- TABLE 24 Cloud market, 2018 - 2023 (USD Million)
- TABLE 25 Cloud market, 2024 - 2032 (USD Million)
- TABLE 26 Training market, 2018 - 2023 (USD Million)
- TABLE 27 Training market, 2024 - 2032 (USD Million)
- TABLE 28 Inference market, 2018 - 2023 (USD Million)
- TABLE 29 Inference market, 2024 - 2032 (USD Million)
- TABLE 30 Cloud service providers market, 2018 - 2023 (USD Million)
- TABLE 31 Cloud service providers market, 2024 - 2032 (USD Million)
- TABLE 32 Enterprises market, 2018 - 2023 (USD Million)
- TABLE 33 Enterprises market, 2024 - 2032 (USD Million)
- TABLE 34 Government market, 2018 - 2023 (USD Million)
- TABLE 35 Government market, 2024 - 2032 (USD Million)
- TABLE 36 North America data center GPU market, 2018 - 2023 (USD Million)
- TABLE 37 North America data center GPU market, 2024 - 2032 (USD Million)
- TABLE 38 North America data center GPU market, by deployment model, 2018 - 2022 (USD Million)
- TABLE 39 North America data center GPU market, by deployment model, 2024 - 2032 (USD Million)
- TABLE 40 North America data center GPU market, by function, 2018 - 2022 (USD Million)
- TABLE 41 North America data center GPU market, by function, 2024 - 2032 (USD Million)
- TABLE 42 North America data center GPU market, by end user, 2018 - 2022 (USD Million)
- TABLE 43 North America data center GPU market, by end user, 2024 - 2032 (USD Million)
- TABLE 44 U.S. data center GPU market, 2018 - 2023 (USD Million)
- TABLE 45 U.S. data center GPU market, 2024 - 2032 (USD Million)
- TABLE 46 U.S. data center GPU market, by deployment model, 2018 - 2022 (USD Million)
- TABLE 47 U.S. data center GPU market, by deployment model, 2024 - 2032 (USD Million)
- TABLE 48 U.S. data center GPU market, by function, 2018 - 2022 (USD Million)
- TABLE 49 U.S. data center GPU market, by function, 2024 - 2032 (USD Million)
- TABLE 50 U.S. data center GPU market, by end user, 2018 - 2022 (USD Million)
- TABLE 51 U.S. data center GPU market, by end user, 2024 - 2032 (USD Million)
- TABLE 52 Canada data center GPU market, 2018 - 2023 (USD Million)
- TABLE 53 Canada data center GPU market, 2024 - 2032 (USD Million)
- TABLE 54 Canada data center GPU market, by deployment model, 2018 - 2022 (USD Million)
- TABLE 55 Canada data center GPU market, by deployment model, 2024 - 2032 (USD Million)
- TABLE 56 Canada data center GPU market, by function, 2018 - 2022 (USD Million)
- TABLE 57 Canada data center GPU market, by function, 2024 - 2032 (USD Million)
- TABLE 58 Canada data center GPU market, by end user, 2018 - 2022 (USD Million)
- TABLE 59 Canada data center GPU market, by end user, 2024 - 2032 (USD Million)
- TABLE 60 Europe data center GPU market, 2018 - 2023 (USD Million)
- TABLE 61 Europe data center GPU market, 2024 - 2032 (USD Million)
- TABLE 62 Europe data center GPU market, by deployment model, 2018 - 2022 (USD Million)
- TABLE 63 Europe data center GPU market, by deployment model, 2024 - 2032 (USD Million)
- TABLE 64 Europe data center GPU market, by function, 2018 - 2022 (USD Million)
- TABLE 65 Europe data center GPU market, by function, 2024 - 2032 (USD Million)
- TABLE 66 Europe data center GPU market, by end user, 2018 - 2022 (USD Million)
- TABLE 67 Europe data center GPU market, by end user, 2024 - 2032 (USD Million)
- TABLE 68 UK data center GPU market, 2018 - 2023 (USD Million)
- TABLE 69 UK data center GPU market, 2024 - 2032 (USD Million)
- TABLE 70 UK data center GPU market, by deployment model, 2018 - 2022 (USD Million)
- TABLE 71 UK data center GPU market, by deployment model, 2024 - 2032 (USD Million)
- TABLE 72 UK data center GPU market, by function, 2018 - 2022 (USD Million)
- TABLE 73 UK data center GPU market, by function, 2024 - 2032 (USD Million)
- TABLE 74 UK data center GPU market, by end user, 2018 - 2022 (USD Million)
- TABLE 75 UK data center GPU market, by end user, 2024 - 2032 (USD Million)
- TABLE 76 Germany data center GPU market, 2018 - 2023 (USD Million)
- TABLE 77 Germany data center GPU market, 2024 - 2032 (USD Million)
- TABLE 78 Germany data center GPU market, by deployment model, 2018 - 2022 (USD Million)
- TABLE 79 Germany data center GPU market, by deployment model, 2024 - 2032 (USD Million)
- TABLE 80 Germany data center GPU market, by function, 2018 - 2022 (USD Million)
- TABLE 81 Germany data center GPU market, by function, 2024 - 2032 (USD Million)
- TABLE 82 Germany data center GPU market, by end user, 2018 - 2022 (USD Million)
- TABLE 83 Germany data center GPU market, by end user, 2024 - 2032 (USD Million)
- TABLE 84 France data center GPU market, 2018 - 2023 (USD Million)
- TABLE 85 France data center GPU market, 2024 - 2032 (USD Million)
- TABLE 86 France data center GPU market, by deployment model, 2018 - 2022 (USD Million)
- TABLE 87 France data center GPU market, by deployment model, 2024 - 2032 (USD Million)
- TABLE 88 France data center GPU market, by function, 2018 - 2022 (USD Million)
- TABLE 89 France data center GPU market, by function, 2024 - 2032 (USD Million)
- TABLE 90 France data center GPU market, by end user, 2018 - 2022 (USD Million)
- TABLE 91 France data center GPU market, by end user, 2024 - 2032 (USD Million)
- TABLE 92 Italy data center GPU market, 2018 - 2023 (USD Million)
- TABLE 93 Italy data center GPU market, 2024 - 2032 (USD Million)
- TABLE 94 Italy data center GPU market, by deployment model, 2018 - 2022 (USD Million)
- TABLE 95 Italy data center GPU market, by deployment model, 2024 - 2032 (USD Million)
- TABLE 96 Italy data center GPU market, by function, 2018 - 2022 (USD Million)
- TABLE 97 Italy data center GPU market, by function, 2024 - 2032 (USD Million)
- TABLE 98 Italy data center GPU market, by end user, 2018 - 2022 (USD Million)
- TABLE 99 Italy data center GPU market, by end user, 2024 - 2032 (USD Million)
- TABLE 100 Spain data center GPU market, 2018 - 2023 (USD Million)
- TABLE 101 Spain data center GPU market, 2024 - 2032 (USD Million)
- TABLE 102 Spain data center GPU market, by deployment model, 2018 - 2022 (USD Million)
- TABLE 103 Spain data center GPU market, by deployment model, 2024 - 2032 (USD Million)
- TABLE 104 Spain data center GPU market, by function, 2018 - 2022 (USD Million)
- TABLE 105 Spain data center GPU market, by function, 2024 - 2032 (USD Million)
- TABLE 106 Spain data center GPU market, by end user, 2018 - 2022 (USD Million)
- TABLE 107 Spain data center GPU market, by end user, 2024 - 2032 (USD Million)
- TABLE 108 Nordics data center GPU market, 2018 - 2023 (USD Million)
- TABLE 109 Nordics data center GPU market, 2024 - 2032 (USD Million)
- TABLE 110 Nordics data center GPU market, by deployment model, 2018 - 2022 (USD Million)
- TABLE 111 Nordics data center GPU market, by deployment model, 2024 - 2032 (USD Million)
- TABLE 112 Nordics data center GPU market, by function, 2018 - 2022 (USD Million)
- TABLE 113 Nordics data center GPU market, by function, 2024 - 2032 (USD Million)
- TABLE 114 Nordics data center GPU market, by end user, 2018 - 2022 (USD Million)
- TABLE 115 Nordics data center GPU market, by end user, 2024 - 2032 (USD Million)
- TABLE 116 Asia Pacific data center GPU market, 2018 - 2023 (USD Million)
- TABLE 117 Asia Pacific data center GPU market, 2024 - 2032 (USD Million)
- TABLE 118 Asia Pacific data center GPU market, by deployment model, 2018 - 2022 (USD Million)
- TABLE 119 Asia Pacific data center GPU market, by deployment model, 2024 - 2032 (USD Million)
- TABLE 120 Asia Pacific data center GPU market, by function, 2018 - 2022 (USD Million)
- TABLE 121 Asia Pacific data center GPU market, by function, 2024 - 2032 (USD Million)
- TABLE 122 Asia Pacific data center GPU market, by end user, 2018 - 2022 (USD Million)
- TABLE 123 Asia Pacific data center GPU market, by end user, 2024 - 2032 (USD Million)
- TABLE 124 China data center GPU market, 2018 - 2023 (USD Million)
- TABLE 125 China data center GPU market, 2024 - 2032 (USD Million)
- TABLE 126 China data center GPU market, by deployment model, 2018 - 2022 (USD Million)
- TABLE 127 China data center GPU market, by deployment model, 2024 - 2032 (USD Million)
- TABLE 128 China data center GPU market, by function, 2018 - 2022 (USD Million)
- TABLE 129 China data center GPU market, by function, 2024 - 2032 (USD Million)
- TABLE 130 China data center GPU market, by end user, 2018 - 2022 (USD Million)
- TABLE 131 China data center GPU market, by end user, 2024 - 2032 (USD Million)
- TABLE 132 India data center GPU market, 2018 - 2023 (USD Million)
- TABLE 133 India data center GPU market, 2024 - 2032 (USD Million)
- TABLE 134 India data center GPU market, by deployment model, 2018 - 2022 (USD Million)
- TABLE 135 India data center GPU market, by deployment model, 2024 - 2032 (USD Million)
- TABLE 136 India data center GPU market, by function, 2018 - 2022 (USD Million)
- TABLE 137 India data center GPU market, by function, 2024 - 2032 (USD Million)
- TABLE 138 India data center GPU market, by end user, 2018 - 2022 (USD Million)
- TABLE 139 India data center GPU market, by end user, 2024 - 2032 (USD Million)
- TABLE 140 Japan data center GPU market, 2018 - 2023 (USD Million)
- TABLE 141 Japan data center GPU market, 2024 - 2032 (USD Million)
- TABLE 142 Japan data center GPU market, by deployment model, 2018 - 2022 (USD Million)
- TABLE 143 Japan data center GPU market, by deployment model, 2024 - 2032 (USD Million)
- TABLE 144 Japan data center GPU market, by function, 2018 - 2022 (USD Million)
- TABLE 145 Japan data center GPU market, by function, 2024 - 2032 (USD Million)
- TABLE 146 Japan data center GPU market, by deployment model, 2018 - 2022 (USD Million)
- TABLE 147 Japan data center GPU market, by end user, 2018 - 2022 (USD Million)
- TABLE 148 Japan data center GPU market, by end user, 2024 - 2032 (USD Million)
- TABLE 149 Australia data center GPU market, 2018 - 2023 (USD Million)
- TABLE 150 Australia data center GPU market, 2024 - 2032 (USD Million)
- TABLE 151 Australia data center GPU market, by deployment model, 2018 - 2022 (USD Million)
- TABLE 152 Australia data center GPU market, by deployment model, 2024 - 2032 (USD Million)
- TABLE 153 Australia data center GPU market, by function, 2018 - 2022 (USD Million)
- TABLE 154 Australia data center GPU market, by function, 2024 - 2032 (USD Million)
- TABLE 155 Australia data center GPU market, by end user, 2018 - 2022 (USD Million)
- TABLE 156 Australia data center GPU market, by end user, 2024 - 2032 (USD Million)
- TABLE 157 South Korea data center GPU market, 2018 - 2023 (USD Million)
- TABLE 158 South Korea data center GPU market, 2024 - 2032 (USD Million)
- TABLE 159 South Korea data center GPU market, by deployment model, 2018 - 2022 (USD Million)
- TABLE 160 South Korea data center GPU market, by deployment model, 2024 - 2032 (USD Million)
- TABLE 161 South Korea data center GPU market, by function, 2018 - 2022 (USD Million)
- TABLE 162 South Korea data center GPU market, by function, 2024 - 2032 (USD Million)
- TABLE 163 South Korea data center GPU market, by end user, 2018 - 2022 (USD Million)
- TABLE 164 South Korea data center GPU market, by end user, 2024 - 2032 (USD Million)
- TABLE 165 Singapore data center GPU market, 2018 - 2023 (USD Million)
- TABLE 166 Singapore data center GPU market, 2024 - 2032 (USD Million)
- TABLE 167 Singapore data center GPU market, by deployment model, 2018 - 2022 (USD Million)
- TABLE 168 Singapore data center GPU market, by deployment model, 2024 - 2032 (USD Million)
- TABLE 169 Singapore data center GPU market, by function, 2018 - 2022 (USD Million)
- TABLE 170 Singapore data center GPU market, by function, 2024 - 2032 (USD Million)
- TABLE 171 Singapore data center GPU market, by end user, 2018 - 2022 (USD Million)
- TABLE 172 Singapore data center GPU market, by end user, 2024 - 2032 (USD Million)
- TABLE 173 Latin America data center GPU market, 2018 - 2023 (USD Million)
- TABLE 174 Latin America data center GPU market, 2024 - 2032 (USD Million)
- TABLE 175 Latin America data center GPU market, by deployment model, 2018 - 2022 (USD Million)
- TABLE 176 Latin America data center GPU market, by deployment model, 2024 - 2032 (USD Million)
- TABLE 177 Latin America data center GPU market, by function, 2018 - 2022 (USD Million)
- TABLE 178 Latin America data center GPU market, by function, 2024 - 2032 (USD Million)
- TABLE 179 Latin America data center GPU market, by end user, 2018 - 2022 (USD Million)
- TABLE 180 Latin America data center GPU market, by end user, 2024 - 2032 (USD Million)
- TABLE 181 Brazil data center GPU market, 2018 - 2023 (USD Million)
- TABLE 182 Brazil data center GPU market, 2024 - 2032 (USD Million)
- TABLE 183 Brazil data center GPU market, by deployment model, 2018 - 2022 (USD Million)
- TABLE 184 Brazil data center GPU market, by deployment model, 2024 - 2032 (USD Million)
- TABLE 185 Brazil data center GPU market, by function, 2018 - 2022 (USD Million)
- TABLE 186 Brazil data center GPU market, by function, 2024 - 2032 (USD Million)
- TABLE 187 Brazil data center GPU market, by end user, 2018 - 2022 (USD Million)
- TABLE 188 Brazil data center GPU market, by end user, 2024 - 2032 (USD Million)
- TABLE 189 Mexico data center GPU market, 2018 - 2023 (USD Million)
- TABLE 190 Mexico data center GPU market, 2024 - 2032 (USD Million)
- TABLE 191 Mexico data center GPU market, by deployment model, 2018 - 2022 (USD Million)
- TABLE 192 Mexico data center GPU market, by deployment model, 2024 - 2032 (USD Million)
- TABLE 193 Mexico data center GPU market, by function, 2018 - 2022 (USD Million)
- TABLE 194 Mexico data center GPU market, by function, 2024 - 2032 (USD Million)
- TABLE 195 Mexico data center GPU market, by end user, 2018 - 2022 (USD Million)
- TABLE 196 Mexico data center GPU market, by end user, 2024 - 2032 (USD Million)
- TABLE 197 Argentina data center GPU market, 2018 - 2023 (USD Million)
- TABLE 198 Argentina data center GPU market, 2024 - 2032 (USD Million)
- TABLE 199 Argentina data center GPU market, by deployment model, 2018 - 2022 (USD Million)
- TABLE 200 Argentina data center GPU market, by deployment model, 2024 - 2032 (USD Million)
- TABLE 201 Argentina data center GPU market, by function, 2018 - 2022 (USD Million)
- TABLE 202 Argentina data center GPU market, by function, 2024 - 2032 (USD Million)
- TABLE 203 Argentina data center GPU market, by end user, 2018 - 2022 (USD Million)
- TABLE 204 Argentina data center GPU market, by end user, 2024 - 2032 (USD Million)
- TABLE 205 MEA data center GPU market, 2018 - 2023 (USD Million)
- TABLE 206 MEA data center GPU market, 2024 - 2032 (USD Million)
- TABLE 207 MEA data center GPU market, by deployment model, 2018 - 2022 (USD Million)
- TABLE 208 MEA data center GPU market, by deployment model, 2024 - 2032 (USD Million)
- TABLE 209 MEA data center GPU market, by function, 2018 - 2022 (USD Million)
- TABLE 210 MEA data center GPU market, by function, 2024 - 2032 (USD Million)
- TABLE 211 MEA data center GPU market, by end user, 2018 - 2022 (USD Million)
- TABLE 212 MEA data center GPU market, by end user, 2024 - 2032 (USD Million)
- TABLE 213 UAE data center GPU market, 2018 - 2023 (USD Million)
- TABLE 214 UAE data center GPU market, 2024 - 2032 (USD Million)
- TABLE 215 UAE data center GPU market, by deployment model, 2018 - 2022 (USD Million)
- TABLE 216 UAE data center GPU market, by deployment model, 2024 - 2032 (USD Million)
- TABLE 217 UAE data center GPU market, by function, 2018 - 2022 (USD Million)
- TABLE 218 UAE data center GPU market, by function, 2024 - 2032 (USD Million)
- TABLE 219 UAE data center GPU market, by end user, 2018 - 2022 (USD Million)
- TABLE 220 UAE data center GPU market, by end user, 2024 - 2032 (USD Million)
- TABLE 221 Saudi Arabia data center GPU market, 2018 - 2023 (USD Million)
- TABLE 222 Saudi Arabia data center GPU market, 2024 - 2032 (USD Million)
- TABLE 223 Saudi Arabia data center GPU market, by deployment model, 2018 - 2022 (USD Million)
- TABLE 224 Saudi Arabia data center GPU market, by deployment model, 2024 - 2032 (USD Million)
- TABLE 225 Saudi Arabia data center GPU market, by function, 2018 - 2022 (USD Million)
- TABLE 226 Saudi Arabia data center GPU market, by function, 2024 - 2032 (USD Million)
- TABLE 227 Saudi Arabia data center GPU market, by end user, 2018 - 2022 (USD Million)
- TABLE 228 Saudi Arabia data center GPU market, by end user, 2024 - 2032 (USD Million)
- TABLE 229 South Africa data center GPU market, 2018 - 2023 (USD Million)
- TABLE 230 South Africa data center GPU market, 2024 - 2032 (USD Million)
- TABLE 231 South Africa data center GPU market, by deployment model, 2018 - 2022 (USD Million)
- TABLE 232 South Africa data center GPU market, by deployment model, 2024 - 2032 (USD Million)
- TABLE 233 South Africa data center GPU market, by function, 2018 - 2022 (USD Million)
- TABLE 234 South Africa data center GPU market, by function, 2024 - 2032 (USD Million)
- TABLE 235 South Africa data center GPU market, by end user, 2018 - 2022 (USD Million)
- TABLE 236 South Africa data center GPU market, by end user, 2024 - 2032 (USD Million)
Charts & Figures
- FIG 1 GMI's report coverage in the global data center GPU market
- FIG 2 Industry segmentation
- FIG 3 Forecast calculation
- FIG 4 Profile break-up of primary respondents
- FIG 5 Data center GPU market 360 degree synopsis, 2018 - 2032
- FIG 6 Data center GPU ecosystem analysis
- FIG 7 Profit margin analysis
- FIG 8 Growth potential analysis
- FIG 9 Porter's analysis
- FIG 10 PESTEL analysis
- FIG 11 Competitive analysis of major market players, 2023
- FIG 12 Competitive positioning matrix
- FIG 13 Strategic outlook matrix
- FIG 14 Data center GPU market, by deployment model, 2023 & 2032
- FIG 15 Data center GPU market, by function, 2023 & 2032
- FIG 16 Data center GPU market, by end user, 2023 & 2032
- FIG 17 SWOT analysis, Advanced Micro Devices, Inc
- FIG 18 SWOT analysis, Advantech Co., Ltd.
- FIG 19 SWOT analysis, Apple Inc.
- FIG 20 SWOT analysis, Arm Ltd.
- FIG 21 SWOT analysis, GIGABYTE Technology Co., Ltd.
- FIG 22 SWOT analysis, Google Inc.
- FIG 23 SWOT analysis, Graphcore
- FIG 24 SWOT analysis, Huawei Technologies Co., Ltd.
- FIG 25 SWOT analysis, Imagination Technologies
- FIG 26 SWOT analysis, Intel Corporation
- FIG 27 SWOT analysis, IBM Corporation
- FIG 28 SWOT analysis, Microchip Technology Inc.
- FIG 29 SWOT analysis, Micron Technology, Inc.
- FIG 30 SWOT analysis, Microsoft Corporation
- FIG 31 SWOT analysis, Nimbix, Inc.
- FIG 32 SWOT analysis, NVIDIA Corporation
- FIG 33 SWOT analysis, Penguin Computing, Inc
- FIG 34 SWOT analysis, Qualcomm Technologies, Inc.
- FIG 35 SWOT analysis, Samsung Electronics Co., Ltd.
- FIG 36 SWOT analysis, ZOTAC Technology Ltd.
Data Center GPU Market is anticipated to register a CAGR of over 28.5% between 2024 and 2032, driven by the increasing demand for high-performance computing (HPC) and data-intensive applications. GPUs excel at processing tasks, making them ideal for handling complex computations in fields including AI, ML, and scientific research. In December 2023, IIT Bhubaneswar, India, established a new AI and HPC Research Center (AHRC) to conduct interdisciplinary and collaborative research in the fields of AI and High-Performance Computing.
Cloud service providers leverage GPUs to enhance the processing power of virtual machines, enabling them to cater to diverse workloads efficiently. This is particularly prominent as businesses across sectors shift towards cloud-based solutions, further fueling the demand for powerful GPU setups in data centers.
Data center GPU industry is classified based on deployment model, function, end user, and region.
Inference segment is slated to witness substantial growth during 2024-2032, owing to the increasing deployment of artificial intelligence (AI) applications, particularly in fields such as image recognition, natural language processing, and autonomous systems. The emphasis on inference capabilities, where pre-trained models make real-time decisions, contributed to the industry growth.
As per end user scope, government segment is predicted to witness decent growth through 2032, due to the increasing reliance on advanced computing technologies for data-intensive applications. Government agencies are increasingly relying on data center GPUs to enhance capabilities in areas such as data analytics, simulation, and cybersecurity. The ever-increasing volume of data generated, and the subsequent need to process it while ensuring data security will bolster the segment share.
Europe data centers GPU industry is poised to generate revenues over the forecast period, backed by increasing emphasis on sustainability and energy efficiency in data centers. The rising adoption of GPU-accelerated applications in industries such as healthcare, finance, and manufacturing, along with the innovation and digital transformation, contribute to the market expansion in Europe.
Table of Contents
Chapter 1 Methodology & Scope
- 1.1 Market scope & definition
- 1.2 Base estimates & calculations
- 1.3 Forecast calculation
- 1.4 Data sources
- 1.4.1 Primary
- 1.4.2 Secondary
- 1.4.2.1 Paid sources
- 1.4.2.2 Public sources
Chapter 2 Executive Summary
- 2.1 Data center GPU market 360 degree synopsis, 2018 - 2032
- 2.2 Business trends
- 2.2.1 Total Addressable Market (TAM), 2024-2032
- 2.3 Regional trends
- 2.4 Deployment model trends
- 2.5 Function trends
- 2.6 End user trends
Chapter 3 Data Center GPU Industry Insights
- 3.1 Industry ecosystem analysis
- 3.2 Supplier Landscape
- 3.2.1 Raw material and component suppliers
- 3.2.2 Manufacturers
- 3.2.3 Software and Technology providers
- 3.2.4 Service providers
- 3.2.5 End user
- 3.3 Profit margin analysis
- 3.4 Technology & innovation landscape
- 3.5 Patent analysis
- 3.6 Key news and initiatives
- 3.6.1 Partnership/Collaboration
- 3.6.2 Merger/Acquisition
- 3.6.3 Investment
- 3.6.4 Deployment model launch & innovation
- 3.7 Regulatory landscape
- 3.8 Impact forces
- 3.8.1 Growth drivers
- 3.8.1.1 Rising demand for AI and machine learning
- 3.8.1.2 Emergence of edge computing
- 3.8.1.3 Advancements in data visualization and rendering
- 3.8.1.4 Parallel processing for scientific research
- 3.8.2 Industry pitfalls & challenges
- 3.8.2.1 High initial costs
- 3.8.2.2 Power consumption and cooling requirements
- 3.8.1 Growth drivers
- 3.9 Growth potential analysis
- 3.10 Porter's analysis
- 3.11 PESTEL analysis
Chapter 4 Competitive Landscape, 2023
- 4.1 Introduction
- 4.2 Company market share, 2023
- 4.3 Competitive analysis of major market players, 2023
- 4.3.1 NVIDIA Corporation
- 4.3.2 Intel Corporation
- 4.3.3 Advanced Micro Devices, Inc
- 4.3.4 Samsung Electronics Co., Ltd.
- 4.3.5 Huawei Technologies Co., Ltd.
- 4.3.6 Advantech Co., Ltd.
- 4.4 Competitive positioning matrix, 2023
- 4.5 Strategic outlook matrix, 2023
Chapter 5 Data Center GPU Market Estimates & Forecast, By Deployment Model (Revenue)
- 5.1 Key trends, by deployment model
- 5.2 On-premises
- 5.3 Cloud
Chapter 6 Data Center GPU Market Estimates & Forecast, By Function (Revenue)
- 6.1 Key trends, by function
- 6.2 Training
- 6.3 Inference
Chapter 7 Data Center GPU Market Estimates & Forecast, By End user (Revenue)
- 7.1 Key trends, by end user
- 7.2 Cloud service providers
- 7.3 Enterprises
- 7.4 Government
Chapter 8 Data Center GPU Market Estimates & Forecast, By Region (Revenue)
- 8.1 Key trends, by region
- 8.2 North America
- 8.2.1 U.S.
- 8.2.2 Canada
- 8.3 Europe
- 8.3.1 UK
- 8.3.2 Germany
- 8.3.3 France
- 8.3.4 Italy
- 8.3.5 Spain
- 8.3.6 Nordics
- 8.4 Asia Pacific
- 8.4.1 China
- 8.4.2 India
- 8.4.3 Japan
- 8.4.4 Australia
- 8.4.5 South Korea
- 8.4.6 Singapore
- 8.5 Latin America
- 8.5.1 Brazil
- 8.5.2 Mexico
- 8.5.3 Argentina
- 8.6 MEA
- 8.6.1 UAE
- 8.6.2 Saudi Arabia
- 8.6.3 South Africa
Chapter 9 Company Profiles
- 9.1 Advanced Micro Devices, Inc
- 9.2 Advantech Co., Ltd.
- 9.3 Apple Inc.
- 9.4 Arm Ltd.
- 9.5 GIGABYTE Technology Co., Ltd.
- 9.6 Google Inc.
- 9.7 Graphcore
- 9.8 Huawei Technologies Co., Ltd.
- 9.9 Imagination Technologies
- 9.10 Intel Corporation
- 9.11 IBM Corporation
- 9.12 Microchip Technology Inc.
- 9.13 Micron Technology, Inc.
- 9.14 Microsoft Corporation
- 9.15 Nimbix, Inc.
- 9.16 NVIDIA Corporation
- 9.17 Penguin Computing, Inc
- 9.18 Qualcomm Technologies, Inc.
- 9.19 Samsung Electronics Co., Ltd.
- 9.20 ZOTAC Technology Ltd.
