|
|
市場調査レポート
商品コード
1732570
アジア太平洋のデータセンター向けGPU市場:用途別、製品別、国別 - 分析と予測(2024年~2034年)Asia-Pacific Data Center GPUs Market: Focus on Application, Product, and Country - Analysis and Forecast, 2024-2034 |
||||||
|
|||||||
カスタマイズ可能
|
|||||||


| アジア太平洋のデータセンター向けGPU市場:用途別、製品別、国別 - 分析と予測(2024年~2034年) |
|
出版日: 2025年05月23日
発行: BIS Research
ページ情報: 英文 64 Pages
納期: 1~5営業日
|

全表示
- 概要
- 図表
- 目次
アジア太平洋のデータセンター向けGPUの市場規模は、2024年の67億米ドルから2034年には446億米ドルに達し、予測期間の2024年~2034年のCAGRは20.80%になると予測されています。
アジア太平洋では、AI、ディープラーニング、ビッグデータ解析を動力源とするハイパフォーマンス・コンピューティングの需要が急増しており、複雑なタスクに特化した「主力」としてGPUの採用に拍車がかかっています。メモリ容量、処理能力、電力効率の向上が成長を加速させています。GPUベンダーとクラウドプロバイダーの協業、ハイパースケールデータセンターの拡張がサプライチェーンの強靭性を強化する一方、R&D投資がスケーラブルなデジタルエコシステムのための持続可能でコンプライアンスに準拠したイノベーションを推進しています。
| 主要市場統計 | |
|---|---|
| 予測期間 | 2024年~2034年 |
| 2024年の評価額 | 67億米ドル |
| 2034年の予測 | 446億米ドル |
| CAGR | 20.8% |
アジア太平洋のデータセンター向けGPU産業は、同地域の企業が競ってグラフィックス・プロセッシング・ユニット(GPU)の並列処理能力を利用するため、画期的なスピードで拡大しています。以前はグラフィックのレンダリングに限られていたGPUは、ビッグデータ分析、ハイパフォーマンス・コンピューティング(HPC)、機械学習(ML)、人工知能(AI)などの計算集約的なタスクを高速化するために不可欠なツールとなっています。アジア太平洋では、金融、ヘルスケア、製造、eコマース、公共サービスなどの分野で急速な産業のデジタル変革が進んでおり、リアルタイム推論、大規模言語モデルの学習、困難な科学的・工学的問題のシミュレーションを可能にするGPUアクセラレーション・インフラストラクチャに対するかつてないニーズが生まれています。
世界リーダーや新興の地域ベンダーを含む主要な市場参入企業は、クラウドサービスプロバイダやシステムインテグレータとの戦略的提携を通じて、その勢力を拡大しています。仮想化GPUインスタンスは、AWS、Microsoft Azure、Google Cloud、Alibaba Cloud、Tencent Cloudなどのパブリッククラウドプラットフォームによって導入され、企業が従量課金制で高性能コンピューティングを利用できるようになっています。一方、ハイパースケーラ、学術機関、大手企業では、予測可能なワークロードやデータ保全のニーズに特化したGPUクラスタを求めており、オンプレミスでの導入が増加しています。
アジア太平洋のインフラ動向は、効率と性能の両方に影響されています。高密度ラックの理想的な熱プロファイルを維持するために、液浸やチップに直接接続するコールドプレートなどの最先端の冷却技術が、メモリ帯域幅の増加、AI行列演算用のテンソルコア、混合精度コンピューティングを提供するGPUアーキテクチャの進歩と組み合わせて使用されています。同時に、分解可能でコンポーザブルなGPUファブリックの出現により、アクセラレータ・リソースの動的なプーリングが可能になり、利用率が向上し、総所有コストが削減されます。
GPU駆動型データセンターへの投資は、シンガポールのグリーンデータセンター助成金、韓国のデジタル・ニューディール、インドの国家AIミッション、中国の「新インフラ」計画など、政府のイニシアティブやインセンティブプログラムによって刺激されています。これらの規制は、次世代GPU設計、ソフトウェアツールチェーン、管理プラットフォームの研究開発を加速させ、AI企業へのベンチャーキャピタル投資を増加させています。アジア太平洋は、企業や公共部門がGPUの導入を拡大し続けていることから、経済成長と技術的リーダーシップの両方を推進し、GPUによるイノベーションを加速させる世界の中心地になると位置付けられています。
アジア太平洋データセンターGPU市場動向と促進要因・課題
動向
- AIに最適化されたGPU(NVIDIA Blackwell、AMD MI300)がジェネレーティブAIやLLMトレーニングに急速に普及
- 柔軟なリソース・プールを可能にする分散型およびコンポーザブルGPUアーキテクチャ
- アジア太平洋のパブリック・クラウド(AWS、Azure、GCP)における仮想化GPUインスタンスの増加
- 局所的推論のためのエッジおよび地域PoPにおける「マイクロクラスター」の展開
- 電力密度の上昇を管理するための液冷および液浸冷却GPUラックの使用の増加
促進要因
- 金融、ヘルスケア、製造業におけるAI/MLワークロードの爆発的需要
- 国家AI戦略(中国のAI 2.0ロードマップ、インドのAIミッションなど)がデータセンターのアップグレードを促進
- GPU-as-a-ServiceやハイブリッドクラウドGPUソリューションを提供するクラウドプロバイダーのアジア太平洋への進出
- 科学研究やデジタルツイン向けのハイパフォーマンス・コンピューティング(HPC)の成長
- 企業のデジタルトランスフォーメーションとリアルタイム分析活用への競合圧力
課題
- 消費電力と冷却要件の急増別OPEXの上昇
- 世界なGPU供給の制約と次世代アクセラレータの長いリードタイム
- 高密度GPU導入のための高額な資本支出とROIのプレッシャー
- GPUアクセラレーション・システムの設計、導入、運用における人材不足
- 集中型GPUファームの導入を複雑化するデータ主権と国境を越えたコンプライアンス
当レポートでは、アジア太平洋のデータセンター向けGPU市場について調査し、市場の概要とともに、用途別、製品別、国別の動向、および市場に参入する企業のプロファイルなどを提供しています。
目次
エグゼクティブサマリー
第1章 市場
- データセンターの動向:現状と将来への影響評価
- データセンターの容量:現状と将来
- AIワークロードと従来のワークロード
- データセンターの電力消費シナリオ
- 注目すべき主要国
- その他の産業動向
- データセンター冷却市場概要
- 世界および地域の市場規模
- 冷却の導入(データセンターの築年数別)
- 改修およびブラウンフィールドプロジェクト
- グリーンフィールドプロジェクトと新規設備
- 冷却装置の導入に関する実績分析(2018年~2022年)
- 2023~2027年におけるデータセンターの冷却技術導入動向
- AI導入によるデータセンター冷却インフラへの影響
- 研究開発レビュー
- ステークホルダー分析
- 使用事例
- エンドユーザーと購入基準
- 市場力学の概要
- 市場促進要因
- 市場抑制要因
- 市場機会
第2章 地域
- 地域サマリー
- アジア太平洋
- 地域概要
- 市場成長促進要因
- 市場成長抑制要因
- 応用
- 製品
- アジア太平洋(国別)
第3章 市場-競合ベンチマーキングと企業プロファイル
- 企業プロファイル
第4章 調査手法
List of Figures
- Figure 1: Asia-Pacific Data Center GPUs Market (by Scenario), $Billion, 2023, 2027, and 2034
- Figure 2: Asia-Pacific Data Center GPUs Market (by Application), $Million, 2023, 2027, and 2034
- Figure 3: Asia-Pacific Data Center GPUs Market (by Product), $Million, 2023, 2027, and 2034
- Figure 4: Key Events
- Figure 5: Estimated Increase in Data Center Capacity, 2023 and 2030, GW
- Figure 6: Comparison between Conventional and AI Workloads
- Figure 7: Key Energy Consuming Industries (by Independent System Operators in U.S.)
- Figure 8: HPC Cluster Developments in the Data Center Market
- Figure 9: Share of Total 5G Mobile Connections (by Region) 2023 and 2030
- Figure 10: Historical Analysis: Estimated Number of Cooling Deployed Data Centers Globally, 2018-2022
- Figure 11: Future Market Analysis: Cooling Expected Deployment in New Data Centers (by Number of Data Centers), 2023-2027
- Figure 12: Energy Consumption Breakdown in AI Data Centers
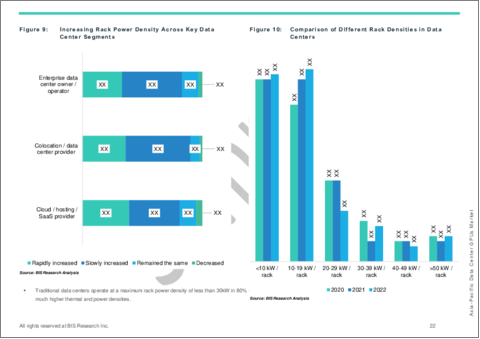
- Figure 13: Increasing Rack Power Density Across Key Data Center Segments
- Figure 14: Comparison of Different Rack Densities in Data Centers
- Figure 15: Patent Analysis (by Country), January 2021-January 2025
- Figure 16: Patent Analysis (by Company), January 2021-January 2025
- Figure 17: End User and Buying Criteria in the Data Center GPUs Market
- Figure 18: Dynamics of Data Generation, Replication, and Utilization, 2019-2023
- Figure 19: China Data Center GPUs Market, $Billion, 2023-2034
- Figure 20: Japan Data Center GPUs Market, $Billion, 2023-2034
- Figure 21: Australia Data Center GPUs Market, $Billion, 2023-2034
- Figure 22: India Data Center GPUs Market, $Billion, 2023-2034
- Figure 23: South Korea Data Center GPUs Market, $Billion, 2023-2034
- Figure 24: Rest-of-Asia-Pacific Data Center GPUs Market, $Billion, 2023-2034
- Figure 25: Data Triangulation
- Figure 26: Top-Down and Bottom-Up Approach
- Figure 27: Assumptions and Limitations
List of Tables
- Table 1: Market Snapshot
- Table 2: Opportunities across Region
- Table 3: Trends Overview
- Table 4: Data Center Liquid Cooling Market (by Region), $Billion, 2023-2034
- Table 5: Adoption of Cooling by Data Center Age along with PUE
- Table 6: Data Center GPUs Market (by Region), $Billion, 2023-2034
- Table 7: Asia-Pacific Data Center GPUs Market (by Application), $Billion, 2023-2034
- Table 8: Asia-Pacific Data Center GPUs Market (by Product), $Billion, 2023-2034
- Table 9: China Data Center GPUs Market (by Application), $Billion, 2023-2034
- Table 10: China Data Center GPUs Market (by Product), $Billion, 2023-2034
- Table 11: Japan Data Center GPUs Market (by Application), $Billion, 2023-2034
- Table 12: Japan Data Center GPUs Market (by Product), $Billion, 2023-2034
- Table 13: Australia Data Center GPUs Market (by Application), $Billion, 2023-2034
- Table 14: Australia Data Center GPUs Market (by Product), $Billion, 2023-2034
- Table 15: India Data Center GPUs Market (by Application), $Billion, 2023-2034
- Table 16: India Data Center GPUs Market (by Product), $Billion, 2023-2034
- Table 17: South Korea Data Center GPUs Market (by Application), $Billion, 2023-2034
- Table 18: South Korea Data Center GPUs Market (by Product), $Billion, 2023-2034
- Table 19: Rest-of-Asia-Pacific Data Center GPUs Market (by Application), $Billion, 2023-2034
- Table 20: Rest-of-Asia-Pacific Data Center GPUs Market (by Product), $Billion, 2023-2034
Introduction to Asia-Pacific Data Center GPUs Market
The Asia-Pacific data center GPUs market is projected to reach $44.6 billion by 2034 from $6.7 billion in 2024, growing at a CAGR of 20.80% during the forecast period 2024-2034. In APAC, surging demand for high-performance computing-powered by AI, deep learning, and big-data analytics-is fueling GPU adoption as specialized "workhorses" for complex tasks. Advances in memory capacity, processing power, and power-efficiency are accelerating growth. Collaborations between GPU vendors and cloud providers, plus hyperscale data-center expansion, are bolstering supply-chain resilience, while R&D investment drives sustainable, compliant innovations for a scalable digital ecosystem.
Market Introduction
| KEY MARKET STATISTICS | |
|---|---|
| Forecast Period | 2024 - 2034 |
| 2024 Evaluation | $6.7 Billion |
| 2034 Forecast | $44.6 Billion |
| CAGR | 20.8% |
The data-center GPU industry in Asia-Pacific (APAC) is expanding at a revolutionary rate as businesses in the region compete to use graphics processing units' (GPUs') parallel processing capabilities. Previously limited to graphic rendering, GPUs have become essential tools for speeding up compute-intensive tasks like big data analytics, high-performance computing (HPC), machine learning (ML), and artificial intelligence (AI). Rapid industry digital transformation in APAC, including in the fields of finance, healthcare, manufacturing, e-commerce, and public services, is creating an unprecedented need for GPU-accelerated infrastructure that can power real-time inference, train large language models, and simulate challenging scientific and engineering problems.
Key market players, including global leaders and rising regional vendors, are increasing their reach through strategic alliances with cloud service providers and system integrators. Virtualised GPU instances are being introduced by public-cloud platforms such as AWS, Microsoft Azure, Google Cloud, Alibaba Cloud, and Tencent Cloud, allowing businesses to use high-performance computing on a pay-as-you-go basis. In the meantime, hyperscalers, academic institutions, and major corporations looking for specialised GPU clusters for predictable workloads and data-sovereignty needs are increasingly adopting on-premises deployments.
APAC's infrastructure trends are influenced by both efficiency and performance. In order to maintain ideal thermal profiles in high-density racks, cutting-edge cooling techniques like liquid immersion and direct-to-chip cold plates are used in conjunction with advancements in GPU architectures, which provide increased memory bandwidth, tensor cores for AI matrix operations, and mixed-precision computing. Simultaneously, the emergence of disaggregated and composable GPU fabrics allows for dynamic accelerator resource pooling, increasing utilisation rates and reducing total cost of ownership.
Investments in GPU-driven data centres are being stimulated by government initiatives and incentive programs, including Singapore's Green Data Centre Grant, South Korea's Digital New Deal, India's National AI Mission, and China's ""New Infrastructure"" plan. These regulations are speeding up research and development of next-generation GPU designs, software toolchains, and management platforms, as well as increasing venture capital investments in AI firms. APAC is positioned to become a global centre for GPU-accelerated innovation, propelling both economic growth and technological leadership, as businesses and public sector entities continue to boost GPU deployments.
Market Segmentation
Segmentation 1: Data Center GPUs Market (by Application)
- Hyperscale
- Colocation
- Enterprise
- Others
Segmentation 2: Data Center GPUs Market (by Product)
- Conventional GPUs
- Accelerated GPUs
Segmentation 3: Data Center GPUs Market (by Country)
- Japan
- India
- China
- Australia
- South Korea
- Rest-of-Asia-Pacific
APAC Data Center GPUs Market Trends, Drivers and Challenges
Trends
- Rapid uptake of AI-optimized GPUs (NVIDIA Blackwell, AMD MI300) for generative AI and LLM training
- Disaggregated and composable GPU architectures enabling flexible resource pooling
- Growth of virtualized GPU instances in public clouds (AWS, Azure, GCP) across APAC regions
- Deployment of "micro-clusters" at edge and regional PoPs for localized inference
- Increased use of liquid-cooled and immersion-cooled GPU racks to manage rising power densities
Drivers
- Explosive demand for AI/ML workloads in finance, healthcare, and manufacturing
- National AI strategies (e.g., China's AI 2.0 roadmap, India's AI Mission) fueling data-center upgrades
- Cloud provider expansion into APAC, offering GPU-as-a-Service and hybrid-cloud GPU solutions
- Growth in high-performance computing (HPC) for scientific research and digital twins
- Enterprise digital transformation and competitive pressure to leverage real-time analytics
Challenges
- Skyrocketing power consumption and cooling requirements driving OPEX up
- Global GPU supply constraints and long lead times for next-gen accelerators
- High capital expenditure for dense GPU deployments, with ROI pressure
- Talent shortages in GPU-accelerated systems design, deployment, and operations
- Data-sovereignty and cross-border compliance complicating centralized GPU farm deployments
Table of Contents
Executive Summary
Scope and Definition
1 Markets
- 1.1 Data Center Trends: Current and Future Impact Assessment
- 1.1.1 Data Center Capacities: Current and Future
- 1.1.2 AI Workloads vs. Conventional Workloads
- 1.1.3 Data Center Power Consumption Scenario
- 1.1.4 Key Countries to Focus
- 1.1.5 Other Industrial Trends
- 1.1.5.1 HPC Cluster Developments
- 1.1.5.2 Blockchain Initiatives
- 1.1.5.3 Super Computing
- 1.1.5.4 5G and 6G Developments
- 1.1.5.5 Impact of Server/Rack Density
- 1.2 Data Center Cooling Market Overview
- 1.2.1 Global and Regional Market size
- 1.2.2 Adoption of Cooling (by Data Center Age)
- 1.2.3 Retrofitting and Brownfield Projects
- 1.2.4 Green Field Projects and New Installation
- 1.2.5 Historical Analysis of Cooling Equipment Deployment, 2018-2022
- 1.2.6 New Data Center Trends toward Adoption of Cooling Technology Type, 2023-2027
- 1.2.7 Impact of AI Adoption on Data Center Cooling Infrastructure
- 1.3 Research and Development Review
- 1.3.1 Patent Filing Trend (by Country, by Company)
- 1.4 Stakeholder Analysis
- 1.4.1 Use Case
- 1.4.2 End User and Buying Criteria
- 1.5 Market Dynamics Overview
- 1.5.1 Market Drivers
- 1.5.1.1 Surging Demand for Cryptocurrency Mining
- 1.5.1.2 Rising Enterprise Adoption of Data Center GPUs for High-Performance Computing Applications
- 1.5.2 Market Restraints
- 1.5.2.1 High Bargaining Power of GPU Manufacturers
- 1.5.3 Market Opportunities
- 1.5.3.1 Technological Advancement in High-Performing Computing (HPC)
- 1.5.3.2 Government Support for Smart City Development and Digitalization
- 1.5.1 Market Drivers
2 Regions
- 2.1 Regional Summary
- 2.2 Asia-Pacific
- 2.2.1 Regional Overview
- 2.2.2 Driving Factors for Market Growth
- 2.2.3 Factors Challenging the Market
- 2.2.4 Application
- 2.2.5 Product
- 2.2.6 Asia-Pacific (by Country)
- 2.2.6.1 China
- 2.2.6.1.1 Application
- 2.2.6.1.2 Product
- 2.2.6.2 Japan
- 2.2.6.2.1 Application
- 2.2.6.2.2 Product
- 2.2.6.3 Australia
- 2.2.6.3.1 Application
- 2.2.6.3.2 Product
- 2.2.6.4 India
- 2.2.6.4.1 Application
- 2.2.6.4.2 Product
- 2.2.6.5 South Korea
- 2.2.6.5.1 Application
- 2.2.6.5.2 Product
- 2.2.6.6 Rest-of-Asia-Pacific
- 2.2.6.6.1 Application
- 2.2.6.6.2 Product
- 2.2.6.1 China
3 Markets - Competitive Benchmarking and Company Profiles
- 3.1 Company Profiles
- 3.1.1.1 Huawei Technologies Co., Ltd.
- 3.1.1.1.1 Overview
- 3.1.1.1.2 Top Products/Product Portfolio
- 3.1.1.1.3 Top Competitors
- 3.1.1.1.4 Target Customers/End Users
- 3.1.1.1.5 Key Personnel
- 3.1.1.1.6 Analyst View
- 3.1.1.2 Alibaba
- 3.1.1.2.1 Overview
- 3.1.1.2.2 Top Products/Product Portfolio
- 3.1.1.2.3 Top Competitors
- 3.1.1.2.4 Target Customers/End Users
- 3.1.1.2.5 Key Personnel
- 3.1.1.2.6 Analyst View
- 3.1.1.1 Huawei Technologies Co., Ltd.
4 Research Methodology
- 4.1 Data Sources
- 4.1.1 Primary Data Sources
- 4.1.2 Secondary Data Sources
- 4.1.3 Data Triangulation
- 4.2 Market Estimation and Forecast
