
|
市場調査レポート
商品コード
1928941
家禽用プロバイオティクス原料市場における機会、成長要因、業界動向分析、および2026年から2035年までの予測Poultry Probiotic Ingredients Market Opportunity, Growth Drivers, Industry Trend Analysis, and Forecast 2026 - 2035 |
||||||
カスタマイズ可能
|
|||||||
| 家禽用プロバイオティクス原料市場における機会、成長要因、業界動向分析、および2026年から2035年までの予測 |
|
出版日: 2026年01月12日
発行: Global Market Insights Inc.
ページ情報: 英文 210 Pages
納期: 2~3営業日
|

概要
世界の家禽用プロバイオティクス原料市場は、2025年に1億2,630万米ドルと評価され、2035年までにCAGR 6.3%で成長し、2億3,020万米ドルに達すると予測されています。
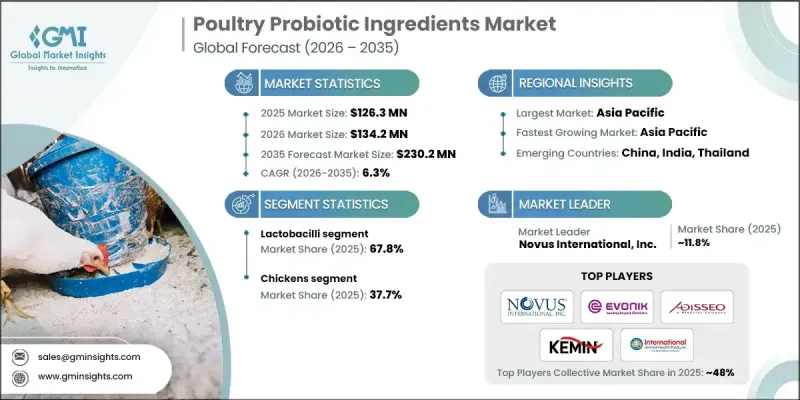
家禽用プロバイオティクス原料は、商業生産において腸内健康の維持、飼料効率の向上、免疫力の強化、および鳥類の総合的な生産性向上を支援する有益な微生物を慎重に配合したものです。これらの原料には、バチルス属、ストレプトコッカス属、ビフィドバクテリウム属、ラクトバチルス属などの菌株やその他のプロバイオティクス微生物が含まれており、病原体の抑制、栄養素の吸収、消化機能の最適化、疾病抵抗性において重要な役割を果たし、抗生物質の自然な代替品として機能します。世界の家禽生産量の増加、抗生物質不使用の飼育手法の普及、プロバイオティクス技術の進歩が、この市場の成長を牽引しております。多菌株配合、先進的な菌株開発、様々な家禽種における生産性最適化への継続的な投資により、世界の需要は堅調に推移し、生産者様には商業用家禽システム全体で、腸内定着性の向上、病原体抑制力の強化、飼料要求率の改善、免疫応答の最適化といったメリットがもたらされます。
| 市場範囲 | |
|---|---|
| 開始年 | 2025年 |
| 予測年度 | 2026-2035 |
| 開始時価値 | 1億2,630万米ドル |
| 予測金額 | 2億3,020万米ドル |
| CAGR | 6.3% |
乳酸菌セグメントは67.8%のシェアを占め、2035年までCAGR6.2%で成長すると予測されています。その優位性は、優れた腸内定着性、効果的な病原菌抑制、ブロイラー、採卵鶏、種鶏における実証済みの性能に起因しています。乳酸菌は乳酸生成を通じて腸内健康をサポートし、有害な細菌に対する競合的排除を提供するため、商業的な家禽事業において優先的に選ばれるプロバイオティクス菌株となっています。
鶏肉セグメントは37.7%のシェアを占め、2035年までCAGR6.6%で成長すると予測されています。これは、肉用・卵用を問わず、世界の家禽生産において鶏が圧倒的な存在感を示していることに起因します。本セグメントは、確立されたプロバイオティクスプロトコル、生産段階全体にわたる検証済み調査、ならびに飼料要求率の改善、死亡率の低減、総合生産性の向上による測定可能な投資利益率(ROI)の恩恵を受けています。
米国国家禽プロバイオティクス原料市場は2025年に3,120万米ドル規模に達しました。北米における成長は、商業ブロイラー事業における腸内環境最適化への強い需要、抗生物質不使用養殖向けの多菌株プロバイオティクス、生産効率向上のための先進的なプロバイオティクスプログラムを導入した統合型採卵事業によって牽引されています。
よくあるご質問
目次
第1章 調査手法と範囲
第2章 エグゼクティブサマリー
第3章 業界考察
- エコシステム分析
- サプライヤーの情勢
- 利益率
- 各段階における付加価値
- バリューチェーンに影響を与える要因
- ディスラプション
- 業界への影響要因
- 促進要因
- 業界の潜在的リスク&課題
- 市場機会
- 成長可能性分析
- 規制情勢
- 北米
- 欧州
- アジア太平洋地域
- ラテンアメリカ
- 中東・アフリカ
- ポーターの分析
- PESTEL分析
- 技術とイノベーションの動向
- 現在の技術動向
- 新興技術
- 価格動向
- 地域別
- 製品グレード別
- 将来の市場動向
- 技術とイノベーションの動向
- 現在の技術動向
- 新興技術
- 特許動向
- 貿易統計(HSコード)(注:貿易統計は主要国のみ提供されます)
- 主要輸入国
- 主要輸出国
- 持続可能性と環境面
- 持続可能な取り組み
- 廃棄物削減戦略
- 生産におけるエネルギー効率
- 環境に配慮した取り組み
- カーボンフットプリントへの配慮
第4章 競合情勢
- イントロダクション
- 企業の市場シェア分析
- 地域別
- 北米
- 欧州
- アジア太平洋地域
- ラテンアメリカ
- 中東・アフリカ地域
- 地域別
- 企業マトリクス分析
- 主要市場企業の競合分析
- 競合ポジショニングマトリックス
- 主な発展
- 合併・買収
- 提携・協業
- 新製品の発売
- 拡大計画
第5章 市場推計・予測:製品別、2022-2035
- 乳酸菌ラクトバチルス属
- L.アシドフィルス
- L.プランタラム
- L. reuteri
- L. salivarius
- その他
- ビフィズス菌
- ビフィドバクテリウム属/ビフィドバクテリウム・ビフィダム/ビフィドバクテリウム・ロンガム
- B.ロングム
- B.アニマリス
- その他
- 連鎖球菌
- S. thermophilus
- エンテロコッカス・フェシウム
- バチルス属
- 枯草菌
- B. licheniformis
- B.アミロリケファシエンス
- その他
- その他
第6章 市場推計・予測:用途別、2022-2035
- 鶏
- ブロイラー
- 採卵鶏
- 種鶏
- トルコ
- アヒル
- ガチョウ
- その他
第7章 市場推計・予測:地域別、2022-2035
- 北米
- 米国
- カナダ
- 欧州
- ドイツ
- 英国
- フランス
- スペイン
- イタリア
- その他欧州地域
- アジア太平洋地域
- 中国
- インド
- 日本
- オーストラリア
- 韓国
- その他アジア太平洋地域
- ラテンアメリカ
- ブラジル
- メキシコ
- アルゼンチン
- その他ラテンアメリカ地域
- 中東・アフリカ
- サウジアラビア
- 南アフリカ
- アラブ首長国連邦
- その他中東・アフリカ地域
第8章 企業プロファイル
- Novonesis(formerly Chr. Hansen)
- Novus International
- Biomin Holding GmbH
- Evonik Industries AG
- Adisseo France SAS
- Huvepharma AD
- Kemin Industries
- International Animal Health Products
- Pic-Bio, Inc.
- Neospark
- Lallemand Animal Nutrition
- Alltech
- Arm &Hammer Animal Nutrition

