
|
市場調査レポート
商品コード
1755331
BaaS(Banking-as-a-Service)市場:市場機会、成長促進要因、産業動向分析、将来予測(2025~2034年)Banking as a Service Market Opportunity, Growth Drivers, Industry Trend Analysis, and Forecast 2025 - 2034 |
||||||
カスタマイズ可能
|
|||||||
| BaaS(Banking-as-a-Service)市場:市場機会、成長促進要因、産業動向分析、将来予測(2025~2034年) |
|
出版日: 2025年05月21日
発行: Global Market Insights Inc.
ページ情報: 英文 190 Pages
納期: 2~3営業日
|

全表示
- 概要
- 目次
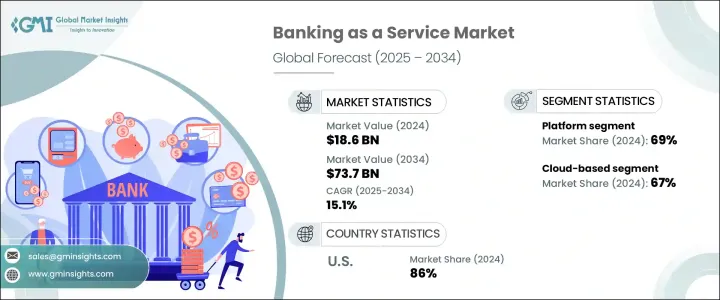
世界のBaaS(Banking-as-a-Service)市場は、2024年に186億米ドルと評価され、組み込み型金融サービスへのニーズの高まり、フィンテックソリューションの採用拡大、伝統的な銀行システムのデジタル変革の進行に起因して、CAGR 15.1%で成長し、2034年には737億米ドルに達すると推定されています。
BaaSは、サードパーティのプラットフォームがAPIを通じて、決済、融資、口座管理などのバンキング・サービスを自社のサービスに直接統合することを可能にします。この統合により、業務が効率化され、顧客体験が大幅に向上します。
消費者がシームレスでオンデマンドな金融サービスをますます求めるようになる中、BaaSはこのニーズに応える理想的なソリューションとして台頭してきています。BaaSによって、ノンバンクのプラットフォームは、従来のバンキングインフラ構築の複雑さを最小限に抑えながら、幅広いバンキング機能を提供できるようになります。クラウド・コンピューティング、人工知能、高度なデータ分析の導入による銀行のDXが、この市場成長の主な触媒となっています。銀行は、BaaSサービスの効率的な統合を促進するためにシステムの近代化を進めており、フィンテック企業やその他のサードパーティプロバイダーは、顧客体験の向上を確保しながら、オーダーメイドの金融サービスを提供できるようになっています。
| 市場範囲 | |
|---|---|
| 開始年 | 2024年 |
| 予測期間 | 2025~2034年 |
| 当初の市場規模 | 186億米ドル |
| 市場規模予測 | 737億米ドル |
| CAGR | 15.1% |
プラットフォーム分野は2024年に69%のシェアを占め、2034年までCAGR 15%で成長し続けます。BaaSプラットフォームは、金融サービスをノンバンクのアプリケーションに統合するための堅牢なインフラを提供し、フィンテック、ネオバンク、その他のサードパーティプロバイダーに拡張性と柔軟性のあるソリューションを提供します。これらのプラットフォームは、決済、口座開設、コンプライアンスなどのコア・バンキング機能へのアクセスを簡素化するAPIを提供します。
クラウドベースのBaaS(Banking-as-a-Service)プラットフォーム・セグメントは、2024年に67%のシェアを占めました。この優位性は今後も続き、2034年までのCAGRは15.5%と堅調な成長が見込まれています。クラウドモデルには、金融テクノロジー企業や伝統的な銀行にとって非常に魅力的な利点があります。そのスケーラビリティと柔軟性により、多くの場合、物理的なインフラに多額の先行投資をすることなく、急速に事業を拡大し、サービス提供を拡大することができます。
米国のBaaS(Banking-as-a-Service) 2024年の市場シェアは、組み込み型金融サービスに対する需要の高まりに牽引され86%を占めています。米国の銀行はBaaSプラットフォームを活用し、デジタルサービスの改善、顧客エンゲージメントの強化、商品開発の効率化を図っています。伝統的な金融機関とフィンテック企業のパートナーシップは、ダイナミックな金融エコシステムを育み、銀行がそのサービスを収益化する一方で、フィンテックが最先端のソリューションを開発することを可能にしています。
世界のBaaS(Banking-as-a-Service)部門の主要企業には、ClearBank Ltd.、Fiserv、Galileo Financial Technologies、Mambu、Marqeta、Railsr、Solaris SE、Green Dot、Plaid、Finastraなどがいます。BaaS(Banking-as-a-Service)市場でより強固な足場を確保するため、各社は大小の金融機関に対応する革新的で柔軟かつスケーラブルなプラットフォームを開発しています。主要企業はまた、フィンテック企業、伝統的な銀行、ハイテク企業と戦略的パートナーシップを結び、サービスの拡充と新市場への参入を図っています。さらに、各社はプラットフォームのセキュリティ、効率性、規制コンプライアンスの強化に多額の投資を行っており、スムーズでシームレスな統合を確保しながら、顧客の多様なニーズに対応できるようにしています。
目次
第1章 分析手法と範囲
第2章 エグゼクティブサマリー
第3章 業界考察
- エコシステム分析
- 業界への影響要因
- 成長可能性分析
- 規制情勢
- トランプ政権による関税
- 貿易への影響
- 業界への影響
- 供給側の影響(原材料)
- 需要側の影響(販売価格)
- 影響を受ける主要企業
- 戦略的な業界対応
- サプライチェーンの再構成
- 価格設定と製品戦略
- 政策関与
- 展望と今後の検討事項
- 将来の市場動向
- ポーターのファイブフォース分析
- PESTEL分析
第4章 競合情勢
- イントロダクション
- 企業の市場シェア分析
- 競合ポジショニング・マトリックス
- 戦略的展望マトリックス
第5章 市場推計・予測:コンポーネント別(2021~2034年)
- 主要動向
- プラットフォーム
- サービス
第6章 市場推計・予測:種類別(2021~2034年)
- 主要動向
- APIベース
- クラウドベース
第7章 市場推計・予測:企業規模別(2021~2034年)
- 主要動向
- 大企業
- 中小企業
第8章 市場推計・予測:用途別(2021~2034年)
- 主要動向
- デジタルバンキング
- 支払い処理
- 貸出
- 銀行コンプライアンス
- アカウントと取引の管理
- カード発行
第9章 市場推計・予測:最終用途別(2021~2034年)
- 主要動向
- 銀行
- NBFC
- その他
第10章 市場推計・予測:地域別(2021~2034年)
- 主要動向
- 北米
- 米国
- カナダ
- 欧州
- 英国
- ドイツ
- フランス
- イタリア
- スペイン
- ロシア
- 北欧諸国
- アジア太平洋地域
- 中国
- インド
- 日本
- 韓国
- オーストラリア・ニュージーランド
- 東南アジア
- ラテンアメリカ
- ブラジル
- メキシコ
- アルゼンチン
- 中東・アフリカ
- アラブ首長国連邦
- サウジアラビア
- 南アフリカ
第11章 企業プロファイル
- Banco Bilbao Vizcaya Argentaria
- Bnkbl Ltd
- ClearBank Ltd
- Cross River Bank
- Finastra
- Fiserv
- Galileo Financial Technologies
- Green Dot
- Mambu
- Marqeta
- MatchMove Pay Pte Ltd
- OpenPayd
- Plaid
- Project Imagine
- Railsr
- Sila
- Solaris SE
- Square, Inc
- Starling Bank
- Treasury Prime
The Global Banking as a Service Market was valued at USD 18.6 billion in 2024 and is estimated to grow at a CAGR of 15.1% to reach USD 73.7 billion by 2034, attributed to the increasing need for embedded financial services, the growing adoption of fintech solutions, and the ongoing digital transformation of traditional banking systems. BaaS allows third-party platforms to integrate banking services, such as payments, lending, and account management, directly into their offerings via APIs. This integration streamlines operations and greatly enhances the customer experience.
As consumers increasingly demand seamless, on-demand financial services, BaaS is emerging as the ideal solution to meet this need. It allows non-bank platforms to offer a wide range of banking features while minimizing the complexities of setting up traditional banking infrastructure. The digital transformation of banks, driven by the adoption of cloud computing, artificial intelligence, and advanced data analytics, is a major catalyst for this market growth. Banks are modernizing their systems to facilitate the efficient integration of BaaS offerings, empowering fintech companies and other third-party providers to deliver tailored financial services while ensuring improved customer experiences.
| Market Scope | |
|---|---|
| Start Year | 2024 |
| Forecast Year | 2025-2034 |
| Start Value | $18.6 Billion |
| Forecast Value | $73.7 Billion |
| CAGR | 15.1% |
The platform segment held a 69% share in 2024 and will continue to grow at a CAGR of 15% through 2034. BaaS platforms offer a robust infrastructure for the integration of financial services into non-bank applications, providing scalable, flexible solutions for fintechs, neobanks, and other third-party providers. These platforms deliver APIs that simplify access to core banking functions like payments, account creation, and compliance.
Cloud-based Banking as a Service platforms segment held 67% share in 2024. This dominance is projected to continue, with the segment expected to grow at a robust CAGR of 15.5% through 2034. The cloud model offers benefits that make it highly attractive to financial technology firms and traditional banks. Its scalability and flexibility allow companies to rapidly scale operations and expand their service offerings, often without significant upfront investments in physical infrastructure.
United States Banking as a Service Market held 86% share in 2024 driven by the increasing demand for embedded financial services, and supportive regulatory frameworks are key drivers behind this expansion. U.S. banks leverage BaaS platforms to improve digital offerings, enhance customer engagement, and streamline product development. Partnerships between traditional financial institutions and fintech companies have fostered a dynamic financial ecosystem, allowing banks to monetize their services while enabling fintech to develop cutting-edge solutions.
Leading players in the Global Banking as a Service sector include ClearBank Ltd., Fiserv, Galileo Financial Technologies, Mambu, Marqeta, Railsr, Solaris SE, Green Dot, Plaid, and Finastra. To secure a stronger foothold in the Banking-as-a-Service market, companies develop innovative, flexible, and scalable platforms that cater to large and small financial institutions. Key players are also forming strategic partnerships with fintech firms, traditional banks, and tech companies to expand their offerings and reach new markets. Additionally, companies are investing heavily in enhancing the security, efficiency, and regulatory compliance of their platforms, enabling them to meet the diverse needs of customers while ensuring smooth and seamless integration.
Table of Contents
Chapter 1 Methodology & Scope
- 1.1 Research design
- 1.1.1 Research approach
- 1.1.2 Data collection methods
- 1.2 Base estimates and calculations
- 1.2.1 Base year calculation
- 1.2.2 Key trends for market estimates
- 1.3 Forecast model
- 1.4 Primary research & validation
- 1.4.1 Primary sources
- 1.4.2 Data mining sources
- 1.5 Market definitions
Chapter 2 Executive Summary
- 2.1 Industry 3600 synopsis, 2021 - 2034
Chapter 3 Industry Insights
- 3.1 Industry ecosystem analysis
- 3.2 Supplier landscape
- 3.2.1 Licensed banks
- 3.2.2 BaaS platform providers
- 3.2.3 Enablers/aggregators
- 3.2.4 Distributors
- 3.2.5 End use
- 3.3 Profit margin analysis
- 3.4 Technology & innovation landscape
- 3.5 Use case analysis
- 3.5.1 FinTech adoption case studies
- 3.5.2 BaaS in e-commerce and super apps
- 3.5.3 Digital banks leveraging BaaS
- 3.6 Consumer behavior & adoption trend
- 3.7 Future outlook trends
- 3.8 Patent analysis
- 3.9 Key news & initiatives
- 3.10 Regulatory landscape
- 3.11 Impact forces
- 3.11.1 Growth drivers
- 3.11.1.1 Rising demand for digital banking services
- 3.11.1.2 Growing popularity of embedded finance
- 3.11.1.3 Increasing advancements in advanced technologies
- 3.11.1.4 Popularity of open banking
- 3.11.1.5 Rising adoption of cloud computing
- 3.11.2 Industry pitfalls & challenges
- 3.11.2.1 Data security and privacy concerns
- 3.11.2.2 High development and maintenance costs
- 3.11.1 Growth drivers
- 3.12 Growth potential analysis
- 3.13 Porter's analysis
- 3.14 PESTEL analysis
Chapter 4 Competitive Landscape, 2024
- 4.1 Introduction
- 4.2 Company market share analysis
- 4.3 Competitive positioning matrix
- 4.4 Strategic outlook matrix
Chapter 5 Market Estimates & Forecast, By Component, 2021 - 2034 ($Bn)
- 5.1 Key trends
- 5.2 Platform
- 5.3 Services
Chapter 6 Market Estimates & Forecast, By Type, 2021 - 2034 ($Bn)
- 6.1 Key trends
- 6.2 API-based
- 6.3 Cloud-based
Chapter 7 Market Estimates & Forecast, By Enterprise Size, 2021 - 2034 ($Bn)
- 7.1 Key trends
- 7.2 Large enterprises
- 7.3 Small & medium enterprises
Chapter 8 Market Estimates & Forecast, By Application, 2021 - 2034 ($Bn)
- 8.1 Key trends
- 8.2 Digital banking
- 8.3 Payment processing
- 8.4 Lending
- 8.5 Banking compliance
- 8.6 Account & transaction management
- 8.7 Card issuance
Chapter 9 Market Estimates & Forecast, By End Use, 2021 - 2034 ($Bn)
- 9.1 Key trends
- 9.2 Banks
- 9.3 NBFC
- 9.4 Others
Chapter 10 Market Estimates & Forecast, By Region, 2021 - 2034 ($Bn)
- 10.1 Key trends
- 10.2 North America
- 10.2.1 U.S.
- 10.2.2 Canada
- 10.3 Europe
- 10.3.1 UK
- 10.3.2 Germany
- 10.3.3 France
- 10.3.4 Italy
- 10.3.5 Spain
- 10.3.6 Russia
- 10.3.7 Nordics
- 10.4 Asia Pacific
- 10.4.1 China
- 10.4.2 India
- 10.4.3 Japan
- 10.4.4 South Korea
- 10.4.5 ANZ
- 10.4.6 Southeast Asia
- 10.5 Latin America
- 10.5.1 Brazil
- 10.5.2 Mexico
- 10.5.3 Argentina
- 10.6 MEA
- 10.6.1 UAE
- 10.6.2 Saudi Arabia
- 10.6.3 South Africa
Chapter 11 Company Profiles
- 11.1 Banco Bilbao Vizcaya Argentaria
- 11.2 Bnkbl Ltd
- 11.3 ClearBank Ltd
- 11.4 Cross River Bank
- 11.5 Finastra
- 11.6 Fiserv
- 11.7 Galileo Financial Technologies
- 11.8 Green Dot
- 11.9 Mambu
- 11.10 Marqeta
- 11.11 MatchMove Pay Pte Ltd
- 11.12 OpenPayd
- 11.13 Plaid
- 11.14 Project Imagine
- 11.15 Railsr
- 11.16 Sila
- 11.17 Solaris SE
- 11.18 Square, Inc
- 11.19 Starling Bank
- 11.20 Treasury Prime

