
|
市場調査レポート
商品コード
1666935
トランジットバスの市場機会、成長促進要因、産業動向分析、2025年~2034年予測Transit Bus Market Opportunity, Growth Drivers, Industry Trend Analysis, and Forecast 2025 - 2034 |
||||||
カスタマイズ可能
|
|||||||
| トランジットバスの市場機会、成長促進要因、産業動向分析、2025年~2034年予測 |
|
出版日: 2024年12月17日
発行: Global Market Insights Inc.
ページ情報: 英文 180 Pages
納期: 2~3営業日
|

全表示
- 概要
- 目次
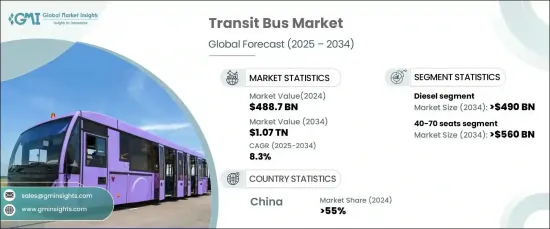
トランジットバスの世界市場は大きな成長を遂げており、2024年には4,887億米ドルの規模に達し、2025年から2034年までのCAGRは8.3%になると予測されています。
この成長の原動力となっているのは、世界の都市化と人口密度の増加です。都市部の拡大に伴い、効率的で持続可能な公共交通ソリューションへの需要が高まっています。交通機関は、人口増加のニーズを満たし、モビリティを向上させ、混雑を緩和するために、バスネットワークの近代化に取り組んでいます。利用しやすく費用対効果の高い交通手段に対する需要の高まりは、リアルタイム追跡システムやよりスマートなルーティングソリューションのような先進技術への投資を各国政府に促し、バスを経済成長と環境目標の両方を達成する鍵と位置づけています。
持続可能な輸送の必要性も、交通部門をゼロエミッションソリューションへと押し上げています。世界各国の政府は、野心的な二酸化炭素削減目標を達成するため、電気バスや水素バスの導入を義務付けています。排出量削減を目的とした厳しい規制と政策により、各国政府はより環境に優しい技術への移行を支援するための財政的インセンティブを提供しています。よりクリーンな車両への移行は、気候変動への懸念と都市の大気質改善の必要性に直接応えるものです。その結果、交通セクターの企業は、電気バスや水素バスを車両に組み込む新たな機会を捉えつつあります。
| 市場範囲 | |
|---|---|
| 開始年 | 2024年 |
| 予測年 | 2025年~2034年 |
| 開始金額 | 4,887億米ドル |
| 予測金額 | 1兆700億米ドル |
| CAGR | 8.3% |
市場は燃料タイプ別に区分され、ディーゼル、CNG、電気、その他が主要カテゴリーです。現在、ディーゼルバスが市場を独占しており、2024年の市場シェアの51%以上を占めました。しかし、選択的触媒還元(SCR)やディーゼルパティキュレートフィルター(DPF)などの排出ガス制御技術の進歩により、ディーゼルバスはますます厳しくなる環境基準を満たすことができるようになっています。ハイブリッドディーゼル-電気パワートレインも人気を集めており、従来のディーゼルバスと完全電気モデルの間の過渡的な選択肢を提供しています。これらのシステムは、ディーゼルエンジンの燃費効率と、回生ブレーキや最適化されたエネルギー管理といった電気モーターの利点を組み合わせたもので、完全電動化への移行と同時に排出量を削減するための実行可能なソリューションとなっています。
座席定員は市場の形成に重要な役割を果たしており、バスは通常、40席未満、40席から70席、70席以上の3つのカテゴリーに分類されます。40席から70席のセグメントは、電動パワートレインとバッテリー技術の進歩によって、2034年までに5,600億米ドルを超えると予想されています。メーカーは、航続距離、充電速度、コスト効率を向上させるため、バッテリー性能の最適化にますます注力しています。リチウムイオンバッテリーやソリッドステートバッテリーの技術革新は、運転サイクルの延長と生産コストの削減を実現し、電気バスの普及を促進すると予想されます。
地域別では、中国が引き続き世界の輸送用バス市場をリードしており、2024年の売上高の55%以上を占めました。排出ガスの削減と大気環境の改善を目的とした政府の厳しい政策が、電気バスへのシフトを加速させています。特に大都市では、電気バスが公共交通システムの重要な一部となっています。中国の大手メーカーは、この変革において重要な役割を果たし、完全な電気公共交通車両を実現するという中国の目標に貢献しています。
目次
第1章 調査手法と調査範囲
- 調査デザイン
- 調査アプローチ
- データ収集方法
- 基本推定と計算
- 基準年の算出
- 市場推計の主要動向
- 予測モデル
- 一次調査と検証
- 一次ソース
- データマイニングソース
- 市場定義
第2章 エグゼクティブサマリー
第3章 業界洞察
- 業界エコシステム分析
- サプライヤーの状況
- 部品メーカー
- 自動車OEM
- ティア1サプライヤー
- 充電インフラ・プロバイダー
- 最終用途
- 利益率分析
- 技術差別化要因
- 電動パワートレイン技術
- 半自律走行機能
- IoT統合
- 水素燃料電池技術
- その他
- 主なニュースと取り組み
- 特許分析
- 規制状況
- 影響要因
- 成長促進要因
- 都市化の進展と都市部における人口密度の増加
- 環境規制の導入拡大
- 輸送バスの電動化の進展
- 公共交通機関へのインフラ投資の拡大
- 業界の潜在的リスク・課題
- 初期投資コストの高さ
- 充電インフラ規制
- 成長促進要因
- 成長可能性分析
- ポーター分析
- PESTEL分析
第4章 競合情勢
- イントロダクション
- 企業市場シェア分析
- 競合のポジショニングマトリックス
- 戦略展望マトリックス
第5章 市場推計・予測:燃料別、2021年~2034年
- 主要動向
- ディーゼル
- 圧縮天然ガス(CNG)
- 電気自動車
- バッテリー電気自動車
- 燃料電池電気自動車
- ハイブリッド電気自動車
第6章 市場推計・予測:乗車定員別、2021年~2034年
- 主要動向
- 40席未満
- 都市交通
- 郊外輸送
- 都市間輸送
- その他
- 40~70席
- 都市交通
- 郊外交通
- 都市間輸送
- その他
- 70席以上
- 都市間輸送
- 郊外交通
- 都市間輸送
- その他
第7章 市場推計・予測:用途別、2021年~2034年
- 主要動向
- 都市交通
- 郊外交通
- 都市間輸送
- その他
第8章 市場推計・予測:地域別、2021年~2034年
- 主要動向
- 北米
- 米国
- カナダ
- 欧州
- 英国
- ドイツ
- フランス
- スペイン
- イタリア
- ロシア
- 北欧
- アジア太平洋
- 中国
- インド
- 日本
- 韓国
- ニュージーランド
- 東南アジア
- ラテンアメリカ
- ブラジル
- メキシコ
- アルゼンチン
- 中東・アフリカ
- UAE
- 南アフリカ
- サウジアラビア
第9章 企業プロファイル
- Anhui Ankai Automobile
- Ashok Leyland
- Beiqi Foton Motor
- BYD
- Daimler
- Ebusco
- Irizar Group
- IVECO
- King Long United Automotive Industry
- MAN
- NFI Group
- Proterra
- Scania
- Solaris Bus &Couch
- TATA Motors
- VDL Bus &Coach
- Volvo
- Xiamen Golden Dragon Bus
- Yutong
- Zhengzhou Yutong Bus
- Zhongtong Bus
The Global Transit Bus Market is experiencing significant growth, projected to reach a value of USD 488.7 billion by 2024, with an expected CAGR of 8.3% from 2025 to 2034. This growth is driven by urbanization and the increasing density of populations in cities worldwide. As urban areas expand, the demand for efficient, sustainable public transportation solutions is intensifying. Transit agencies are working to modernize bus networks to meet the needs of growing populations, improve mobility, and reduce congestion. The rising demand for accessible, cost-effective transport options is further motivating governments to invest in advanced technologies like real-time tracking systems and smarter routing solutions, positioning buses as key to achieving both economic growth and environmental goals.
The need for sustainable transportation is also pushing the transit sector towards zero-emission solutions. Governments worldwide are mandating the adoption of electric and hydrogen-powered buses to meet ambitious carbon reduction targets. With strict regulations and policies aimed at reducing emissions, governments are offering financial incentives to support the shift toward greener technologies. This transition to cleaner vehicles is a direct response to climate change concerns and the need for better urban air quality. As a result, businesses in the transit sector are seizing new opportunities to integrate electric and hydrogen-powered buses into their fleets.
| Market Scope | |
|---|---|
| Start Year | 2024 |
| Forecast Year | 2025-2034 |
| Start Value | $488.7 Billion |
| Forecast Value | $1.07 Trillion |
| CAGR | 8.3% |
The market is segmented by fuel type, with diesel, CNG, electric, and others being the key categories. Diesel buses currently dominate the market, holding over 51% of the market share in 2024. However, advancements in emission control technologies, such as selective catalytic reduction (SCR) and diesel particulate filters (DPF), are enabling diesel buses to meet increasingly stringent environmental standards. Hybrid diesel-electric powertrains are also gaining popularity, providing a transitional option between traditional diesel buses and fully electric models. These systems combine the fuel efficiency of diesel engines with the benefits of electric motors, such as regenerative braking and optimized energy management, making them a viable solution for reducing emissions while transitioning to full electrification.
Seating capacity plays a significant role in shaping the market, with buses typically falling into three categories: below 40 seats, 40-70 seats, and above 70 seats. The 40-70 seat segment is anticipated to exceed USD 560 billion by 2034, driven by advances in electric powertrains and battery technologies. Manufacturers are increasingly focused on optimizing battery performance to improve range, charging speed, and cost-efficiency. Innovations in lithium-ion and solid-state batteries are expected to extend operational cycles and lower production costs, facilitating wider adoption of electric buses.
In terms of regional markets, China continues to lead the global transit bus market, contributing over 55% of revenue in 2024. Stringent government policies aimed at reducing emissions and improving air quality have accelerated the shift to electric buses. Generous government subsidies and incentives have played a significant role in supporting the adoption of electric buses, particularly in major cities where these buses are becoming a crucial part of public transport systems. Leading manufacturers in China are playing a vital role in this transformation, contributing to the country's goal of achieving a fully electric public transport fleet.
Table of Contents
Chapter 1 Methodology & Scope
- 1.1 Research design
- 1.1.1 Research approach
- 1.1.2 Data collection methods
- 1.2 Base estimates and calculations
- 1.2.1 Base year calculation
- 1.2.2 Key trends for market estimates
- 1.3 Forecast model
- 1.4 Primary research & validation
- 1.4.1 Primary sources
- 1.4.2 Data mining sources
- 1.5 Market definitions
Chapter 2 Executive Summary
- 2.1 Industry 3600 synopsis, 2021 - 2034
Chapter 3 Industry Insights
- 3.1 Industry ecosystem analysis
- 3.2 Supplier landscape
- 3.2.1 Component manufacturers
- 3.2.2 Automotive OEM
- 3.2.3 Tier-1 suppliers
- 3.2.4 Charging infrastructure providers
- 3.2.5 End use
- 3.3 Profit margin analysis
- 3.4 Technology differentiators
- 3.4.1 Electric powertrain technology
- 3.4.2 Semi-autonomous capabilities
- 3.4.3 IoT integration
- 3.4.4 Hydrogen fuel cell technology
- 3.4.5 Others
- 3.5 Key news & initiatives
- 3.6 Patent analysis
- 3.7 Regulatory landscape
- 3.8 Impact forces
- 3.8.1 Growth drivers
- 3.8.1.1 Growing urbanization and increasing population density in urban areas
- 3.8.1.2 Growing adoption of environmental regulations
- 3.8.1.3 Growing electrification of transit buses
- 3.8.1.4 Growing infrastructure investments in public transportation
- 3.8.2 Industry pitfalls & challenges
- 3.8.2.1 High initial investment costs
- 3.8.2.2 Charging infrastructure regulations
- 3.8.1 Growth drivers
- 3.9 Growth potential analysis
- 3.10 Porter’s analysis
- 3.11 PESTEL analysis
Chapter 4 Competitive Landscape, 2024
- 4.1 Introduction
- 4.2 Company market share analysis
- 4.3 Competitive positioning matrix
- 4.4 Strategic outlook matrix
Chapter 5 Market Estimates & Forecast, By Fuel, 2021 - 2034 ($Bn, Units)
- 5.1 Key trends
- 5.2 Diesel
- 5.3 Compressed natural gas (CNG)
- 5.4 Electric
- 5.4.1 Battery electric vehicle
- 5.4.2 Fuel cell electric vehicle
- 5.4.3 Hybrid electric vehicle
Chapter 6 Market Estimates & Forecast, By Seating Capacity, 2021 - 2034 ($Bn, Units)
- 6.1 Key trends
- 6.2 Below 40 seats
- 6.2.1 Urban transit
- 6.2.2 Suburban transit
- 6.2.3 Intercity
- 6.2.4 Others
- 6.3 40-70 seats
- 6.3.1 Urban transit
- 6.3.2 Suburban transit
- 6.3.3 Intercity
- 6.3.4 Others
- 6.4 Above 70 seats
- 6.4.1 Urban transit
- 6.4.2 Suburban transit
- 6.4.3 Intercity
- 6.4.4 Others
Chapter 7 Market Estimates & Forecast, By Application, 2021 - 2034 ($Bn, Units)
- 7.1 Key trends
- 7.2 Urban transit
- 7.3 Suburban transit
- 7.4 Intercity
- 7.5 Others
Chapter 8 Market Estimates & Forecast, By Region, 2021 - 2034 ($Bn, Units)
- 8.1 Key trends
- 8.2 North America
- 8.2.1 U.S.
- 8.2.2 Canada
- 8.3 Europe
- 8.3.1 UK
- 8.3.2 Germany
- 8.3.3 France
- 8.3.4 Spain
- 8.3.5 Italy
- 8.3.6 Russia
- 8.3.7 Nordics
- 8.4 Asia Pacific
- 8.4.1 China
- 8.4.2 India
- 8.4.3 Japan
- 8.4.4 South Korea
- 8.4.5 ANZ
- 8.4.6 Southeast Asia
- 8.5 Latin America
- 8.5.1 Brazil
- 8.5.2 Mexico
- 8.5.3 Argentina
- 8.6 MEA
- 8.6.1 UAE
- 8.6.2 South Africa
- 8.6.3 Saudi Arabia
Chapter 9 Company Profiles
- 9.1 Anhui Ankai Automobile
- 9.2 Ashok Leyland
- 9.3 Beiqi Foton Motor
- 9.4 BYD
- 9.5 Daimler
- 9.6 Ebusco
- 9.7 Irizar Group
- 9.8 IVECO
- 9.9 King Long United Automotive Industry
- 9.10 MAN
- 9.11 NFI Group
- 9.12 Proterra
- 9.13 Scania
- 9.14 Solaris Bus & Couch
- 9.15 TATA Motors
- 9.16 VDL Bus & Coach
- 9.17 Volvo
- 9.18 Xiamen Golden Dragon Bus
- 9.19 Yutong
- 9.20 Zhengzhou Yutong Bus
- 9.21 Zhongtong Bus

