
|
市場調査レポート
商品コード
1693657
バス:市場シェア分析、産業動向・統計、成長予測(2025年~2030年)Bus - Market Share Analysis, Industry Trends & Statistics, Growth Forecasts (2025 - 2030) |
||||||
カスタマイズ可能
適宜更新あり
|
|||||||
| バス:市場シェア分析、産業動向・統計、成長予測(2025年~2030年) |
|
出版日: 2025年03月18日
発行: Mordor Intelligence
ページ情報: 英文 307 Pages
納期: 2~3営業日
|

全表示
- 概要
- 目次
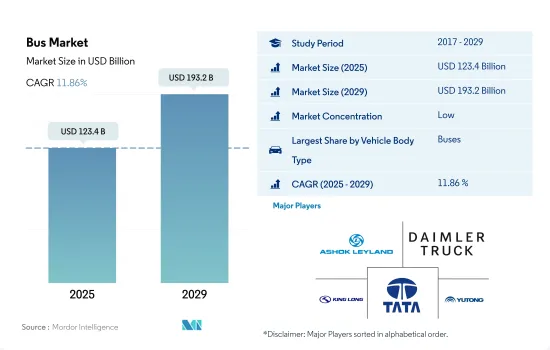
バス市場規模は2025年に1,234億米ドルと推計され、2029年には1,932億米ドルに達すると予測され、予測期間(2025-2029年)のCAGRは11.86%で成長します。
電気バスは、燃料費とメンテナンス費用の削減により、ディーゼルバスに比べて総所有コストを大幅に削減できます。
- 燃料は、あらゆる車両の運行コストの大部分を占める。公共輸送に電気バスを使用することで、燃料費、その他の初期費用、総所有コストが削減されます。2030年までに、電気バスの価格はディーゼル燃料バスの価格レベルまで下がると予想されています。電気バスは、ディーゼルエンジンバスと比較して、維持・運行コストを81~83%削減するのに役立ちます。
- 一般的なディーゼル輸送車両が50万米ドルであるのに対し、電気バスは75万米ドルです。初期費用は高いもの、電気バスは費用対効果の高い代替手段です。電気バスは、メンテナンス費用と燃料費が少ないため運行コストが低く、化石燃料価格と比較して電力価格が相対的に安定しているためコスト予測可能性が高く、耐用年数を通じて大幅な節約につながります。有利な法律が制定されれば、電気バスはより財政的に実現可能なものとなります。電気バスのメーカー各社は、400万米ドルの燃料節約と約12万5,000米ドルのメンテナンス節約により、電気バスは初期コストの高さを補って余りあると主張しています。
- 世界のeバス・エコシステムの構成要素は、確立された政府規制に従って実施されているが、eバス・エコシステムの世界の開発を促進するためには、計画、責任範囲、運用の面で、eバス充電ステーションの設置と管理という当面の課題に最優先で取り組まなければならないです。
世界のバス市場動向
世界の需要の高まりと政府の支援が電気自動車市場の成長を後押し
- 電気自動車(EV)は、エネルギー効率を高め、温室効果ガスや公害の排出を削減する可能性に後押しされ、自動車産業において不可欠なものとなっています。この急成長の主な要因は、環境に対する関心の高まりと政府の支援策にあります。特に、EVの世界販売台数は、2021年と比較して2022年には10.82%増と堅調な伸びを示しました。予測によると、電気乗用車の年間販売台数は2025年末までに500万台を突破し、自動車販売台数全体の約15%を占めるようになります。
- ロンドン警視庁消防局のような大手メーカーや組織は、電動モビリティ戦略を積極的に推進しています。例えば、2025年までに車両をゼロ・エミッション化し、2030年までにバンの40%を電動化、2040年までに完全電動化を達成するという目標を掲げています。世界的にも同様の動向が予想され、2024年から2030年にかけて電気自動車の需要と販売が急増します。
- アジア太平洋と欧州は、バッテリー技術と車両電化の進歩に牽引され、電気自動車生産を支配する態勢を整えています。2020年5月、起亜自動車欧州は「プランS」を発表し、電動化への戦略的シフトを表明しました。この決定は、起亜のEVが欧州で記録的な販売台数を達成したことを受けてのものです。起亜は2025年までに、乗用車、SUV、MPVなどさまざまなセグメントにまたがる11のEVモデルを世界に投入するという野心的な計画を掲げています。同社は、2026年までにEVの世界年間販売台数50万台の達成を目指しています。
バス業界の概要
バス市場は細分化されており、上位5社で12.60%を占めています。この市場の主要企業は以下の通り。 Ashok Leyland Limited, Daimler Truck Holding AG, King Long United Automotive Industry, Tata Motors Limited and Zhengzhou Yutong Bus(アルファベット順)
その他の特典
- エクセル形式の市場予測(ME)シート
- 3ヶ月のアナリストサポート
目次
第1章 エグゼクティブサマリーと主な調査結果
第2章 レポートのオファー
第3章 イントロダクション
- 調査の前提条件と市場定義
- 調査範囲
- 調査手法
第4章 主要産業動向
- 人口
- アフリカ
- アジア太平洋
- 欧州
- 中東
- 北米
- 南米
- 一人当たりGDP
- アフリカ
- アジア太平洋
- 欧州
- 中東
- 北米
- 南米
- 自動車購入のための消費支出(cvp)
- アフリカ
- アジア太平洋
- 欧州
- 中東
- 北米
- 南米
- インフレ率
- アフリカ
- アジア太平洋
- 欧州
- 中東
- 北米
- 南米
- 自動車ローン金利
- シェアライド
- シェアライド
- 電化の影響
- EV充電ステーション
- バッテリーパック価格
- アフリカ
- アジア太平洋
- 欧州
- 中東
- 北米
- 南米
- Xev新モデル発表
- 燃料価格
- OEM生産統計
- 規制の枠組み
- バリューチェーンと流通チャネル分析
第5章 市場セグメンテーション
- 推進タイプ
- ハイブリッド車と電気自動車
- 燃料カテゴリー別
- BEV
- FCEV
- HEV
- PHEV
- ICE
- 燃料カテゴリー別
- ハイブリッド車と電気自動車
- 地域別
- アフリカ
- アジア太平洋
- インド
- 日本
- 欧州
- チェコ共和国
- 中東
- 北米
- カナダ
- メキシコ
- 米国
- 南米
第6章 競合情勢
- 主要な戦略動向
- 市場シェア分析
- 企業情勢
- 企業プロファイル
- Anhui Ankai Automobile Co. Ltd.
- Ashok Leyland Limited
- Byd Auto Industry Company Limited
- Daimler Truck Holding AG
- King Long United Automotive Industry Co. Ltd.
- NFI Group Inc.
- Proterra INC.
- Tata Motors Limited
- Volvo Group
- Zhengzhou Yutong Bus Co. Ltd.
- Zhongtong Bus Holding Co. Ltd.
第7章 CEOへの主な戦略的質問
第8章 付録
- 世界概要
- 概要
- ファイブフォース分析フレームワーク
- 世界のバリューチェーン分析
- 市場力学(DROs)
- 情報源と参考文献
- 図表一覧
- 主要洞察
- データパック
- 用語集
The Bus Market size is estimated at 123.4 billion USD in 2025, and is expected to reach 193.2 billion USD by 2029, growing at a CAGR of 11.86% during the forecast period (2025-2029).
Electric buses offer significantly lower total cost of ownership compared to diesel buses through reduced fuel and maintenance costs
- Fuel constitutes a major part of the operating cost of any vehicle. Using an electric bus for public transport reduces fuel costs, along with other upfront costs and the total cost of ownership. By 2030, the prices for electric buses are expected to decrease to the price level of diesel fuel buses. Electric buses help reduce 81-83% of the maintenance and operating costs compared to a diesel-engine bus.
- An electric bus costs USD 750,000 compared to USD 500,000 for a typical diesel transit vehicle. Despite their higher initial costs, electric buses are a cost-effective alternative. They offer lower operating costs due to lower maintenance and fuel expenditures, as well as greater cost predictability due to the relative stability of electricity prices compared to fossil fuel prices, resulting in significant savings over the course of their lifetime. With favorable legislation, electric buses are more financially feasible. Manufacturers of electric buses assert that these vehicles more than make up for their higher initial cost, with fuel savings of USD 4,00,000 and maintenance savings of about USD 1,25,000.
- Although the components of the global e-bus ecosystem are being implemented in accordance with established government regulations, the immediate challenge of setting up and managing e-bus charging stations in terms of planning, the scope of responsibilities, and operation must be addressed on a high-priority basis to expedite the development of the e-bus ecosystem across the world.
Global Bus Market Trends
The rising global demand and government support propel electric vehicle market growth
- Electric vehicles (EVs) have become indispensable in the automotive industry, driven by their potential to enhance energy efficiency and reduce greenhouse gas and pollution emissions. This surge is primarily attributed to growing environmental concerns and supportive government initiatives. Notably, global EV sales witnessed a robust 10.82% growth in 2022 compared to 2021. Projections indicate that annual sales of electric passenger cars will surpass 5 million by the end of 2025, accounting for approximately 15% of total vehicle sales.
- Leading manufacturers and organizations, like the London Metropolitan Police & Fire Service, have been actively pursuing their electric mobility strategies. For instance, they have set a target of a zero-emission fleet by 2025, with a goal of electrifying 40% of their vans by 2030 and achieving full electrification by 2040. Similar trends are expected globally, with the period from 2024 to 2030 witnessing a surge in demand and sales of electric vehicles.
- Asia-Pacific and Europe are poised to dominate electric vehicle production, driven by their advancements in battery technology and vehicle electrification. In May 2020, Kia Motors Europe unveiled its "Plan S," signaling a strategic shift toward electrification. This decision came on the heels of record-breaking sales of Kia's EVs in Europe. Kia has ambitious plans to introduce 11 EV models globally by 2025, spanning various segments like passenger vehicles, SUVs, and MPVs. The company aims to achieve annual global EV sales of 500,000 by 2026.
Bus Industry Overview
The Bus Market is fragmented, with the top five companies occupying 12.60%. The major players in this market are Ashok Leyland Limited, Daimler Truck Holding AG, King Long United Automotive Industry Co. Ltd., Tata Motors Limited and Zhengzhou Yutong Bus Co. Ltd. (sorted alphabetically).
Additional Benefits:
- The market estimate (ME) sheet in Excel format
- 3 months of analyst support
TABLE OF CONTENTS
1 EXECUTIVE SUMMARY & KEY FINDINGS
2 REPORT OFFERS
3 INTRODUCTION
- 3.1 Study Assumptions & Market Definition
- 3.2 Scope of the Study
- 3.3 Research Methodology
4 KEY INDUSTRY TRENDS
- 4.1 Population
- 4.1.1 Africa
- 4.1.2 Asia-Pacific
- 4.1.3 Europe
- 4.1.4 Middle East
- 4.1.5 North America
- 4.1.6 South America
- 4.2 GDP Per Capita
- 4.2.1 Africa
- 4.2.2 Asia-Pacific
- 4.2.3 Europe
- 4.2.4 Middle East
- 4.2.5 North America
- 4.2.6 South America
- 4.3 Consumer Spending For Vehicle Purchase (cvp)
- 4.3.1 Africa
- 4.3.2 Asia-Pacific
- 4.3.3 Europe
- 4.3.4 Middle East
- 4.3.5 North America
- 4.3.6 South America
- 4.4 Inflation
- 4.4.1 Africa
- 4.4.2 Asia-Pacific
- 4.4.3 Europe
- 4.4.4 Middle East
- 4.4.5 North America
- 4.4.6 South America
- 4.5 Interest Rate For Auto Loans
- 4.6 Shared Rides
- 4.7 Shared Rides
- 4.8 Impact Of Electrification
- 4.9 EV Charging Station
- 4.10 Battery Pack Price
- 4.10.1 Africa
- 4.10.2 Asia-Pacific
- 4.10.3 Europe
- 4.10.4 Middle East
- 4.10.5 North America
- 4.10.6 South America
- 4.11 New Xev Models Announced
- 4.12 Fuel Price
- 4.13 Oem-wise Production Statistics
- 4.14 Regulatory Framework
- 4.15 Value Chain & Distribution Channel Analysis
5 MARKET SEGMENTATION (includes market size in Value in USD and Volume, Forecasts up to 2029 and analysis of growth prospects)
- 5.1 Propulsion Type
- 5.1.1 Hybrid and Electric Vehicles
- 5.1.1.1 By Fuel Category
- 5.1.1.1.1 BEV
- 5.1.1.1.2 FCEV
- 5.1.1.1.3 HEV
- 5.1.1.1.4 PHEV
- 5.1.2 ICE
- 5.1.2.1 By Fuel Category
- 5.1.1 Hybrid and Electric Vehicles
- 5.2 Region
- 5.2.1 Africa
- 5.2.2 Asia-Pacific
- 5.2.2.1 India
- 5.2.2.2 Japan
- 5.2.3 Europe
- 5.2.3.1 Czech Republic
- 5.2.4 Middle East
- 5.2.5 North America
- 5.2.5.1 Canada
- 5.2.5.2 Mexico
- 5.2.5.3 US
- 5.2.6 South America
6 COMPETITIVE LANDSCAPE
- 6.1 Key Strategic Moves
- 6.2 Market Share Analysis
- 6.3 Company Landscape
- 6.4 Company Profiles
- 6.4.1 Anhui Ankai Automobile Co. Ltd.
- 6.4.2 Ashok Leyland Limited
- 6.4.3 Byd Auto Industry Company Limited
- 6.4.4 Daimler Truck Holding AG
- 6.4.5 King Long United Automotive Industry Co. Ltd.
- 6.4.6 NFI Group Inc.
- 6.4.7 Proterra INC.
- 6.4.8 Tata Motors Limited
- 6.4.9 Volvo Group
- 6.4.10 Zhengzhou Yutong Bus Co. Ltd.
- 6.4.11 Zhongtong Bus Holding Co. Ltd.
7 KEY STRATEGIC QUESTIONS FOR VEHICLES CEOS
8 APPENDIX
- 8.1 Global Overview
- 8.1.1 Overview
- 8.1.2 Porter's Five Forces Framework
- 8.1.3 Global Value Chain Analysis
- 8.1.4 Market Dynamics (DROs)
- 8.2 Sources & References
- 8.3 List of Tables & Figures
- 8.4 Primary Insights
- 8.5 Data Pack
- 8.6 Glossary of Terms
