
|
市場調査レポート
商品コード
1684866
スマート兵器市場の機会、成長促進要因、産業動向分析、2025年~2034年の予測Smart Weapons Market Opportunity, Growth Drivers, Industry Trend Analysis, and Forecast 2025 - 2034 |
||||||
カスタマイズ可能
|
|||||||
| スマート兵器市場の機会、成長促進要因、産業動向分析、2025年~2034年の予測 |
|
出版日: 2025年01月10日
発行: Global Market Insights Inc.
ページ情報: 英文 190 Pages
納期: 2~3営業日
|

全表示
- 概要
- 目次
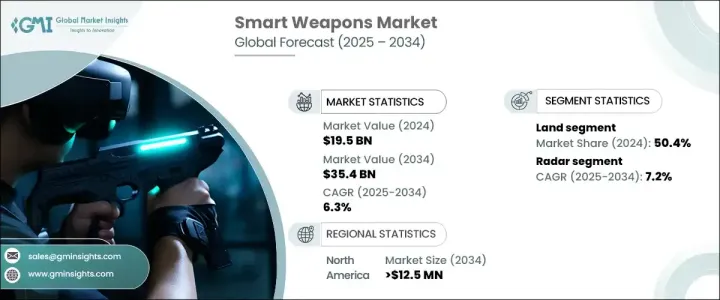
スマート兵器の世界市場は、2024年に195億米ドルと評価され、2025年から2034年にかけてCAGR 6.3%で拡大すると予測されています。
地政学的緊張が高まり、精密な戦争が重視されるようになる中、世界中の防衛機関は軍事能力を強化するためにスマート兵器技術を優先しています。これらの高度なシステムは、人工知能(AI)、機械学習、リアルタイムのデータ分析を活用し、精度と運用効率を向上させ、巻き添え被害を最小限に抑えることで、現代の戦争を変革しています。各国政府は、国家安全保障を強化するために最先端の防衛ソリューションに多額の投資を行っているが、その一方で、継続的な技術の進歩が競合情勢を形成し続けています。防衛軍へのスマート兵器の統合は、単なる動向ではなく、進化する戦闘シナリオにおける戦略的優位性と迅速な対応能力の必要性によって推進される必然です。
防衛予算の増加は、世界の安全保障上の脅威の増大と相まって、さまざまな軍事プラットフォームにおけるスマート兵器の需要をさらに促進しています。ネットワーク中心戦争と自律システムへのシフトは、特に米国、中国、ロシアなど国防費の高い国々で次世代兵器の採用を加速させています。精密誘導弾(PGM)、スマート爆弾、自律型ドローンなどの高度戦闘システムの普及は、市場の急速な進化を裏付けています。防衛請負業者と軍事組織は、現代の防衛戦略とシームレスに統合する高度なスマート兵器を開発するため、研究開発努力を継続的に強化しています。軍事作戦が技術主導型になるにつれて、スマート兵器の需要は増加の一途をたどり、同市場はより広範な防衛産業において極めて重要なセグメントとなっています。
| 市場範囲 | |
|---|---|
| 開始年 | 2024 |
| 予測年 | 2025-2034 |
| 開始金額 | 195億米ドル |
| 予測金額 | 354億米ドル |
| CAGR | 6.3% |
陸上プラットフォーム分野がスマート兵器市場を独占し、2024年には50%のシェアを獲得します。この成長は、精密誘導砲、スマート爆弾、高度ミサイルシステムなど、地上ベースの防衛ソリューションに対する需要の高まりによるところが大きいです。AIを搭載した陸上兵器は、リアルタイムの意思決定と戦闘状況への適応的対応を可能にすることで、戦場戦略に革命をもたらしています。AI主導の照準システムへの依存度が高まることで、作戦効率が確実に向上し、軍隊は最小限のリスクで精密な攻撃を実行できるようになります。世界の紛争が複雑化する中、各国は防衛・攻撃作戦の両方で戦略的優位性を維持するため、スマート陸戦技術への投資を強化しています。
スマート兵器分野のレーダー技術は、予測期間中にCAGR 7.2%で拡大し、照準能力と作戦精度の強化に極めて重要な役割を果たすとみられています。高度なレーダーシステムはリアルタイムの状況認識を提供し、厳しい環境条件下でも脅威の正確な検出と追跡を容易にします。フェーズドアレイ・レーダーやその他の最先端追跡技術は現代戦に革命をもたらし、誘導ミサイルや防空システムが複数の脅威を同時に無力化することを可能にしています。レーダーベースの照準ソリューションの絶え間ない進化は、スマート兵器の有効性を強化し、高難易度の戦闘シナリオにおいて不可欠なものとなっています。
北米のスマート兵器市場は2034年までに125億米ドルに達すると予測されており、米国が技術進歩の主導権を握っています。精密誘導システム、ネットワーク対応兵器、対無人航空機システム(UAS)技術に対する米軍の積極的な投資が、市場の大幅な成長を牽引しています。防衛機関と大手兵器メーカーとの協力関係が技術革新を促進し、米国がスマート兵器開発の最前線であり続けることを確実にしています。
目次
第1章 調査手法と調査範囲
- 市場範囲と定義
- 基本推定と計算
- 予測計算
- データソース
- 1次データ
- 二次資料
- 有料情報源
- 公的情報源
第2章 エグゼクティブサマリー
第3章 業界洞察
- エコシステム分析
- バリューチェーンに影響を与える要因
- 利益率分析
- 破壊
- 将来の展望
- メーカー
- 流通業者
- サプライヤーの状況
- 利益率分析
- 主要ニュース
- 規制状況
- 影響要因
- 促進要因
- スマート兵器におけるAIとIoT統合の進展
- 世界の主要軍事大国の防衛予算の増加
- 地政学的緊張の高まりが精密兵器の需要を促進
- ミサイル誘導・照準技術の急速な開発
- 現代戦における自律システムの採用急増
- 業界の潜在的リスク&課題
- 新興経済諸国における高い開発コストと予算の制約
- スマート兵器技術の輸出に関する厳しい国際規制
- 促進要因
- 成長可能性分析
- ポーター分析
- PESTEL分析
第4章 競合情勢
- イントロダクション
- 企業シェア分析
- 競合のポジショニング・マトリックス
- 戦略展望マトリックス
第5章 市場推計・予測:製品別、2021年~2034年
- 主要動向
- ミサイル
- 対戦車ミサイル・スタンドオフミサイル
- 空対空・空対地ミサイル
- 対船舶・対潜水艦ミサイル
- 弾薬
- 誘導爆弾
- ターゲットポッド
- 誘導弾
- 砲弾
- 迫撃砲弾
- 誘導ロケット弾
- 対戦車・戦術ロケット
- 空対空・空対地
- 対潜水艦
- 精密誘導火器
- 小型スマート兵器
- 肩掛け式火器
- スマートガン
第6章 市場推計・予測:技術別、2021年~2034年
- 主要動向
- レーザー
- レーダー
- アクティブホーミング
- パッシブホーミング
- GPS
- 赤外線
- IIRホーミング
- IRホーミング
- その他
- ワイヤー誘導
- サテライト
- 光学式
- マイクロコンピューティング
第7章 市場推計・予測:プラットフォーム別、2021年~2034年
- 主要動向
- 航空
- 陸上
- 海軍
第8章 市場推計・予測:地域別、2021-2034年
- 主要動向
- 北米
- 米国
- カナダ
- 欧州
- 英国
- ドイツ
- フランス
- イタリア
- スペイン
- ロシア
- アジア太平洋
- 中国
- インド
- 日本
- 韓国
- オーストラリア
- ラテンアメリカ
- ブラジル
- メキシコ
- 中東・アフリカ
- 南アフリカ
- サウジアラビア
- アラブ首長国連邦
第9章 企業プロファイル
- BAE Systems plc
- Elbit Systems Ltd
- General Dynamics Corporation
- Israel Aerospace Industries Ltd
- L3Harris Technologies Inc.
- Leonardo S.p.A
- Lockheed Martin Corporation
- MBDA
- Northrop Grumman Corporation
- Raytheon Technologies Corporation
- Rheinmetall AG
- Saab AB
- Textron Inc.
- Thales Group
- The Boeing Company
The Global Smart Weapons Market, valued at USD 19.5 billion in 2024, is projected to expand at a CAGR of 6.3% from 2025 to 2034. With rising geopolitical tensions and an increasing emphasis on precision warfare, defense agencies worldwide are prioritizing smart weapon technologies to enhance military capabilities. These advanced systems leverage artificial intelligence (AI), machine learning, and real-time data analytics, transforming modern warfare by improving accuracy and operational efficiency and minimizing collateral damage. Governments are investing heavily in cutting-edge defense solutions to bolster national security while ongoing technological advancements continue to shape the competitive landscape. The integration of smart weapons into defense forces is not just a trend but a necessity driven by the need for strategic superiority and rapid response capabilities in evolving combat scenarios.
Rising defense budgets, coupled with increasing global security threats, are further fueling demand for smart weapons across various military platforms. The shift towards network-centric warfare and autonomous systems is accelerating the adoption of next-generation weaponry, particularly in nations with high defense expenditures, such as the United States, China, and Russia. The proliferation of advanced combat systems, including precision-guided munitions (PGMs), smart bombs, and autonomous drones, underscores the market's rapid evolution. Defense contractors and military organizations are continuously enhancing R&D efforts to develop sophisticated smart weaponry that integrates seamlessly with modern defense strategies. As military operations become more technology-driven, the demand for smart weapons will continue its upward trajectory, making this market a crucial segment within the broader defense industry.
| Market Scope | |
|---|---|
| Start Year | 2024 |
| Forecast Year | 2025-2034 |
| Start Value | $19.5 Billion |
| Forecast Value | $35.4 Billion |
| CAGR | 6.3% |
The land platform segment dominates the smart weapons market, capturing a 50% share in 2024. This growth is largely driven by the rising demand for ground-based defense solutions, including precision-guided artillery, smart bombs, and advanced missile systems. AI-powered land-based weapons are revolutionizing battlefield strategies by enabling real-time decision-making and adaptive responses to combat situations. The increasing reliance on AI-driven targeting systems ensures enhanced operational efficiency, allowing militaries to execute precision strikes with minimal risk. As global conflicts become more complex, nations are ramping up investments in smart land warfare technologies to maintain strategic advantages in both defensive and offensive operations.
Radar technology within the smart weapons sector is set to expand at a CAGR of 7.2% over the forecast period, playing a pivotal role in enhancing targeting capabilities and operational precision. Advanced radar systems provide real-time situational awareness, facilitating precise threat detection and tracking even under challenging environmental conditions. Phased-array radar and other cutting-edge tracking technologies are revolutionizing modern warfare, enabling guided missiles and air defense systems to neutralize multiple threats simultaneously. The continuous evolution of radar-based targeting solutions is strengthening the effectiveness of smart weapons, making them indispensable in high-stakes combat scenarios.
North America smart weapons market is projected to reach USD 12.5 billion by 2034, with the United States leading the charge in technological advancements. The U.S. military's aggressive investments in precision-guided systems, network-enabled weapons, and counter-unmanned aerial systems (UAS) technologies are driving substantial market growth. Collaborations between defense agencies and leading arms manufacturers are fostering innovation, ensuring that the U.S. remains at the forefront of smart weapon development.
Table of Contents
Chapter 1 Methodology & Scope
- 1.1 Market scope & definitions
- 1.2 Base estimates & calculations
- 1.3 Forecast calculations
- 1.4 Data sources
- 1.4.1 Primary
- 1.4.2 Secondary
- 1.4.2.1 Paid sources
- 1.4.2.2 Public sources
Chapter 2 Executive Summary
- 2.1 Industry synopsis, 2021-2034
Chapter 3 Industry Insights
- 3.1 Industry ecosystem analysis
- 3.1.1 Factor affecting the value chain
- 3.1.2 Profit margin analysis
- 3.1.3 Disruptions
- 3.1.4 Future outlook
- 3.1.5 Manufacturers
- 3.1.6 Distributors
- 3.2 Supplier landscape
- 3.3 Profit margin analysis
- 3.4 Key news & initiatives
- 3.5 Regulatory landscape
- 3.6 Impact forces
- 3.6.1 Growth drivers
- 3.6.1.1 Advancements in AI and IoT integration in smart weapons
- 3.6.1.2 Increasing defense budgets of major military powers worldwide
- 3.6.1.3 Rising geopolitical tensions driving demand for precision weapons
- 3.6.1.4 Rapid development in missile guidance and targeting technologies
- 3.6.1.5 Surging adoption of autonomous systems in modern warfare
- 3.6.2 Industry pitfalls & challenges
- 3.6.2.1 High development costs and budget constraints for emerging economies
- 3.6.2.2 Stringent international regulations on smart weapon technology exports
- 3.6.1 Growth drivers
- 3.7 Growth potential analysis
- 3.8 Porter’s analysis
- 3.9 PESTEL analysis
Chapter 4 Competitive Landscape, 2024
- 4.1 Introduction
- 4.2 Company market share analysis
- 4.3 Competitive positioning matrix
- 4.4 Strategic outlook matrix
Chapter 5 Market Estimates & Forecast, By Product, 2021-2034 (USD Million)
- 5.1 Key trends
- 5.2 Missiles
- 5.2.1 Anti-tank Missiles & Standoff missiles
- 5.2.2 Air-to-Air & Air-to–Surface missile
- 5.2.3 Anti-Ship & Anti-Submarine missile
- 5.3 Munitions
- 5.3.1 Guided bombs
- 5.3.2 Target pods
- 5.4 Guided projectiles
- 5.4.1 Artillery shells
- 5.4.2 Mortar rounds
- 5.5 Guided rockets
- 5.5.1 Anti-tank & Tactical rockets
- 5.5.2 Air-to-Air & Air-to-Surface
- 5.5.3 Anti-Submarine
- 5.6 Precision guided firearms
- 5.6.1 Small smart weapons
- 5.6.2 Shoulder fired weapons
- 5.6.3 Smart guns
Chapter 6 Market Estimates & Forecast, By Technology, 2021-2034 (USD Million)
- 6.1 Key trends
- 6.2 Laser
- 6.3 Radar
- 6.3.1 Active homing
- 6.3.2 Passive homing
- 6.4 GPS
- 6.5 Infrared
- 6.5.1 IIR homing
- 6.5.2 IR homing
- 6.6 Others
- 6.6.1 Wire-guided
- 6.6.2 Satellite
- 6.6.3 Optical
- 6.6.4 Micro computing
Chapter 7 Market Estimates & Forecast, By Platform, 2021-2034 (USD Million)
- 7.1 Key trends
- 7.2 Air
- 7.3 Land
- 7.4 Naval
Chapter 8 Market Estimates & Forecast, By Region, 2021-2034 (USD Million)
- 8.1 Key trends
- 8.2 North America
- 8.2.1 U.S.
- 8.2.2 Canada
- 8.3 Europe
- 8.3.1 UK
- 8.3.2 Germany
- 8.3.3 France
- 8.3.4 Italy
- 8.3.5 Spain
- 8.3.6 Russia
- 8.4 Asia Pacific
- 8.4.1 China
- 8.4.2 India
- 8.4.3 Japan
- 8.4.4 South Korea
- 8.4.5 Australia
- 8.5 Latin America
- 8.5.1 Brazil
- 8.5.2 Mexico
- 8.6 MEA
- 8.6.1 South Africa
- 8.6.2 Saudi Arabia
- 8.6.3 UAE
Chapter 9 Company Profiles
- 9.1 BAE Systems plc
- 9.2 Elbit Systems Ltd
- 9.3 General Dynamics Corporation
- 9.4 Israel Aerospace Industries Ltd
- 9.5 L3Harris Technologies Inc.
- 9.6 Leonardo S.p.A
- 9.7 Lockheed Martin Corporation
- 9.8 MBDA
- 9.9 Northrop Grumman Corporation
- 9.10 Raytheon Technologies Corporation
- 9.11 Rheinmetall AG
- 9.12 Saab AB
- 9.13 Textron Inc.
- 9.14 Thales Group
- 9.15 The Boeing Company

