
|
市場調査レポート
商品コード
1755369
ポリマーサンドの市場機会、成長促進要因、産業動向分析、2025年~2034年予測Polymeric Sand Market Opportunity, Growth Drivers, Industry Trend Analysis, and Forecast 2025 - 2034 |
||||||
カスタマイズ可能
|
|||||||
| ポリマーサンドの市場機会、成長促進要因、産業動向分析、2025年~2034年予測 |
|
出版日: 2025年05月23日
発行: Global Market Insights Inc.
ページ情報: 英文 80 Pages
納期: 2~3営業日
|

全表示
- 概要
- 目次
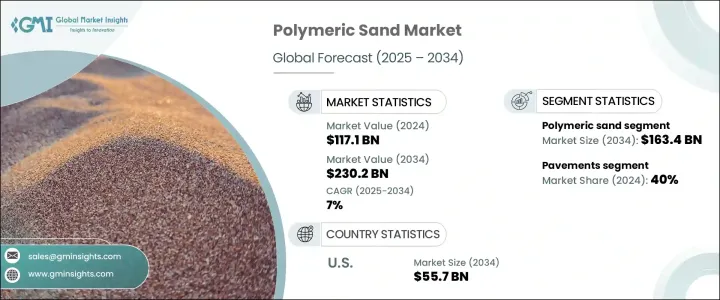
ポリマーサンドの世界市場規模は、2024年に1,171億米ドルとなり、CAGR7%で成長し、2034年までには2,302億米ドルに達すると予測されています。
成長の背景には、建設プロジェクトの増加、進行中の都市開発、造園における耐久性があり、メンテナンスの少ない素材を好む消費者の増加があります。ポリマーサンドは、舗装を所定の位置に固定し、雑草の繁殖を抑え、浸食や虫害に耐えることから、住宅や商業施設のハードスケープに最適な材料となっています。微細な砂にポリマーを添加したその配合は、水で活性化すると硬化し、表面の安定性と耐久性を高めます。住宅所有者、請負業者、自治体では、ポリマーサンドをパティオ、車道、歩道、プールデッキに使用し、その性能と見た目の美しさを高く評価しています。さらに、さまざまな色があるため、美観のカスタマイズにも適しています。
新興経済諸国が近代化やインフラ整備を優先し、裕福な地域が公共・私的な屋外環境の整備を続ける中、ポリマーサンドはますます注目される素材となっています。施工のしやすさ、浸食への耐性、さまざまな気候への適合性など、その実用的な利点により、さまざまな地域で理想的なソリューションとなっています。プロの造園家はその強度と効率性で信頼し、住宅所有者はメンテナンスを軽減し、魅力を高めるその能力を高く評価しています。さらに、さまざまな色のオプションが豊富にあるため、舗装プロジェクトにおいて機能的かつ美的な目標を達成することができます。
| 市場範囲 | |
|---|---|
| 開始年 | 2024年 |
| 予測年 | 2025年~2034年 |
| 開始金額 | 1,171億米ドル |
| 予測金額 | 2,302億米ドル |
| CAGR | 7% |
2024年、ポリマーサンド分野は822億米ドルに達しました。石、コンクリート、レンガなどの舗装材の目地を安定させる効果があるため、中庭、車道、商業用景観に好まれています。ポリマーサンドに含まれる水活性化結合剤は、強固でありながら柔軟性のある目地を形成し、環境による磨耗や破損に耐えるため、舗装面の長期的な維持に役立ちます。特に、1/8インチから4インチまでの目地幅で効果を発揮します。住宅用と商業用の両部門が引き続き成長を牽引しており、長期的な性能と施工のしやすさが人気の核となっています。
舗装用途分野は2024年に40%のシェアを占め、CAGRは6.8%と予測されます。都市の歩道、園路、歩行者ゾーンなどの舗装は、交通量や天候に耐えるインターロッキング舗装や目地材に依存しています。ポリマーサンドは、長期的な耐久性を保証し、雑草の繁殖を抑制し、交通量の多い公共エリアや美観を重視する住宅地で重要な表面の完全性を維持します。東南アジア、北米、欧州などの都市では、ポリマーサンドの排水効率、視覚的なまとまり、メンテナンスの利点を評価し、美化や持続可能性を重視した都市開発にポリマーサンドを導入しています。
米国のポリマーサンド市場は、2024年には272億米ドルと評価され、2034年までには557億米ドルになると予測されています。パティオ、プールデッキ、歩道への投資など、アウトドアリビングの人気が高まっていることから、ポリマーサンドは住宅所有者や専門家に好まれるソリューションとなっています。ポリマーサンドは、厳しい冬から湿度の高い夏まで、さまざまな気候に耐えることができるため、幅広い地域に普及しています。特にDIY店舗を通じた小売店の利用可能性と設置に関する消費者教育が、成長をさらに後押ししています。公共部門による緑地やインフラ整備への投資も商業需要を高め、同地域における同製品の地位を確実なものにしています。
世界のポリマーサンド市場を牽引する主要企業には、Gator Base、Euro Quarz、Pavestone Company、Quikrete、Alliance Designer Products、Sakrete、TCC Materials、Silpro Corporation、CEMEX、Techniseal、Polybind、Romex、SEK Surebond、SPEC MIX、Sable Marco、Ash Grove Cement Company、SRW Products、Tensar Corporation、Basalite Concrete Products、SpecChemなどがあります。競争の激しい市場競争における地位を強化するため、各社は技術革新、持続可能性、顧客教育を優先しています。主な戦略としては、耐候性と耐久性を向上させるための製品配合の強化、環境に対する期待の高まりに対応するための環境に優しい製品の提供、複数の色やテクスチャーの選択肢を含む製品ラインの拡大などが挙げられます。多くの企業がデジタルプラットフォームを活用し、ビデオチュートリアルやモバイルツールを通じて、請負業者やDIY消費者とつながっています。
目次
第1章 調査手法と範囲
第2章 エグゼクティブサマリー
第3章 業界考察
- 業界エコシステム分析
- 原材料分析
- 主なニュースと取り組み
- 規制情勢
- 影響要因
- 成長促進要因
- 急速な都市化
- インフラ投資の増加
- 長期的なコスト効率に対する意識の高まり
- 都市の美化と景観整備への傾向の高まり
- 業界の潜在的リスク・課題
- 市場の飽和
- 成長促進要因
- 成長可能性分析
- ポーター分析
- PESTEL分析
第4章 競合情勢
- イントロダクション
- 企業の市場シェア分析
- 競合ポジショニングマトリックス
- 戦略的展望マトリックス
第5章 市場推計・予測:製品タイプ別、2021年~2034年
- 主要動向
- ポリマーサンド
- ポリマーダスト
第6章 市場推計・予測:用途別、2021年~2034年
- 主要動向
- 舗装道路
- 駐車スペース
- プールデッキ
- 補助建築スペース
- パティオ
- その他
第7章 市場推計・予測:最終用途別、2021年~2034年
- 主要動向
- 住宅
- 商業
- 産業
- 市営
第8章 市場推計・予測:流通チャネル別、2021年~2034年
- 主要動向
- 直接
- 間接
第9章 市場推計・予測:地域別、2021年~2034年
- 主要動向
- 北米
- 米国
- カナダ
- 欧州
- ドイツ
- 英国
- フランス
- イタリア
- スペイン
- その他欧州地域
- アジア太平洋
- 中国
- インド
- 日本
- 韓国
- オーストラリア
- その他アジア太平洋
- ラテンアメリカ
- ブラジル
- メキシコ
- その他ラテンアメリカ地域
- 中東・アフリカ
- サウジアラビア
- アラブ首長国連邦
- 南アフリカ
- その他中東・アフリカ地域
第10章 企業プロファイル
- Alliance Designer Products
- Ash Grove Cement Company
- Basalite Concrete Products
- CEMEX
- Euro Quarz
- Gator Base
- Pavestone Company
- Polybind
- Quikrete
- Romex
- Sable Marco
- Sakrete
- SEK Surebond
- Silpro Corporation
- SPEC MIX
- SpecChem
- SRW Products
- TCC Materials
- Techniseal
- Tensar Corporation
The Global Polymeric Sand Market was valued at USD 117.1 billion in 2024 and is estimated to grow at a CAGR of 7% to reach USD 230.2 billion by 2034. The growth is fueled by a rise in construction projects, ongoing urban development, and consumer preference for durable, low-maintenance materials in landscaping. Polymeric sand has become a go-to material for residential and commercial hardscaping owing to locking pavers in place, reducing weed growth, and resisting erosion and insect damage. Its formulation-fine sand combined with polymer additives-hardens when activated by water, enhancing surface stability and durability. Homeowners, contractors, and municipalities use polymeric sand in patios, driveways, walkways, and pool decks, appreciating its performance and visual appeal. In addition, availability in a variety of colors makes it suitable for aesthetic customization.
As developing economies prioritize modernization and infrastructure upgrades, and wealthier regions continue enhancing their public and private outdoor environments, polymeric sand is increasingly seen as a go-to material. Its practical advantages-such as ease of application, resistance to erosion, and compatibility with various climates-make it an ideal solution across diverse geographies. Professional landscapers rely on it for its strength and efficiency, while homeowners value its ability to reduce maintenance and enhance curb appeal. Additionally, its wide availability in various color options allows users to achieve functional and aesthetic goals in paving projects.
| Market Scope | |
|---|---|
| Start Year | 2024 |
| Forecast Year | 2025-2034 |
| Start Value | $117.1 Billion |
| Forecast Value | $230.2 Billion |
| CAGR | 7% |
In 2024, the polymeric sand segment reached USD 82.2 billion. Its effectiveness in stabilizing joints between pavers- stone, concrete, or brick-has made it the preferred option for patios, driveways, and commercial landscapes. The water-activated bonding agents in polymeric sand form a solid yet flexible joint that resists environmental wear and tear, helping maintain paved surfaces for years. It works especially well in joint widths from 1/8 to 4 inches, which are standard in most paving applications. Both residential and commercial sectors continue to drive growth, with long-term performance and ease of application at the core of its popularity.
The pavement application segment held a 40% share in 2024 and is forecast to grow at a CAGR of 6.8%. Pavements, including urban walkways, garden paths, and pedestrian zones, rely on interlocking pavers and jointing materials that hold up under traffic and weather. Polymeric sand ensures long-term durability, controls weed growth and maintains surface integrity crucial in high-traffic public areas and aesthetically driven residential settings. Cities in regions like Southeast Asia, North America, and Europe are implementing polymeric sand in beautification and sustainability-focused urban development, valuing its drainage efficiency, visual cohesion, and maintenance benefits.
United States Polymeric Sand Market was valued at USD 27.2 billion in 2024 and is expected to generate USD 55.7 billion by 2034. The increasing popularity of outdoor living, including investments in patios, pool decks, and walkways, has made polymeric sand a preferred solution among homeowners and professionals. Its ability to withstand different climates-from harsh winters to humid summers-gives it broad geographic appeal. Retail availability and consumer education on installation, especially through DIY outlets, have further supported growth. Public sector investment in green spaces and infrastructure upgrades also adds to commercial demand, ensuring the product's stronghold in the region.
Key players driving the Global Polymeric Sand Market include Gator Base, Euro Quarz, Pavestone Company, Quikrete, Alliance Designer Products, Sakrete, TCC Materials, Silpro Corporation, CEMEX, Techniseal, Polybind, Romex, SEK Surebond, SPEC MIX, Sable Marco, Ash Grove Cement Company, SRW Products, Tensar Corporation, Basalite Concrete Products, and SpecChem. To reinforce their position in the competitive polymeric sand market, companies prioritize innovation, sustainability, and customer education. Key strategies include enhancing product formulations for better weather resistance and durability, offering eco-friendly variants to meet rising environmental expectations, and expanding product lines to include multiple color and texture options. Many firms leverage digital platforms to connect with contractors and DIY consumers through video tutorials and mobile tools.
Table of Contents
Chapter 1 Methodology & Scope
- 1.1 Market scope & definition
- 1.2 Base estimates & calculations
- 1.3 Forecast parameters
- 1.4 Data sources
- 1.4.1 Primary
- 1.4.2 Secondary
- 1.4.2.1 Paid sources
- 1.4.2.2 Public sources
Chapter 2 Executive Summary
- 2.1 Industry 3600 synopsis, 2021 - 2034
Chapter 3 Industry Insights
- 3.1 Industry ecosystem analysis
- 3.2 Raw material analysis
- 3.3 Key news and initiatives
- 3.4 Regulatory landscape
- 3.5 Impact forces
- 3.5.1 Growth drivers
- 3.5.1.1 Rapid urbanization
- 3.5.1.2 Increasing infrastructure investments
- 3.5.1.3 Growing awareness of long-term cost efficiency
- 3.5.1.4 Growing trend toward urban beautification and landscaping
- 3.5.2 Industry pitfalls & challenges
- 3.5.2.1 Market saturation
- 3.5.1 Growth drivers
- 3.6 Growth potential analysis
- 3.7 Porter's analysis
- 3.7.1 Supplier power
- 3.7.2 Buyer power
- 3.7.3 Threat of new entrants
- 3.7.4 Threat of substitutes
- 3.7.5 Industry rivalry
- 3.8 PESTEL analysis
Chapter 4 Competitive Landscape, 2024
- 4.1 Introduction
- 4.2 Company market share analysis
- 4.3 Competitive positioning matrix
- 4.4 Strategic outlook matrix
Chapter 5 Market Estimates & Forecast, By Product Type, 2021 - 2034, (USD Billion) (Kilo Tons)
- 5.1 Key trends
- 5.2 Polymeric sand
- 5.3 Polymeric dust
Chapter 6 Market Estimates & Forecast, By Application, 2021 - 2034, (USD Billion) (Kilo Tons)
- 6.1 Key trends
- 6.2 Pavements
- 6.3 Parking spaces
- 6.4 Pool decks
- 6.5 Auxiliary building spaces
- 6.6 Patios
- 6.7 Others
Chapter 7 Market Estimates & Forecast, By End Use, 2021 - 2034, (USD Billion) (Kilo Tons)
- 7.1 Key trends
- 7.2 Residential
- 7.3 Commercial
- 7.4 Industrial
- 7.5 Municipal
Chapter 8 Market Estimates & Forecast, By Distribution Channel, 2021 - 2034, (USD Billion) (Kilo Tons)
- 8.1 Key trends
- 8.2 Direct
- 8.3 Indirect
Chapter 9 Market Estimates & Forecast, By Region, 2021 - 2034, (USD Billion) (Kilo Tons)
- 9.1 Key trends
- 9.2 North America
- 9.2.1 U.S.
- 9.2.2 Canada
- 9.3 Europe
- 9.3.1 Germany
- 9.3.2 UK
- 9.3.3 France
- 9.3.4 Italy
- 9.3.5 Spain
- 9.3.6 Rest of Europe
- 9.4 Asia Pacific
- 9.4.1 China
- 9.4.2 India
- 9.4.3 Japan
- 9.4.4 South Korea
- 9.4.5 Australia
- 9.4.6 Rest of Asia Pacific
- 9.5 Latin America
- 9.5.1 Brazil
- 9.5.2 Mexico
- 9.5.3 Rest of Latin America
- 9.6 MEA
- 9.6.1 Saudi Arabia
- 9.6.2 UAE
- 9.6.3 South Africa
- 9.6.4 Rest of MEA
Chapter 10 Company Profiles
- 10.1 Alliance Designer Products
- 10.2 Ash Grove Cement Company
- 10.3 Basalite Concrete Products
- 10.4 CEMEX
- 10.5 Euro Quarz
- 10.6 Gator Base
- 10.7 Pavestone Company
- 10.8 Polybind
- 10.9 Quikrete
- 10.10 Romex
- 10.11 Sable Marco
- 10.12 Sakrete
- 10.13 SEK Surebond
- 10.14 Silpro Corporation
- 10.15 SPEC MIX
- 10.16 SpecChem
- 10.17 SRW Products
- 10.18 TCC Materials
- 10.19 Techniseal
- 10.20 Tensar Corporation

