
水産養殖設備市場のビジネスチャンス、成長要因、業界動向分析、および2026年~2035年の予測
Aquaculture equipment Market Opportunity, Growth Drivers, Industry Trend Analysis, and Forecast 2026 - 2035- 発行日
- ページ情報
- 英文 230 Pages
- 納期
- 2~3営業日
- 商品コード
- 2061364
- カスタマイズ可能 お客様のご希望に応じて、既存データの加工や未掲載情報(例:国別セグメント)の追加などの対応が可能です。詳細はお問い合わせください。
- 翻訳ツール提供対象 PDF対応AI翻訳ツールの無料貸し出しサービスのご利用が可能です
世界の水産養殖設備市場は、2025年に192億米ドルと評価され、CAGR 6%で拡大し、2035年までに343億米ドルに達すると推定されています。
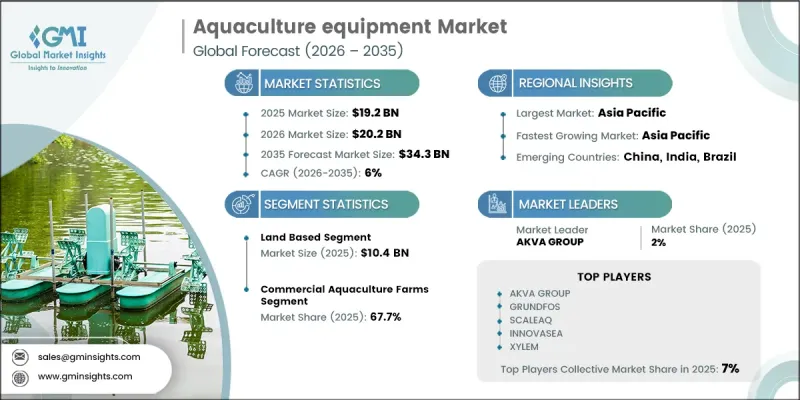
世界の水産物生産が、天然漁獲から管理された養殖環境へとますます移行するにつれ、市場は着実な拡大を見せています。天然魚資源への圧力が高まる中、特に魚介類において、信頼できるタンパク質供給源としての養殖の必要性が加速しています。この構造的な転換により、多様な養殖システムにおいて、効率的かつ拡張性があり、持続可能な養殖事業を支えるために設計された先進的な設備への依存度が高まっています。また、生産性の向上、動物の健康管理、環境の持続可能性の向上において養殖設備が中心的な役割を果たすようになるにつれ、業界も進化しています。現代の水産養殖システムでは、給餌ソリューション、水質管理技術、曝気システム、収穫機器、監視ツールを統合し、円滑な日常業務を確保しています。これらのソリューションは、池養殖、水槽システム、生簀養殖、および循環式養殖設備など、幅広い養殖形態で広く利用されています。機器の進歩は、基本的な機械的支援の域を超え、現在では生産効率の最適化、運用リスクの低減、そして安定した水生環境の維持に重点が置かれています。持続可能な食料生産と生態系への影響低減への関心の高まりは、世界中で技術的に高度な養殖システムの導入をさらに後押ししています。
| 市場範囲 | |
|---|---|
| 開始年 | 2025年 |
| 予測期間 | 2026年~2035年 |
| 開始時の市場規模 | 192億米ドル |
| 予測市場規模 | 343億米ドル |
| CAGR | 6% |
2025年、陸上養殖は104億米ドルを占め、市場における主導的な地位を維持しました。このセグメントが優位を占める理由は、水質、給餌サイクル、魚の健康状態をより適切に管理できる、制御された運営環境にあるからです。沖合養殖と比較して、陸上システムは安定性が高く、環境変動の影響を受けにくいという利点があります。これにより、運営のモニタリングが容易になるだけでなく、生産者はリスクを低減しつつ、安定した生産量を維持することが可能となります。
2025年、商業養殖場セグメントは67.7%のシェアを占めました。このセグメントは、大規模な水産物生産およびサプライチェーンの商業化の中核を成すため、市場を独占しています。これらの養殖場は、水産生物を市場出荷可能なサイズまで育成する役割を担っており、業界において最も経済的に重要な部分となっています。その大規模な生産規模を維持するためには、生産サイクル全体を通じて効率性を保つために、高度な給餌システム、水処理設備、健康モニタリングツール、および収穫技術の継続的な使用が求められます。
米国の水産養殖設備市場は78.9%のシェアを占め、2025年には30億米ドルの市場規模に達しました。同国の市場は、食品の安全性、環境保護、および運営効率を優先する、規制および管理された養殖手法への強い注力によって形成されています。生産者は、安定した酸素濃度、清潔な水質、および効率的な廃棄物管理を保証するシステムへの依存度を高めています。大規模な商業養殖事業においては、耐用年数が長く、耐久性と高性能を兼ね備えた設備の必要性がさらに強調されています。
よくあるご質問
目次
第1章 調査手法と範囲
第2章 エグゼクティブサマリー
第3章 業界洞察
- 業界エコシステム分析
- サプライヤーの情勢
- 利益率
- 各段階における付加価値
- バリューチェーンに影響を与える要因
- 業界への影響要因
- 促進要因
- 業界の潜在的リスク・課題
- 機会
- 成長ポテンシャル分析
- 種別から機器需要への変換フレームワーク
- 養殖魚種プロファイル
- 種と機器の対応表
- 地域ごとの魚種構成が機器市場に与える影響
- 将来の市場動向
- 技術とイノベーションの展望
- 最新技術動向
- IoT、AI、自動化を含む新興技術
- スマート水産養殖および精密農業システム
- 循環式養殖システムの進展
- 遠隔監視と予測分析
- 価格動向
- 1次調査に基づく過去の価格動向分析
- プレーヤータイプ別の価格戦略(プレミアム、バリュー、コストプラス方式を含む)
- 地域ごとの価格変動と主な要因
- 機器種別価格ベンチマーク
- 規制情勢
- 規制フレームワーク
- 規格およびコンプライアンス要件
- 地域の規制フレームワーク
- EPA、FDA、および州規制を含む北米の規制状況
- EUの水産養殖規制およびREACHを含む欧州の規制状況
- アジア太平洋地域の規制状況(各国の養殖政策を含む)
- ラテンアメリカの規制情勢
- 中東・アフリカの規制情勢
- ASC、BAP、Global GAPを含む認証基準
- 環境排出および水質規制
- ポーターの分析
- PESTLE分析
- 貿易データ分析
- 輸出入数量および金額の動向
- 主要貿易ルートと関税の影響
- 地域別貿易収支と純輸入国対純輸出国
- HSコードの分類と貿易データの詳細度
- AIおよび生成AIが市場に与える影響
- AIによる既存ビジネスモデルの変革
- セグメント別の生成AIの使用事例と導入ロードマップ
- リスク、制約、および規制上の考慮事項
- 予測的健康モニタリングおよび疾患検出におけるAI
- 給餌の自動最適化と飼料転換率
- 1次調査に基づく生産能力および生産動向
- 1次調査に基づく地域別および主要生産者別の設備容量
- 1次調査に基づく稼働率と拡張計画
- 製造拠点と地域別生産拠点
第4章 競合情勢
- イントロダクション
- 企業市場シェア分析
- 地域別
- 北米
- 欧州
- アジア太平洋
- ラテンアメリカ
- 中東・アフリカ
- 地域別
- 企業マトリックス分析
- 主要市場企業の競合分析
- 競合ポジショニング・マトリックス
- 主な発展
- 合併・買収
- パートナーシップ・提携
- 新製品の発売
- 事業拡大計画
第5章 市場推計・予測:機器タイプ別、2022年-2035年
- 水循環・移送機器(ポンプ)
- 遠心ポンプ
- 水中ポンプ
- 特殊ポンプ
- 容積式ポンプ
- 曝気・酸素供給装置
- 空気圧縮機
- 送風機
- 酸素発生システム
- 曝気用付属品
- 水処理・調整装置
- 混合装置
- 生物処理
- 物理的処理
- 化学的・高度処理
- 給餌・栄養システム
- 魚類の取り扱い・収穫用機器
- 監視・制御システム
- 構造・封じ込めシステム
- その他の専用機器
第6章 市場推計・予測、機器タイプ別:種別、2022年~2035年
- サケ科魚類
- 海洋性魚類
- 淡水魚
- エビおよび甲殻類
- 二枚貝
- 観賞用およびその他の特殊種
第7章 市場推計・予測:用途別、2022年-2035年
- 陸上型
- 海上型
第8章 市場推計・予測:最終用途別、2022年-2035年
- 商業養殖場
- 孵化場および養殖場
- 観賞魚および水族館関連産業
- 研究・教育機関
- その他
第9章 市場推計・予測:流通チャネル別、2022年-2035年
- 直接販売
- 間接販売
第10章 市場推計・予測:地域別、2022年-2035年
- 北米
- 米国
- カナダ
- 欧州
- ドイツ
- 英国
- フランス
- スペイン
- イタリア
- アジア太平洋
- 中国
- 日本
- インド
- オーストラリア
- 韓国
- ラテンアメリカ
- ブラジル
- メキシコ
- アルゼンチン
- 中東・アフリカ
- 南アフリカ
- サウジアラビア
- UAE
第11章 企業プロファイル
- ティア1:世界の企業(7)
- AKVA Group
- ScaleAQ
- Innovasea
- Xylem
- Grundfos
- Veolia
- Pentair AES
- 第2層:地域トップ企業(7)
- Poseidon Ocean Systems
- VAKI
- Landia A/S
- ELDI
- IAS Products
- Pioneer Group
- CPI Equipment
- Tier 3:niche/specialists(7)
- AquaMaof
- Eruvaka
- Optimar
- AquaScan
- FFF Systems
- AQ1 Systems
- Optiras
- 発行日
- 発行
- Global Market Insights Inc.
- ページ情報
- 英文 230 Pages
- 納期
- 2~3営業日


