
|
市場調査レポート
商品コード
1716650
ワイプ市場の機会、成長促進要因、産業動向分析、2025年~2034年の予測Wipes Market Opportunity, Growth Drivers, Industry Trend Analysis, and Forecast 2025 - 2034 |
||||||
カスタマイズ可能
|
|||||||
| ワイプ市場の機会、成長促進要因、産業動向分析、2025年~2034年の予測 |
|
出版日: 2025年03月04日
発行: Global Market Insights Inc.
ページ情報: 英文 487 Pages
納期: 2~3営業日
|

全表示
- 概要
- 目次
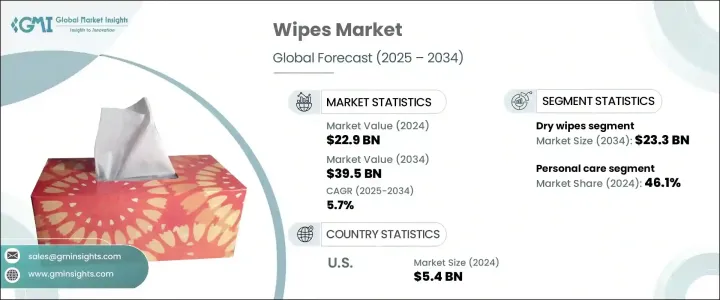
ワイプの世界市場は2024年に229億米ドルとなり、2025年から2034年にかけてCAGR 5.7%で成長すると予測されています。
衛生・公衆衛生用品の需要は近年急増しており、その主な要因は健康意識の高まりと消費者のライフスタイルの進化です。COVID-19の大流行がこの動向を大きく加速させ、個人衛生や表面衛生用の消毒ワイプの広範な採用を誘発しました。人々が清潔さを優先し続ける中、拭き取り製品は家庭、職場、ヘルスケア施設、公共スペースなどで使用され、日常生活に欠かせないものとなっています。消費者は現在、利便性と有効性の両方に対応する多機能で高品質の拭き取り布を期待しています。
持続可能で肌に優しい処方への需要の急増により、市場は顕著な成長を遂げています。各ブランドは、生分解性素材や化学薬品不使用のオプションなど、環境に配慮したイノベーションで対応し、環境意識の高まる購買層にアピールしています。さらに、製造技術の進歩により、ワイプの耐久性と効率が向上し、さまざまな産業で不可欠なものとなっています。拡大するeコマースも市場拡大に重要な役割を果たしており、オンライン・プラットフォームによって、世界中の人々がワイプにアクセスしやすくなっています。
| 市場範囲 | |
|---|---|
| 開始年 | 2024 |
| 予測年 | 2025-2034 |
| 開始金額 | 229億米ドル |
| 予測金額 | 395億米ドル |
| CAGR | 5.7% |
ワイプ産業はウェットワイプとドライワイプに分類されます。2024年、ドライワイプの売上高は136億米ドルでした。乾拭きへの嗜好が高まっているのは、その汎用性と実用性に起因しており、複数の洗浄剤を必要としないです。ドライワイパーは、医療現場で患者のケア、表面衛生、器具の洗浄に広く利用されています。一般家庭でも、素早く効果的なクリーニングのためのオールインワン・ソリューションとして、ドライワイパーが受け入れられています。無害で無香料という選択肢への需要が高まるにつれ、メーカーは敏感なユーザーに対応するため、低アレルギー性や皮膚科学的にテストされた製品の導入を進めています。
ワイプ市場は用途別に、パーソナルケア用、家庭用・ホームクリーニング用、工業用ワイプに区分されます。パーソナルケア用ウェットティッシュが2024年の市場シェアの46.1%を占めました。忙しいライフスタイルを送る都市部の消費者が便利な衛生ソリューションを求めるため、この分野は引き続き成長しています。フェイシャルワイプ、ベビーワイプ、ボディワイプが特に人気で、肌に優しく刺激の少ない製品を求める消費者の嗜好の高まりに合わせ、オーガニックや天然成分を取り入れたブランドが登場しています。ビタミンや保湿剤を加えた製品処方の強化がさらに普及を促進し、毎日のスキンケア習慣に欠かせないものとしてワイプを強化しています。
米国のワイプ市場は2024年に54億米ドルとなり、2034年までCAGR 6%で成長すると予測されています。米国の大手企業は競争力を維持するため、製品の革新と持続可能な事業戦略を活用しています。生分解性包装や植物由来の繊維など、環境に優しいソリューションが人気を集めており、環境意識の高い購買層にアピールしています。化学物質への暴露に対する意識が高まる中、ブランドはオーガニック成分や低刺激性成分に注目し、安全性と有効性を確保しています。皮膚科学的にテストされた高級ワイプへのシフトが市場の状況を形成しており、長期的な成長を促進するための技術革新の重要性が高まっています。
目次
第1章 調査手法と調査範囲
第2章 エグゼクティブサマリー
第3章 業界洞察
- エコシステム分析
- バリューチェーンに影響を与える要因
- 利益率分析
- ディスラプション
- 将来の展望
- メーカー
- 流通業者
- サプライヤーの状況
- 利益率分析
- 原材料分析
- 主要ニュース&イニシアチブ
- 規制状況
- 影響要因
- 促進要因
- 急速な都市化とライフスタイルの変化
- ホスピタリティ部門の成長
- 消費者の衛生意識の高まり
- 可処分所得の増加
- 業界の潜在的リスク&課題
- 市場の飽和と激しい競合
- 原材料価格の変動
- 促進要因
- 成長可能性分析
- ポーター分析
- PESTEL分析
第4章 競合情勢
- イントロダクション
- 企業シェア分析
- 競合のポジショニング・マトリックス
- 戦略展望マトリックス
第5章 市場推計・予測:タイプ別、2021年~2034年
- 主要動向
- ウェットワイプ
- ドライワイプ
第6章 市場推計・予測:用途別、2021年~2034年
- 主要動向
- パーソナルケア
- ベビーワイプ
- クレンジングワイプ
- 衛生用品
- ペットケア
- 家庭用・住宅清掃
- キッチン用ワイプ
- 浴室用ワイプ
- フードサービス用ワイプ
- 産業用ワイプ
第7章 市場推計・予測:素材別、2021年~2034年
- 主要動向
- 綿
- ポリエステル
- ビスコース
- その他
第8章 市場推計・予測:ユーザビリティ別、2021年~2034年
- 主要動向
- 使い捨て
- 再利用可能
第9章 市場推計・予測:価格帯別、2021年~2034年
- 主要動向
- 低価格
- 中価格
- 高価格
第10章 市場推計・予測:流通チャネル別、2021年~2034年
- 主要動向
- オンライン
- eコマースサイト
- 自社サイト
- オフライン
- ハイパーマーケット・スーパーマーケット
- 医薬品・ドラッグストア
- その他の小売店
第11章 市場推計・予測:地域別、2021年~2034年
- 主要動向
- 北米
- 米国
- カナダ
- 欧州
- 英国
- ドイツ
- フランス
- イタリア
- スペイン
- ロシア
- アジア太平洋
- 中国
- インド
- 日本
- 韓国
- オーストラリア
- ラテンアメリカ
- ブラジル
- メキシコ
- 中東・アフリカ
- 南アフリカ
- サウジアラビア
- アラブ首長国連邦
第12章 企業プロファイル
- 3M
- BASF SE
- Bayer AG
- Johnson &Johnson
- Kimberly-Clark Corporation
- Procter &Gamble
- Reckitt Benckiser Group plc
- Suominen Corporation
- The Clorox Company
- Unilever
The Global Wipes Market was valued at USD 22.9 billion in 2024 and is projected to grow at a CAGR of 5.7% between 2025 and 2034. The demand for hygiene and sanitation products has skyrocketed in recent years, primarily fueled by increased health awareness and evolving consumer lifestyles. The COVID-19 pandemic significantly accelerated this trend, triggering widespread adoption of disinfectant wipes for personal and surface hygiene. As people continue prioritizing cleanliness, wipes have become an essential part of daily routines, used in homes, workplaces, healthcare facilities, and public spaces. Consumers now expect multi-functional, high-quality wipes that cater to both convenience and effectiveness.
The market is experiencing notable growth due to a surge in demand for sustainable and skin-friendly formulations. Brands are responding with eco-conscious innovations, such as biodegradable materials and chemical-free options, appealing to the rising number of environmentally aware buyers. Additionally, advancements in manufacturing technologies have improved the durability and efficiency of wipes, making them indispensable across multiple industries. The expanding e-commerce landscape is also playing a crucial role in market expansion, with online platforms making wipes more accessible to a global audience.
| Market Scope | |
|---|---|
| Start Year | 2024 |
| Forecast Year | 2025-2034 |
| Start Value | $22.9 Billion |
| Forecast Value | $39.5 Billion |
| CAGR | 5.7% |
The wipes industry is categorized into wet wipes and dry wipes. In 2024, the dry wipes segment accounted for USD 13.6 billion in revenue. The increasing preference for dry wipes stems from their versatility and practicality, eliminating the need for multiple cleaning products. They are widely utilized in medical environments for patient care, surface sanitation, and equipment cleaning. Households are also embracing dry wipes as an all-in-one solution for quick and effective cleaning. As the demand for non-toxic and fragrance-free options rises, manufacturers are introducing hypoallergenic and dermatologically tested variants to cater to sensitive users.
By application, the wipes market is segmented into personal care, household and home cleaning, and industrial wipes. Personal care wipes dominated the market in 2024, holding a 46.1% share. The segment continues to thrive as urban consumers with busy lifestyles seek convenient hygiene solutions. Facial wipes, baby wipes, and body wipes are particularly popular, with brands incorporating organic and natural ingredients to align with growing consumer preference for skin-friendly and non-irritating products. Enhanced product formulations with added vitamins and moisturizing agents further drive adoption, reinforcing wipes as an integral part of daily skincare routines.
The U.S. wipes market was valued at USD 5.4 billion in 2024 and is anticipated to grow at a CAGR of 6% through 2034. Major players in the U.S. are leveraging product innovation and sustainable business strategies to maintain a competitive edge. Eco-friendly solutions, such as biodegradable packaging and plant-based fibers, are gaining traction, appealing to environmentally conscious buyers. With increasing awareness of chemical exposure, brands are focusing on organic and hypoallergenic ingredients, ensuring safety and effectiveness. The shift toward premium, dermatologically tested wipes is shaping the market landscape, reinforcing the importance of innovation in driving long-term growth.
Table of Contents
Chapter 1 Methodology & Scope
- 1.1 Market scope & definitions
- 1.2 Base estimates & calculations
- 1.3 Forecast calculations
- 1.4 Data sources
- 1.4.1 Primary
- 1.4.2 Secondary
- 1.4.2.1 Paid sources
- 1.4.2.2 Public sources
Chapter 2 Executive Summary
- 2.1 Industry 3600 synopsis, 2021-2034
Chapter 3 Industry Insights
- 3.1 Industry ecosystem analysis
- 3.1.1 Factor affecting the value chain
- 3.1.2 Profit margin analysis
- 3.1.3 Disruptions
- 3.1.4 Future outlook
- 3.1.5 Manufacturers
- 3.1.6 Distributors
- 3.2 Supplier landscape
- 3.3 Profit margin analysis
- 3.4 Raw material analysis
- 3.5 Key news & initiatives
- 3.6 Regulatory landscape
- 3.7 Impact forces
- 3.7.1 Growth drivers
- 3.7.1.1 Rapid urbanization and lifestyle changes
- 3.7.1.2 Growing hospitality sector
- 3.7.1.3 Increasing consumer awareness on hygiene
- 3.7.1.4 Increasing disposable income
- 3.7.2 Industry pitfalls & challenges
- 3.7.2.1 Market saturation and intense competition
- 3.7.2.2 Fluctuating raw material prices
- 3.7.1 Growth drivers
- 3.8 Growth potential analysis
- 3.9 Porter's analysis
- 3.10 PESTEL analysis
Chapter 4 Competitive Landscape, 2024
- 4.1 Introduction
- 4.2 Company market share analysis
- 4.3 Competitive positioning matrix
- 4.4 Strategic outlook matrix
Chapter 5 Market Estimates & Forecast, By Type, 2021 - 2034 (USD Billion) (Million Units)
- 5.1 Key trends
- 5.2 Wet wipes
- 5.3 Dry wipes
Chapter 6 Market Estimates & Forecast, By Application, 2021 - 2034 (USD Billion) (Million Units)
- 6.1 Key trends
- 6.2 Personal care
- 6.2.1 Baby wipes
- 6.2.2 Cleansing wipes
- 6.2.3 Personal hygiene
- 6.2.4 Pet care wipes
- 6.3 Household and home cleaning
- 6.3.1 Kitchen wipes
- 6.3.2 Bathroom wipes
- 6.3.3 Food service wipes
- 6.4 Industrial wipes
Chapter 7 Market Estimates & Forecast, By Material, 2021 - 2034 (USD Billion) (Million Units)
- 7.1 Key trends
- 7.2 Cotton
- 7.3 Polyester
- 7.4 Viscose
- 7.5 Others
Chapter 8 Market Estimates & Forecast, By Usability, 2021 - 2034 (USD Billion) (Million Units)
- 8.1 Key trends
- 8.2 Disposable
- 8.3 Reusable
Chapter 9 Market Estimates & Forecast, By Price Range, 2021 - 2034 (USD Billion) (Million Units)
- 9.1 Key trends
- 9.2 Low
- 9.3 Mid
- 9.4 High
Chapter 10 Market Estimates & Forecast, By Distribution Channel, 2021 - 2034 (USD Billion) (Million Units)
- 10.1 Key trends
- 10.2 Online
- 10.2.1 E-commerce websites
- 10.2.2 Company-owned websites
- 10.3 Offline
- 10.3.1 Hypermarkets and supermarkets
- 10.3.2 Pharmaceutical and drug store
- 10.3.3 Other retail stores
Chapter 11 Market Estimates & Forecast, By Region, 2021 - 2034 (USD Billion) (Million Units)
- 11.1 Key trends
- 11.2 North America
- 11.2.1 U.S.
- 11.2.2 Canada
- 11.3 Europe
- 11.3.1 UK
- 11.3.2 Germany
- 11.3.3 France
- 11.3.4 Italy
- 11.3.5 Spain
- 11.3.6 Russia
- 11.4 Asia Pacific
- 11.4.1 China
- 11.4.2 India
- 11.4.3 Japan
- 11.4.4 South Korea
- 11.4.5 Australia
- 11.5 Latin America
- 11.5.1 Brazil
- 11.5.2 Mexico
- 11.6 MEA
- 11.6.1 South Africa
- 11.6.2 Saudi Arabia
- 11.6.3 UAE
Chapter 12 Company Profiles
- 12.1 3M
- 12.2 BASF SE
- 12.3 Bayer AG
- 12.4 Johnson & Johnson
- 12.5 Kimberly-Clark Corporation
- 12.6 Procter & Gamble
- 12.7 Reckitt Benckiser Group plc
- 12.8 Suominen Corporation
- 12.9 The Clorox Company
- 12.10 Unilever

