
|
市場調査レポート
商品コード
1698570
スマートビルディング市場の機会、成長促進要因、産業動向分析、2025年~2034年の予測Smart Building Market Opportunity, Growth Drivers, Industry Trend Analysis, and Forecast 2025-2034 |
||||||
カスタマイズ可能
|
|||||||
| スマートビルディング市場の機会、成長促進要因、産業動向分析、2025年~2034年の予測 |
|
出版日: 2025年02月11日
発行: Global Market Insights Inc.
ページ情報: 英文 190 Pages
納期: 2~3営業日
|

全表示
- 概要
- 目次
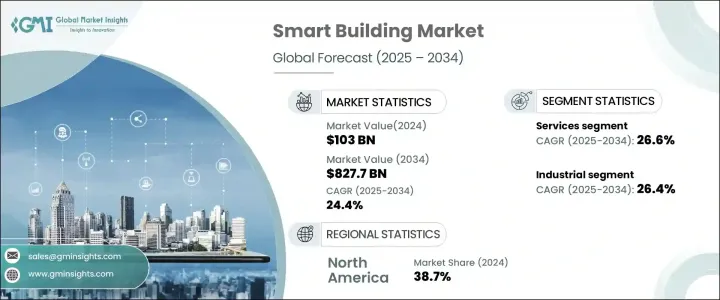
スマートビルディングの世界市場規模は2024年に1,030億米ドルとなり、2025年から2034年にかけてCAGR24.4%で成長すると予測されています。
この産業の拡大には、エネルギー効率、持続可能性、生産性の向上に対する需要の高まりが寄与しています。5G、IoT、AI、高度なデータ分析の急速な導入は、市場の展望を変えています。さらに、サービスとしてのビル管理システムへの移行が、市場の成長をさらに加速させています。企業や住宅所有者は、業務の最適化、コスト削減、進化する規制への準拠を目的に、スマートテクノロジーへの投資を増やしています。政府や規制機関もエネルギー効率化イニシアチブを推進しており、インテリジェント・ビルディング・ソリューションの幅広い採用を促しています。
エネルギー効率化の必要性は、スマートビルディング業界の主要な推進力となっています。エネルギー消費削減の重要性が高まる中、IoT、オートメーション、エネルギー管理ソフトウェアは、エネルギー使用の最適化において重要な役割を果たしています。AIを搭載したHVACシステムは、居住状況や気象条件に基づいて空調制御を動的に調整し、エネルギーの無駄を最小限に抑えます。規制の枠組みが強化されたことで、企業は持続可能性の目標に沿ったスマート・ソリューションの統合を迫られています。高度な監視システムは、エネルギー消費パターンを追跡し、不動産所有者が運用効率を高めるための情報に基づいた意思決定を行うのを支援します。
| 市場範囲 | |
|---|---|
| 開始年 | 2024 |
| 予測年 | 2025-2034 |
| 開始金額 | 1,030億米ドル |
| 予測金額 | 8,277億米ドル |
| CAGR | 24.4% |
AIとIoTは、リアルタイムのデータ分析と予測的洞察を可能にすることで、スマートビルディングの未来を再構築しています。IoTは継続的なモニタリングを容易にし、AIは非効率を特定して解決策を推奨します。スマートシステムは、エネルギー使用、水消費、廃棄物生成を管理し、より持続可能なエコシステムを構築します。AIを活用した予知保全の統合は、ダウンタイムを削減し、システム障害を未然に防ぎます。クラウドベースのプラットフォームは、重要なビル機能のシームレスな自動化を可能にすることで、効率をさらに高めます。
テクノロジー主導のイノベーションはビル管理を変革し続け、より大きなコントロール、セキュリティ、利便性を提供します。AI、IoT、クラウドコンピューティングは、リアルタイムの監視と自動化を大幅に改善し、管理者がデータに基づいた意思決定を行えるようにしました。予知保全は、潜在的な問題にプロアクティブに対処することで、円滑な運用を保証します。このような進歩により、スマートビルディングはますます効率的で費用対効果が高く、環境に優しくなっています。
競争力の維持を目指す企業は、AI主導のエネルギー管理ソリューションへの投資を優先しています。リアルタイムの稼働状況、気象条件、使用動向に基づいてビル運営を最適化する能力は極めて重要です。グリーンビルディング認証の採用も、環境意識の高い顧客を引き付け、持続可能性規制に準拠するための重要な戦略となっています。
市場はソリューションとサービスに区分され、サービス分野はCAGR 26.6%で成長すると予測されます。予知保全サービスに対する需要の高まりが、この成長の主な要因です。2023年に633億米ドルとなるソリューション分野には、エネルギー管理、安全・セキュリティ管理、統合ワークプレイスシステム、ネットワーク管理などが含まれます。HVAC制御、照明管理、節水システムなどのスマート・インフラ・ソリューションが人気を集めています。
2024年には、商業セグメントが市場の51.7%を占め、優位を占めるとみられます。北米が38.7%のシェアでリードしているが、これはエネルギー効率重視の傾向が強まっていることが背景にあります。米国では、2024年の市場規模は306億米ドルで、企業や住宅所有者がエネルギー使用を最適化し二酸化炭素排出量を削減するスマート・ソリューションを採用する傾向が強まっています。
目次
第1章 調査手法と調査範囲
- 市場範囲と定義
- 基本推定と計算
- 予測計算
- データソース
第2章 エグゼクティブサマリー
第3章 業界洞察
- エコシステム分析
- バリューチェーンに影響を与える要因
- 利益率分析
- 破壊
- 将来の展望
- メーカー
- 流通業者
- サプライヤーの状況
- 利益率分析
- 主要ニュース
- 規制状況
- 影響要因
- 促進要因
- エネルギー効率と持続可能性の重要性の高まり
- スマートビルディングディングの技術的進歩
- コスト削減と業務効率化
- 政府の規制とインセンティブ
- 業界の潜在的リスク&課題
- 高まるサイバーセキュリティへの懸念
- 初期コストの高さ
- 促進要因
- 成長可能性分析
- ポーター分析
- PESTEL分析
第4章 競合情勢
- イントロダクション
- 企業シェア分析
- 競合のポジショニング・マトリックス
- 戦略展望マトリックス
第5章 市場推計・予測:コンポーネント別、2021年~2034年
- 主要動向
- ソリューション
- 安全・セキュリティ管理
- 入退室管理システム
- ビデオ監視システム
- 火災・生活安全システム
- エネルギー管理
- HVAC制御システム
- 照明管理システム
- その他
- 建物インフラ管理
- 駐車場管理システム
- 水管理システム
- その他
- 統合ワークプレイスマネジメントシステム(IWMS)
- 不動産管理
- 資本プロジェクト管理
- 施設管理
- オペレーション・サービス管理
- 環境・エネルギー管理
- ネットワーク管理
- 有線技術
- 無線技術
- 安全・セキュリティ管理
- サービス
第6章 市場推計・予測:最終用途別、2021年~2034年
- 主要動向
- 住宅
- 商業
- ヘルスケア
- 小売
- アカデミック
- その他
- 産業
第7章 市場推計・予測:地域別、2021年~2034年
- 主要動向
- 北米
- 米国
- カナダ
- 欧州
- 英国
- ドイツ
- フランス
- スウェーデン
- オランダ
- ロシア
- アジア太平洋
- 中国
- インド
- 日本
- 韓国
- オーストラリア
- ラテンアメリカ
- ブラジル
- メキシコ
- 中東・アフリカ
- 南アフリカ
- サウジアラビア
- アラブ首長国連邦
第8章 企業プロファイル
- ABB
- Azbil corporation
- Cisco
- Hitachi ltd
- Honeywell
- Huawei
- IBM
- Intel Corporation
- legrand
- Microsoft Corporation
- Schneider Electric SE
- Siemens AG
- Johnsons controls
- NEC Corporation
- Nexii Building Solutions Inc
The Global Smart Building Market was valued at USD 103 billion in 2024 and is expected to grow at a CAGR of 24.4% from 2025 to 2034. The expansion of this industry is fueled by the rising demand for energy efficiency, sustainability, and improved productivity. The rapid adoption of 5G, IoT, AI, and advanced data analytics is transforming the market landscape. Additionally, the transition toward building management systems as a service is further accelerating market growth. Businesses and residential property owners are increasingly investing in smart technologies to optimize operations, reduce costs, and comply with evolving regulations. Governments and regulatory bodies are also pushing energy efficiency initiatives, encouraging wider adoption of intelligent building solutions.
The need for energy efficiency has become a major driver of the smart building industry. As energy consumption reduction gains importance, IoT, automation, and energy management software play a crucial role in optimizing energy usage. AI-powered HVAC systems dynamically adjust climate control based on occupancy and weather conditions, minimizing energy waste. Stricter regulatory frameworks are compelling businesses to integrate smart solutions that align with sustainability goals. Advanced monitoring systems track energy consumption patterns, helping property owners make informed decisions that enhance operational efficiency.
| Market Scope | |
|---|---|
| Start Year | 2024 |
| Forecast Year | 2025-2034 |
| Start Value | $103 Billion |
| Forecast Value | $827.7 Billion |
| CAGR | 24.4% |
AI and IoT are reshaping the future of smart buildings by enabling real-time data analysis and predictive insights. IoT facilitates continuous monitoring, while AI identifies inefficiencies and recommends solutions. Smart systems manage energy use, water consumption, and waste production, creating a more sustainable ecosystem. The integration of AI-powered predictive maintenance reduces downtime, preventing system failures before they occur. Cloud-based platforms further enhance efficiency by enabling seamless automation of critical building functions.
Technology-driven innovations continue to transform building management, providing greater control, security, and convenience. AI, IoT, and cloud computing have significantly improved real-time monitoring and automation, allowing administrators to make data-driven decisions. Predictive maintenance ensures smooth operations by proactively addressing potential issues. With these advancements, smart buildings are becoming increasingly efficient, cost-effective, and environmentally friendly.
Companies aiming to stay competitive are prioritizing investments in AI-driven energy management solutions. The ability to optimize building operations based on real-time occupancy, weather conditions, and usage trends is crucial. Adopting green building certifications has also become a key strategy for attracting environmentally conscious clients and complying with sustainability regulations.
The market is segmented into solutions and services, with the services segment projected to grow at a CAGR of 26.6%. The increasing demand for predictive maintenance services is a key factor behind this growth. The solutions segment, valued at USD 63.3 billion in 2023, includes energy management, safety and security management, integrated workplace systems, and network management. Smart infrastructure solutions such as HVAC control, lighting management, and water conservation systems are gaining traction.
The commercial segment is set to dominate, accounting for 51.7% of the market in 2024. North America leads with a 38.7% share, driven by the growing emphasis on energy efficiency. In the United States, the market was valued at USD 30.6 billion in 2024, with businesses and homeowners increasingly adopting smart solutions to optimize energy use and reduce carbon footprints.
Table of Contents
Chapter 1 Methodology & Scope
- 1.1 Market scope & definitions
- 1.2 Base estimates & calculations
- 1.3 Forecast calculations
- 1.4 Data sources
- 1.4.1 Primary
- 1.4.2 Secondary
- 1.4.2.1 Paid sources
- 1.4.2.2 Public sources
Chapter 2 Executive Summary
- 2.1 Industry synopsis, 2021-2034
Chapter 3 Industry Insights
- 3.1 Industry ecosystem analysis
- 3.1.1 Factor affecting the value chain
- 3.1.2 Profit margin analysis
- 3.1.3 Disruptions
- 3.1.4 Future outlook
- 3.1.5 Manufacturers
- 3.1.6 Distributors
- 3.2 Supplier landscape
- 3.3 Profit margin analysis
- 3.4 Key news & initiatives
- 3.5 Regulatory landscape
- 3.6 Impact forces
- 3.6.1 Growth drivers
- 3.6.1.1 Growing importance of energy efficiency and sustainability
- 3.6.1.2 Technological advancement in smart buildings
- 3.6.1.3 Cost savings and operational efficiency
- 3.6.1.4 Government regulations and incentives
- 3.6.2 Industry pitfalls & challenges
- 3.6.2.1 Rising cybersecurity concern
- 3.6.2.2 High initial cost
- 3.6.1 Growth drivers
- 3.7 Growth potential analysis
- 3.8 Porter's analysis
- 3.9 PESTEL analysis
Chapter 4 Competitive Landscape, 2024
- 4.1 Introduction
- 4.2 Company market share analysis
- 4.3 Competitive positioning matrix
- 4.4 Strategic outlook matrix
Chapter 5 Market Estimates & Forecast, By Component, 2021-2034 (USD Billion)
- 5.1 Key trends
- 5.2 Solution
- 5.2.1 Safety & security management
- 5.2.1.1 Access control system
- 5.2.1.2 Video surveillance system
- 5.2.1.3 Fire and life safety system
- 5.2.2 Energy Management
- 5.2.2.1 HVAC control system
- 5.2.2.2 Lighting management system
- 5.2.2.3 Others
- 5.2.3 Building infrastructure management
- 5.2.3.1 Parking management system
- 5.2.3.2 Water management system
- 5.2.3.3 Others
- 5.2.4 Integrated Workplace Management System (IWMS)
- 5.2.4.1 Real estate management
- 5.2.4.2 Capital project management
- 5.2.4.3 Facility management
- 5.2.4.4 Operations and services management
- 5.2.4.5 Environment and energy management
- 5.2.5 Network management
- 5.2.5.1 Wired technology
- 5.2.5.2 Wireless technology
- 5.2.1 Safety & security management
- 5.3 Service
Chapter 6 Market Estimates & Forecast, By End Use, 2021-2034 (USD Billion)
- 6.1 Key trends
- 6.2 Residential
- 6.3 Commercial
- 6.3.1 Healthcare
- 6.3.2 Retail
- 6.3.3 Academic
- 6.3.4 Others
- 6.4 Industrial
Chapter 7 Market Estimates & Forecast, By Region, 2021-2034 (USD Billion)
- 7.1 Key trends
- 7.2 North America
- 7.2.1 U.S.
- 7.2.2 Canada
- 7.3 Europe
- 7.3.1 UK
- 7.3.2 Germany
- 7.3.3 France
- 7.3.4 Sweden
- 7.3.5 Netherlands
- 7.3.6 Russia
- 7.4 Asia Pacific
- 7.4.1 China
- 7.4.2 India
- 7.4.3 Japan
- 7.4.4 South Korea
- 7.4.5 Australia
- 7.5 Latin America
- 7.5.1 Brazil
- 7.5.2 Mexico
- 7.6 MEA
- 7.6.1 South Africa
- 7.6.2 Saudi Arabia
- 7.6.3 UAE
Chapter 8 Company Profiles
- 8.1 ABB
- 8.2 Azbil corporation
- 8.3 Cisco
- 8.4 Hitachi ltd
- 8.5 Honeywell
- 8.6 Huawei
- 8.7 IBM
- 8.8 Intel Corporation
- 8.9 legrand
- 8.10 Microsoft Corporation
- 8.11 Schneider Electric SE
- 8.12 Siemens AG
- 8.13 Johnsons controls
- 8.14 NEC Corporation
- 8.15 Nexii Building Solutions Inc

