
|
市場調査レポート
商品コード
1699396
高電圧ケーブル市場の機会、成長促進要因、産業動向分析、2025年~2034年の予測High Voltage Cable Market Opportunity, Growth Drivers, Industry Trend Analysis, and Forecast 2025-2034 |
||||||
カスタマイズ可能
|
|||||||
| 高電圧ケーブル市場の機会、成長促進要因、産業動向分析、2025年~2034年の予測 |
|
出版日: 2025年02月26日
発行: Global Market Insights Inc.
ページ情報: 英文 137 Pages
納期: 2~3営業日
|

全表示
- 概要
- 目次
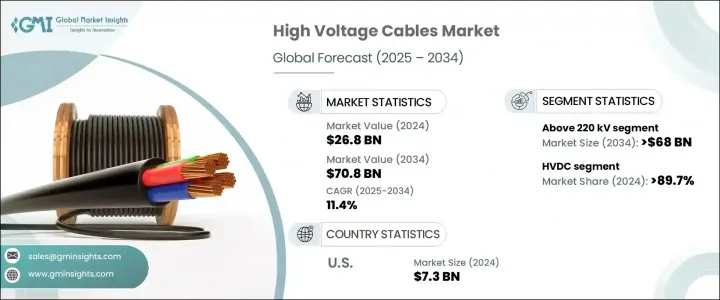
世界の高電圧ケーブル市場は、2024年に268億米ドルに達し、2025年から2034年にかけてCAGR 11.4%で拡大すると予測されています。
老朽化した電気インフラのアップグレードや改修への注目が高まっていることに加え、世界中で送電網の拡張に多額の投資が行われていることが、業界の成長を後押ししています。特に新興経済諸国は、既存の電力インフラの格差に対処するため、信頼性が高く効率的な送電網システムの開発を優先しています。エネルギー需要の増加により、電力網の近代化への取り組みが強化され、官民ともにこの移行を支援するために多額の投資を行っています。さらに、再生可能エネルギー源の統合に向けた動きが、高度なトランスミッション技術の必要性を高めています。地下・海底ケーブルシステムの導入が進むにつれ、持続可能性がさらに強化され、信頼性と環境保護の面で長期的なメリットがもたらされています。
ケーブル業界は電圧によって、110kV未満、110kV~220kV、220kV以上の3つのセグメントに分類しています。110 kV未満のケーブルは、主に都市の配電網と再生可能エネルギーの接続をサポートします。この分野は、急速な都市化と安定した配電網の需要により、2034年までにCAGR 25%以上で拡大すると予測されています。都市部での人口増加と進行中のインフラプロジェクトにより、普及が進むと予想されます。
| 市場範囲 | |
|---|---|
| 開始年 | 2024 |
| 予測年 | 2025-2034 |
| 開始金額 | 268億米ドル |
| 予測金額 | 708億米ドル |
| CAGR | 11.4% |
高電圧ケーブルもHVACとHVDCに分類されます。HVDCセグメントは2024年の市場シェアの89.7%以上を占め、業界における優位性を示しています。長距離での電力損失を低減するために設計された大容量導体の採用が、HVDC市場の拡大を強化しています。コスト効率に優れ、大規模なエネルギー・トランスミッションに効率的であることから、特に大規模なグリッド・ネットワークへの導入が加速しています。トランスミッション中のエネルギー損失を最小限に抑え、長距離送電をサポートすることにますます注目が集まっていることが、HVDC技術の需要をさらに押し上げています。
米国の高電圧ケーブル市場は、2022年に1億米ドル、2023年に5,000万米ドル、2024年に73億米ドルと、顕著な金額の変動を経験しています。再生可能エネルギー・プロジェクトへの投資の増加、電力網の近代化の進行、信頼性の高い送電網の必要性の高まりにより、市場はさらに拡大すると見られています。持続可能性の目標を達成し、配電を改善するためにエネルギー・インフラの強化が重視されていることが、業界の持続的成長に寄与しています。
目次
第1章 調査手法と調査範囲
第2章 エグゼクティブサマリー
第3章 業界洞察
- エコシステム分析
- 規制状況
- 業界への影響要因
- 促進要因
- 業界の潜在的リスク&課題
- 成長ポテンシャル分析
- ポーター分析
- PESTEL分析
第4章 競合情勢
- 戦略ダッシュボード
- イノベーションと持続可能性の展望
第5章 市場規模・予測:電圧別、2021年~2034年
- 主要動向
- 110 kV未満
- 110 kV-220 kV
- 220 kV以上
第6章 市場規模・予測:電流別、2021年~2034年
- 主要動向
- HVAC
- HVDC
第7章 市場規模・予測:設置別、2021年~2034年
- 主要動向
- 架空
- 海底
- 地中
第8章 市場規模・予測:地域別、2021年~2034年
- 主要動向
- 北米
- 米国
- カナダ
- 欧州
- ドイツ
- イタリア
- スペイン
- オランダ
- 英国
- アジア太平洋
- 中国
- 日本
- インド
- タイ
- インドネシア
- 世界のその他の地域
- ブラジル
- メキシコ
- 南アフリカ
第9章 企業プロファイル
- alfanar Group
- Brugg Kabel
- Ducab
- Elsewedy Electric
- Furukawa Electric
- Gupta Power
- Iljin Electric
- Jeddah Cables
- LS Cable &System
- Mitsubishi Electric
- Nexans
- NKT
- Power Plus Cable
- Prysmian Group
- Riyadh Cables
- Southwire Company
- Sumitomo Electric Industries
- Taihan Cables &Solution
- TF Kable
- ZMS Cable
- ZTT
The Global High Voltage Cable Market reached USD 26.8 billion in 2024 and is projected to expand at a CAGR of 11.4% from 2025 to 2034. The increasing focus on upgrading and refurbishing aging electrical infrastructure, along with significant investments in grid network expansion worldwide, is driving industry growth. Emerging economies, in particular, are prioritizing the development of reliable and efficient grid systems to address gaps in their existing power infrastructure. The rising energy demand has intensified efforts to modernize electrical networks, with both public and private sectors investing heavily to support this transition. Additionally, the push toward integrating renewable energy sources has contributed to the need for advanced transmission technologies. The growing deployment of underground and subsea cable systems is further enhancing sustainability, offering long-term benefits in terms of reliability and environmental protection.
The industry categorizes cables based on voltage into three segments: below 110 kV, 110 kV to 220 kV, and above 220 kV. Cables under 110 kV primarily support urban distribution networks and renewable energy connections. This segment is forecasted to expand at a CAGR exceeding 25% by 2034 due to rapid urbanization and the demand for stable power distribution networks. Expanding populations in urban areas, along with ongoing infrastructure projects, are expected to drive widespread adoption.
| Market Scope | |
|---|---|
| Start Year | 2024 |
| Forecast Year | 2025-2034 |
| Start Value | $26.8 Billion |
| Forecast Value | $70.8 Billion |
| CAGR | 11.4% |
High voltage cables are also classified into HVAC and HVDC categories. The HVDC segment accounted for over 89.7% of the market share in 2024, demonstrating its dominance in the industry. The adoption of high-capacity conductors designed to reduce power losses over long distances is reinforcing HVDC market expansion. Its cost-effective nature and efficiency in large-scale energy transmission are accelerating deployment, particularly for extensive grid networks. The increasing focus on minimizing energy loss during transmission and supporting long-distance power transfers is further boosting the demand for HVDC technology.
The U.S. high voltage cable market has experienced notable fluctuations in value, reaching USD 0.1 billion in 2022, USD 0.05 billion in 2023, and USD 7.3 billion in 2024. The market is set to witness further expansion due to rising investments in renewable energy projects, ongoing modernization of electric grids, and the growing necessity for a reliable power transmission network. The emphasis on strengthening energy infrastructure to meet sustainability goals and improve electricity distribution is contributing to sustained industry growth.
Table of Contents
Chapter 1 Methodology & Scope
- 1.1 Market definitions
- 1.2 Base estimates & calculations
- 1.3 Forecast calculation
- 1.4 Data sources
- 1.4.1 Primary
- 1.4.2 Secondary
- 1.4.2.1 Paid
- 1.4.2.2 Public
Chapter 2 Executive Summary
- 2.1 Industry synopsis, 2021 – 2034
Chapter 3 Industry Insights
- 3.1 Industry ecosystem analysis
- 3.2 Regulatory landscape
- 3.3 Industry impact forces
- 3.3.1 Growth drivers
- 3.3.2 Industry pitfalls & challenges
- 3.4 Growth potential analysis
- 3.5 Porter's analysis
- 3.5.1 Bargaining power of suppliers
- 3.5.2 Bargaining power of buyers
- 3.5.3 Threat of new entrants
- 3.5.4 Threat of substitutes
- 3.6 PESTEL analysis
Chapter 4 Competitive landscape, 2024
- 4.1 Strategic dashboard
- 4.2 Innovation & sustainability landscape
Chapter 5 Market Size and Forecast, By Voltage, 2021 – 2034 (km, USD Billion)
- 5.1 Key trends
- 5.2 < 110 kV
- 5.3 110 kV - 220 kV
- 5.4 > 220 kV
Chapter 6 Market Size and Forecast, By Current, 2021 – 2034 (km, USD Billion)
- 6.1 Key trends
- 6.2 HVAC
- 6.3 HVDC
Chapter 7 Market Size and Forecast, By Installation, 2021 – 2034 (km, USD Billion)
- 7.1 Key trends
- 7.2 Overhead
- 7.3 Submarine
- 7.4 Underground
Chapter 8 Market Size and Forecast, By Region, 2021 – 2034 (km, USD Billion)
- 8.1 Key trends
- 8.2 North America
- 8.2.1 U.S.
- 8.2.2 Canada
- 8.3 Europe
- 8.3.1 Germany
- 8.3.2 Italy
- 8.3.3 Spain
- 8.3.4 Netherlands
- 8.3.5 UK
- 8.4 Asia Pacific
- 8.4.1 China
- 8.4.2 Japan
- 8.4.3 India
- 8.4.4 Thailand
- 8.4.5 Indonesia
- 8.5 Rest of World
- 8.5.1 Brazil
- 8.5.2 Mexico
- 8.5.3 South Africa
Chapter 9 Company Profiles
- 9.1 alfanar Group
- 9.2 Brugg Kabel
- 9.3 Ducab
- 9.4 Elsewedy Electric
- 9.5 Furukawa Electric
- 9.6 Gupta Power
- 9.7 Iljin Electric
- 9.8 Jeddah Cables
- 9.9 LS Cable & System
- 9.10 Mitsubishi Electric
- 9.11 Nexans
- 9.12 NKT
- 9.13 Power Plus Cable
- 9.14 Prysmian Group
- 9.15 Riyadh Cables
- 9.16 Southwire Company
- 9.17 Sumitomo Electric Industries
- 9.18 Taihan Cables & Solution
- 9.19 TF Kable
- 9.20 ZMS Cable
- 9.21 ZTT

