|
|
市場調査レポート
商品コード
1430682
スープの世界市場 - 市場規模、機会(2023年版)Global Soups Market Size and Opportunities, 2023 Update |
||||||
|
|
|||||||
|
● お客様のご希望に応じて、既存データの加工や未掲載情報(例:国別セグメント)の追加などの対応が可能です。 詳細はお問い合わせください。 |
|||||||


| スープの世界市場 - 市場規模、機会(2023年版) |
|
出版日: 2023年12月29日
発行: GlobalData
ページ情報: 英文 146 Pages
納期: 即納可能
|
- 全表示
- 概要
- 図表
- 目次
世界のスープ部門の市場規模は、2022年の223億米ドルから2027年に283億米ドルに達し、CAGRで4.9%の成長が見込まれます。金額ベースでは、2022年に常温スープのシェアが40.3%で最大のカテゴリとなります。乾燥スープ(ミックス)の金額シェアは2022年の39.7%から2027年に45.2%に拡大します。消費者の購買力の向上と、主要メーカーによる生産能力拡大への投資が、この部門の将来の成長を可能にします。常温スープが2022年にこの部門の数量の59.8%を占めました。
当レポートでは、世界のスープ市場について調査分析し、各地域の市場規模、成長促進要因、最新の発展、将来の課題などの情報を提供しています。
目次
第1章 部門の概要
- 現在のシナリオと将来の見通し
- 世界のスープ部門の概要 - 成長要因、最新の発展、将来の抑制要因は何か
- 地域のスープの概要 - 成長要因、最新の発展、将来の抑制要因は何か
- 世界のスープ部門における主な課題
第2章 スープの消費パターンの変化
- スープ部門全体における消費レベルの変化(2017年~2027年)
- 消費パターンの変化の理由
第3章 潜在力の高い国の特定
- リスクリワード分析に基づく10ヶ国の分析(市場の評価、経済発展、社会人口学的要因、ガバナンス指標、技術インフラ)
第4章 国の詳細
- 潜在力の高い国の分析
- 主要動向
第5章 ヘルス・ウェルネスの分析
- 世界と地域
- 成長寄与:地域別
- 主な製品の属性
- 主な消費者の利益
- 主要ヘルス・ウェルネス企業:カテゴリ別
第6章 競合環境
- 主要企業(金額)- 世界
- 企業とブランドのシェア分析 - 世界
- 企業とブランドのシェア分析:地域別
第7章 競合情勢 - 市場の分析
第8章 プライベートブランドの市場シェア
- プライベートブランドのシェア分析:地域別
- プライベートブランドのシェア分析:カテゴリ別
第9章 主な流通チャネル
- 主な流通チャネルのシェア - 世界/地域レベル
第10章 産業指標
- 世界の特許出願
- 世界の業務分析
- 世界の取引
第11章 主な包装形式
- 成長分析:主な包装材料と包装タイプ別
- 成長分析:主なクロージャータイプと一次外装タイプ別
付録
List of Tables
List of Tables
- Key categories by value and volume, 2022-27 - Global
- Key categories by value and volume, 2022-27 - Asia-Pacific
- Key categories by value and volume, 2022-27 - Middle East and Africa
- Key categories by value and volume, 2022-27 - Americas
- Key categories by value and volume, 2022-27 - Western Europe
- Key categories by value and volume, 2022-27 - Eastern Europe
- Japan: Category share
- India: Category share
- Canada: Category share
- Mexico: Category share
- Lebanon: Category share
- Israel: Category share
- Poland: Category share
- Turkiye: Category share
- Republic of Ireland: Category share
- Finland: Category share
- Leading companies in global soups sector (% share by value), 2022
- Key pack material volume share (%), 2022
- Annual volume growth by pack material (%), 2017-27
- Key pack type volume share (%), 2022
- Annual volume growth by pack type (%), 2017-27
- Key closure type volume share (%), 2022
- Annual volume growth by closure type (%), 2017-27
- Key primary outer type volume share (%), 2022
- Annual volume growth by primary outer type (%), 2017-27
List of Figures
List of Figures
- Change in consumption levels in overall soups sector, 2017-27
- Change in consumption levels in overall soups sector - Asia-Pacific, 2017-27
- Change in consumption levels in overall soups sector - Middle East and Africa, 2017-27
- Change in consumption levels in overall soups sector - Americas, 2017-27
- Change in consumption levels in overall soups sector - Western Europe, 2017-27
- Change in consumption levels in overall soups sector - Eastern Europe, 2017-27
- Identifying high-potential countries, risk-reward analysis - Asia-Pacific
- Identifying high-potential countries, risk-reward analysis - Middle East and Africa
- Identifying high-potential countries, risk-reward analysis - Americas
- Identifying high-potential countries, risk-reward analysis - Western Europe
- Identifying high-potential countries, risk-reward analysis - Eastern Europe
- Top five companies' shares by brand (in value terms) in the soups sector, 2022 - Global
- Top five companies' shares by brand (in value terms) in the soups sector, 2022 - Asia-Pacific
- Top five companies' shares by brand (in value terms) in the soups sector, 2022 - Middle East and Africa
- Top five companies' shares by brand (in value terms) in the soups sector, 2022 - Americas
- Top five companies' shares by brand (in value terms) in the soups sector, 2022 - Western Europe
- Top five companies' shares by brand (in value terms) in the soups sector, 2022 - Eastern Europe
- Key brands - ambient soup, 2022
- Key brands - chilled soup, 2022
- Key brands - dried soup (mixes), 2022
- Key brands - Frozen soup, 2022
- Key brands - UHT soup, 2022
- Private label value and share by region, 2017-22
- Private label value and share by category, 2022
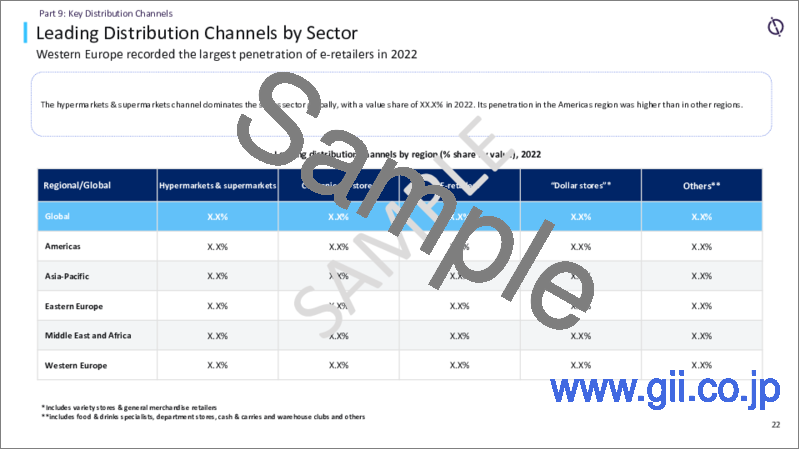
- Leading distribution channels by region (% share by value), 2022
The global soups sector's value will grow from $22.3 billion in 2022 to $28.3 billion in 2027, increasing at a compound annual growth rate (CAGR) of 4.9%. In terms of value, ambient soup was the largest category, with a share of 40.3%, in 2022. Dried soup (mixes) will increase in value share from 39.7% in 2022 to 45.2% in 2027. The rise in consumers' purchasing power and investments by leading manufacturers in capacity expansion will enable the sector's growth in the future. Ambient soup made up 59.8% of the sector's volume in 2022.
This report brings together multiple data sources to provide a comprehensive overview of the global soups sector, analyzing data from 107 countries. It includes an analysis of the following -
Sector overview: Provides an overview of the current sector scenarios in terms of ingredients, manufacturer claims, labeling, and packaging. The analysis also provides a regional overview across five regions-the Asia-Pacific, the Middle East and Africa, the Americas, Western Europe, and Eastern Europe-highlighting sector size, growth drivers, the latest developments, and future challenges for each region.
Change in consumption: Provides an overview of changes in the consumption of soups over 2017-27, at global and regional levels.
High-potential countries: Provides risk-reward analysis of the top two high-potential countries in each region based on market assessment, economic development, governance indicators, socio-demographic factors, and technological infrastructure.
Scope
Provides an overview of the current sector scenarios in terms of ingredients, manufacturer claims, labeling, and packaging. The analysis also provides a regional overview across five regions-the Asia-Pacific, the Middle East and Africa, the Americas, Western Europe, and Eastern Europe-highlighting sector size, growth drivers, the latest developments, and future challenges for each region.
Reasons to Buy
Manufacturing and retailers seek latest information on how the market is evolving to formulate their sales and marketing strategies. There is also demand for authentic market data with a high level of detail. This report has been created to provide its readers with up-to-date information and analysis to uncover emerging opportunities of growth within the soups sector.
The report provides a detailed analysis of the countries in the region, covering the key challenges, competitive landscape and demographic analysis, that can help companies gain insight into the country specific nuances.
The analysts have also placed a significant emphasis on the key trends that drive consumer choice and the future opportunities that can be explored in the region, than can help companies in revenue expansion.
To gain competitive intelligence about leading brands in the sector in the region with information about their market share and growth rates.
Table of Contents
Table of Contents
- Executive Summary
Part 1: Sector Overview
- Current Scenario and Future Outlook
- Global Soups Sector Overview - What Are the Growth Factors, Latest Developments, and Future Inhibitors?
- Regional Soups Overview - What Are the Growth Factors, Latest Developments, and Future Inhibitors?
- Key Challenges in the Global Soups Sector
Part 2: Shift in Soups Consumption Patterns
- Change in Consumption Levels in Overall Soups Sector, 2017-27
- Reasons for Shift in Consumption Patterns
Part 3: Identifying High-Potential Countries
- Analysis of 10 Countries on the Basis of Risk-Reward Analysis (Market Assessment, Economic Development,
- Sociodemographic Factors, Governance Indicators, and Technological Infrastructure)
Part 4: Country Deep-Dive
- High-Potential Country Analysis
- Key Trends
Part 5: Health & Wellness Analysis
- Global and Regional
- Growth Contribution by Region
- Key Product Attributes
- Key Consumer Benefits
- Leading Health & Wellness Companies by Category
Part 6: Competitive Environment
- Leading Companies by Value - Global
- Company and Brand Share Analysis - Global
- Company and Brand Share Analysis by Region
Part 7: Competitive Landscape - Market Analysis
Part 8: Market Share of Private Labels
- Private Label Share Analysis by Region
- Private Label Share Analysis by Category
Part 9: Key Distribution Channels
- Share of Key Distribution Channels - Global and Regional Level
Part 10: Select Industry Metrics
- Global Patent Filings
- Global Job Analytics
- Global Deals
Part 11: Key Packaging Formats
- Growth Analysis by Key Pack Material and Pack Type
- Growth Analysis by Key Closure Type and Primary Outer Type
Appendix
- Definitions
- Methodology
- About GlobalData