|
|
市場調査レポート
商品コード
1494236
世界の調理済み食品部門における機会(2024年)Opportunities in the Global Prepared Meals Sector 2024 |
||||||

|
|||||||
カスタマイズ可能
適宜更新あり
|
|||||||


| 世界の調理済み食品部門における機会(2024年) |
|
出版日: 2024年05月20日
発行: GlobalData
ページ情報: 英文 164 Pages
納期: 即納可能
|

全表示
- 概要
- 図表
- 目次
世界の調理済み食品部門の市場規模は、2023年に1,330億米ドルであり、2028年に1,816億米ドルに達し、2023年~2028年にCAGRで6.4%の成長を記録すると予測されます。2023年にこの部門で最大の地域となったのは南北アメリカで、金額シェアは44%、次いで西欧の27%でした。2023年、レディミールが世界全体の売上金額の71.9%を占める最大のカテゴリであり、ピザが24.8%、ミールキットが3.3%でこれに続きました。世界の調理済み食品部門の上位5社は、2023年に合計で28.4%の金額シェアを占めました。同部門の金額シェアはNestleが13.6%で先頭に立ち、Conagra Brandsが5.7%、Nissin Foods Holdingsが4.2%で続きました。2023年の世界の調理済み食品部門の流通チャネルは、ハイパーマーケット・スーパーマーケットが金額シェア67.5%でトップ、次いでコンビニエンスストアの19.9%でした。
当レポートでは、世界の調理済み食品部門について調査分析し、成分、メーカーの主張、ラベリング、包装に関する現在の情勢を提供しています。また、各地域の規模、成長促進要因、最新動向、将来の課題を明らかにしています。
目次
- エグゼクティブサマリー
- 部門の概要
- 世界の概要
- アメリカの概要
- アジア太平洋の概要
- 東欧の概要
- 中東・アフリカの概要
- 西欧の概要
- 調理済み食品:世界の課題
- 食品金額シェアパターンの変化
- 食品産業全体における金額シェアの変化(2023年~2028年)
- 金額シェアの変化の理由
- 消費レベルの変化:南北アメリカ(2018年~2028年)
- 消費レベルの変化:アジア太平洋(2018年~2028年)
- 消費レベルの変化:東欧(2018年~2028年)
- 消費レベルの変化:中東・アフリカ(2018年~2028年)
- 消費レベルの変化:西欧(2018年~2028年)
- 潜在力の高い国の特定:地域別
- 潜在力の高い国の特定:地域別
- 調査手法 - 潜在力の高い国の特定
- 各国の詳細
- 潜在力の高い国の分析
- 将来の見通し
- ヘルス・ウェルネスの分析
- ヘルス・ウェルネスの分析・地域 - 世界
- 競合環境
- 主要企業(金額) - 世界
- 主要企業とブランドのシェア分析 - 世界
- 主要企業とブランドのシェア分析:地域別
- 競合情勢 - 市場の分析
- 主要ブランド - レディミール
- 主要ブランド - ピザ
- 主要ブランド - ミールキット
- プライベートブランドの市場シェア
- プライベートブランドのシェア分析:地域別
- プライベートブランドのシェア分析:カテゴリ別
- 主な流通チャネル
- 主要の流通チャネルのシェアと地域レベル - 世界
- 主な包装形式
- 成長分析:主要包装材料、包装タイプ別
- 成長分析:クロージャータイプ、一次外装タイプ別
- 産業指標
- 世界の特許出願
- 世界の業務分析
- 世界の取引
付録
List of Tables
- Key categories by value and volume, 2023-28 - Global
- Key categories by value and volume, 2023-28 - Asia-Pacific
- Key categories by value and volume, 2023-28 - MEA
- Key categories by value and volume, 2023-28 - Americas
- Key categories by value and volume, 2023-28 - Western Europe
- Key categories by value and volume, 2023-28 - Eastern Europe
- Brazil: Category share
- Canada: Category share
- United States of America: Category share
- Australia: Category share
- Japan: Category share
- Czech Republic: Category share
- Romania: Category share
- South Africa: Category share
- United Kingdom: Category share
- Sweden: Category share
- Leading companies in global prepared meals sector (% share by value), 2023
- Key pack material volume share (%), 2023
- Annual volume growth by pack material (%), 2018-28
- Key pack type volume share (%), 2023
- Annual volume growth by pack type (%), 2018-28
- Key closure type volume share (%), 2023
- Annual volume growth by closure type (%), 2018-28
- Key primary outer type volume share (%), 2023
- Annual volume growth by primary outer type (%), 2018-28
List of Figures
- Change in consumption levels in overall prepared meals sector, 2018-28
- Change in consumption levels in overall prepared meals sector - Asia-Pacific, 2018-28
- Change in consumption levels in overall prepared meals sector - MEA, 2018-28
- Change in consumption levels in overall prepared meals sector - Americas, 2018-28
- Change in consumption levels in overall prepared meals sector - Western Europe, 2018-28
- Change in consumption levels in overall prepared meals sector - Eastern Europe, 2018-28
- Identifying high-potential countries, risk-reward analysis - Asia-Pacific
- Identifying high-potential countries, risk-reward analysis - MEA
- Identifying high-potential countries, risk-reward analysis - Americas
- Identifying high-potential countries, risk-reward analysis - Western Europe
- Identifying high-potential countries, risk-reward analysis - Eastern Europe
- Top five companies' shares by brand (in value terms) in the prepared meals sector, 2023 - Global
- Top five companies' shares by brand (in value terms) in the prepared meals sector, 2023 - Asia-Pacific
- Top five companies' shares by brand (in value terms) in the prepared meals sector, 2023 - MEA
- Top five companies' shares by brand (in value terms) in the prepared meals sector, 2023 - Americas
- Top five companies' shares by brand (in value terms) in the prepared meals sector, 2023 - Western Europe
- Top five companies' shares by brand (in value terms) in the prepared meals sector, 2023 - Eastern Europe
- Key brands - ready meals, 2023
- Key brands - pizza, 2023
- Key brands - meal kits, 2023
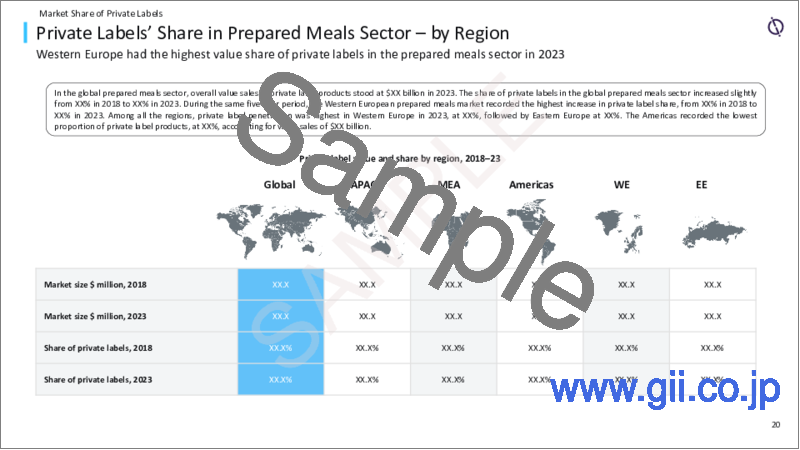
- Private label value and share by region, 2018-23
- Private label value and share by category, 2023
- Leading distribution channels by region (% share by value), 2023
The global prepared meals sector was valued at $133 billion in 2023 and is forecast to record a compound annual growth rate (CAGR) of 6.4% during 2023-28, and reach $181.6 billion in 2028. The Americas represented the largest region in the sector in 2023, with a value share of 44%, followed by Western Europe with 27%. In 2023, ready meals was the largest category, accounting for 71.9% of overall global value sales, distantly followed by pizza and meal kits at 24.8% and 3.3%, respectively. The top five companies in the global prepared meals sector together accounted for a combined value share of 28.4% in 2023. The sector was led by Nestle, which held a value share of 13.6%, followed by Conagra Brands with 5.7% and Nissin Foods Holdings with 4.2%. Hypermarkets & supermarkets was the leading distribution channel in the global prepared meals sector in 2023, with a value share of 67.5%, followed by convenience stores with 19.9%.
This report brings together multiple data sources to provide a comprehensive overview of the global prepared meals sector, analyzing data from 106 countries. It includes analysis on the following -
- Sector overview: Provides an overview of the current sector scenarios in terms of ingredients, manufacturer claims, labeling, and packaging. The analysis also provides a regional overview across five regions-Asia-Pacific, MEA (MEA), the Americas, Western Europe, and Eastern Europe-highlighting sector size, growth drivers, the latest developments, and future challenges for each region. This data includes both on-trade and off-trade data.
- Change in consumption: Provides an overview of consumption changes in the prepared meals sector over 2018-28 at global and regional levels.
- High-potential countries: Provides risk-reward analysis of the top high-potential countries in each region based on market assessment, economic development, governance indicators, sociodemographic factors, and technological infrastructure.
Scope
- Provides an overview of the current sector scenarios in terms of ingredients, manufacturer claims, labeling, and packaging. The analysis also provides a regional overview across five regions-Asia-Pacific, MEA (MEA), the Americas, Western Europe, and Eastern Europe-highlighting sector size, growth drivers, the latest developments, and future challenges for each region. This data includes both on-trade and off-trade data.
Reasons to Buy
- Manufacturers and retailers seek latest information on how the market is evolving to formulate their sales and marketing strategies. There is also demand for authentic market data with a high level of detail. This report has been created to provide its readers with up-to-date information and analysis to uncover emerging opportunities of growth within the prepared meals sector.
- The report provides a detailed analysis of the countries in the region, covering the key challenges, competitive landscape and demographic analysis, that can help companies gain insight into the country specific nuances.
- The analysts have also placed a significant emphasis on the key trends that drive consumer choice and the future opportunities that can be explored in the region, than can help companies in revenue expansion.
- To gain competitive intelligence about leading brands in the sector in the region with information about their market share and growth rates.
Table of Contents
Table of Contents
- Executive Summary
- Sector Overview
- Global Overview
- Americas Overview
- Asia-Pacific Overview
- Eastern Europe Overview
- MEA Overview
- Western Europe Overview
- Prepared meals: Global Challenges
- Shift in Food Value Share Patterns
- Change in Value Share in the Overall Food Industry, 2023-28
- Reasons for Shift in Value Share
- Change in Consumption Levels: Americas, 2018-28
- Change in Consumption Levels: Asia-Pacific, 2018-28
- Change in Consumption Levels: Eastern Europe, 2018-28
- Change in Consumption Levels: MEA, 2018-28
- Change in Consumption Levels: Western Europe, 2018-28
- Identifying High-Potential Countries by Region
- Identifying High-Potential Countries by Region
- Methodology - Identifying High-Potential Countries
- Country Deep Dive
- High-Potential Country Analysis
- Future Outlook
- Health & Wellness Analysis
- Health & Wellness Analysis - Global & Regional
- Competitive Environment
- Leading Companies by Value - Global
- Leading Companies and Brands Share Analysis - Global
- Leading Companies and Brands Share Analysis by Region
- Competitive Landscape - Market Analysis
- Key Brands - Ready Meals
- Key Brands - Pizza
- Key Brands - Meal Kits
- Market Share of Private Labels
- Private Labels' Share Analysis by Region
- Private Labels' Share Analysis by Category
- Key Distribution Channels
- Share of Key Distribution Channels - Global and Regional Level
- Key Packaging Formats
- Growth Analysis by Key Pack Material and Pack Type
- Growth Analysis by Closure Type and Primary Outer Type
- Select Industry Metrics
- Global Patent Filings
- Global Job Analytics
- Global Deals
Appendix
- Definitions
- About GlobalData

