|
|
市場調査レポート
商品コード
1347928
スマートメーターの世界市場-2023年~2030年Global Smart Meter Market - 2023-2030 |
||||||
|
|
|||||||
カスタマイズ可能
適宜更新あり
|
|||||||


| スマートメーターの世界市場-2023年~2030年 |
|
出版日: 2023年09月11日
発行: DataM Intelligence
ページ情報: 英文 201 Pages
納期: 即日から翌営業日
|

- 全表示
- 概要
- 目次
概要
世界のスマートメーター市場は、2022年に226億米ドルに達し、2023-2030年の予測期間中にCAGR 9.5%で成長し、2030年には372億米ドルに達すると予測されています。
消費者は、エネルギー使用量をより正確かつリアルタイムに監視するために、家庭やオフィスにスマートメーターを設置しています。これにより、消費者はエネルギー消費に関する意思決定を行うことができるようになり、エネルギーを削減し、エネルギー効率の良い方法を採用しようという意識と意欲が高まっています。
政府は、スマートメーターを利用した様々な対応プログラムを組織しています。これらのプログラムは、インセンティブを提供することで、消費者にピーク時のエネルギー消費を削減するよう促し、また、エネルギーグリッドのバランスをとる方法や過負荷の防止についても指導しています。多くの国がエネルギー効率目標を設定し、スマートメーターの導入を消費者に促す規制を設けています。
北米は、2023-2030年の予測期間中、世界市場の約1/4のシェアを占めると予想されています。北米では、米国やカナダのような国々がスマートメーターによってエネルギー消費量を監視し、消費者がエネルギー使用量を管理できるようにしています。スマートメーターを採用することで、電力網システムの信頼性と回復力を高めることができます。また、エネルギー資源とコストをリアルタイムで追跡できるため、エネルギー管理システムへの消費者の関与を高めることができます。
モノのインターネット (IoT) 技術は、北米におけるスマートメーターの機能を強化しました。高度な通信プロトコル、データ分析、クラウドコンピューティングによって、スマートメーターはリアルタイムデータを効率的に送信・処理できるようになり、この技術進化はグリッド管理を改善するだけでなく、革新的なエネルギーサービスや活用領域の基盤を築いています。
例えば、2023年4月11日、IoTオペレーティングシステムのプロバイダーであるAetheros社は、スケーラブルでオープンエッジなインテリジェンス・ソリューションで米国のスマートメーター市場に参入しました。米国市場にIoTオペレーティングシステムを導入することで、Aetherosはスマートメーターの機能を強化し、IoT主導のエネルギー管理ソリューションの発展に貢献しようとしています。
ダイナミクス
政府の取り組みが市場を後押し
世界各国の政府は、スマートメーターの消費者への配備を電力会社に義務付ける様々な規制を導入しました。2018年10月、インドールのスマートシティ開発限定は、インドールのスマートシティプロジェクトの下でインストールされる3万台のスマートメーターの入札を発行し、国のこれらの動向は、市場の成長を後押しします。
例えば、2023年5月31日、政府は全国の伝統的な電力メーターをスマートメーターに置き換えることを計画し、このプロセスは2019年4月に開始され、電力省は企業の財務健全性を改善し、また手間のかからない請求書支払いを行うためのイニシアチブを取っています。州政府もNDAのスマートシティミッションの下でスマートメーターの設置を開始しています。
各国政府は、スマートメーターの利点を消費者に伝え、その導入を促進するための啓蒙キャンペーンを実施しており、こうしたキャンペーンは消費者の抵抗感を克服し、受け入れを促進するのに役立っています。政府はスマートメーター技術の開発に資金を割り当て、より高度で費用対効果の高いスマートメーターの開発を奨励しています。
例えば、アンドラ・プラデシュ州政府は2023年3月8日、1年以内に約18,000台のスマートメーターを農家の電動機に設置することを計画しています。必要な資材の調達に400億インドルピーの支出を伴うこの構想は、盗電対策と複数のメリットを提供することを目的としています。同州は、このプロジェクトを実施する際、中央政府と中央電力庁が発行したガイドラインを遵守します。
技術進歩が市場を牽引
高度計測インフラ技術の導入には、スマートメーターと通信ネットワーク、データ管理システム、分析ツールの統合が含まれます。この統合によってスマートメーターの機能が強化され、電力会社がより効率的にデータを収集・分析できるようになり、この技術が市場の成長を後押ししています。
例えば、2023年8月25日、Bharti Airtel社は安全なメーターと協力し、インドのビハール州の約130万世帯にNarrow Band Internet of Things(NB-IoT)スマートメーターを導入する予定です。この取り組みにより、Airtel社は2Gと4Gネットワークの両方で動作するフォールバックオプションを備えたNB-IoTスマートメーターを導入したインド初の企業となり、中断のないデータ転送とリアルタイムの接続が確保されます。
民間企業間のコラボレーションが市場を牽引
エネルギー企業とテクノロジー企業は、革新的なスマートメーター・ソリューションを開発するための技術的ノウハウを持つ企業として協業しています。この協業により、スマートメーターはリアルタイムデータの収集や遠隔監視などの高度な機能を備え、これらの統合によりスマートメーターの機能が強化されます。
例えば、2023年5月18日、GridXとSenseはEnergy Impact Partnersと協力し、スマートメーターデータを活用して消費者とエネルギーグリッドに有意義な利益を提供するパートナーシップを発表しました。この統合ソリューションは、顧客にリアルタイムの洞察を提供し、エネルギー使用量とコストを管理することを目的としています。
製造業と大量のデータ生成
メーカーが異なると、通信プロトコルが異なるスマートメーターを設計する可能性があり、グリッド内でのシームレスな相互運用性を確保することが課題となります。スマートメーターからは大量のデータが生成されるため、高度なデータ管理システムが必要となります。
例えば、2023年6月14日、国家監査院の報告書によると、第一世代のSMETS1 スマートメーター約400万台が5月上旬の時点でまだ稼働中であり、政府のアップグレード目標から4ヶ月以上経過しています。同報告書はまた、スマートメーター機器の10分の1近くが正常に機能しておらず、ユーザーの約3分の1が設置後に問題に遭遇していることを強調しています。
ハッキングによる問題提起
スマートメーターはエネルギー使用に関する詳細な情報を収集するため、消費者のプライバシーに関わる問題を引き起こす可能性があります。収集されたデータは個人の詳細や居住パターンを明らかにするため、ハッカーによる攻撃、エネルギー窃盗、さらには潜在的な電力網の混乱が起こり得ます。
スマートメーターの接続性は、サイバーセキュリティの脆弱性をもたらします。適切に保護されなければ、これらの機器はハッキングの標的となり、消費者データへの不正アクセス、エネルギーの盗難、さらには電力網の混乱につながる可能性があります。スマートメーターが収集するデータは、悪意のあるユーザーがアクセスすると悪用されます。
目次
第1章 調査手法と調査範囲
第2章 定義と概要
第3章 エグゼクティブサマリー
第4章 市場力学
- 影響要因
- 促進要因
- 政府の取り組みが市場を後押し
- 技術進歩が市場を牽引
- 民間企業間のコラボレーションが市場を牽引
- 抑制要因
- ハッキングによる問題提起
- 製造業と大量のデータ生成
- 機会
- 影響分析
- 促進要因
第5章 産業分析
- ポーターのファイブフォース分析
- サプライチェーン分析
- 価格分析
- 規制分析
- ロシア・ウクライナ戦争の影響分析
- DMIの見解
第6章 COVID-19分析
第7章 製品別
- スマート電気メーター
- スマートガスメーター
- スマート水道メーター
第8章 技術別
- 高度計測インフラ
- 自動検針装置
第9章 通信方式別
- 無線周波数
- 電力供給システム
- セルラー
第10章 コンポーネント別
- ハードウェア
- ソフトウェア
第11章 エンドユーザー別
- 住宅用
- 商業用
- 産業用
第12章 地域別
- 北米
- 米国
- カナダ
- メキシコ
- 欧州
- ドイツ
- 英国
- フランス
- イタリア
- ロシア
- その他欧州
- 南米
- ブラジル
- アルゼンチン
- その他南米
- アジア太平洋
- 中国
- インド
- 日本
- オーストラリア
- その他アジア太平洋地域
- 中東・アフリカ
第13章 競合情勢
- 競合シナリオ
- 市況/シェア分析
- M&A分析
第14章 企業プロファイル
- Landis+Gyr
- 企業概要
- 製品ポートフォリオと説明
- 財務概要
- 主な動向
- Itron
- Honeywell International
- Siemens AG
- Kamstrup
- Iskraemeco
- Elster Group
- ABB
- Sensus
- Schneider Electric
第15章 付録
Overview
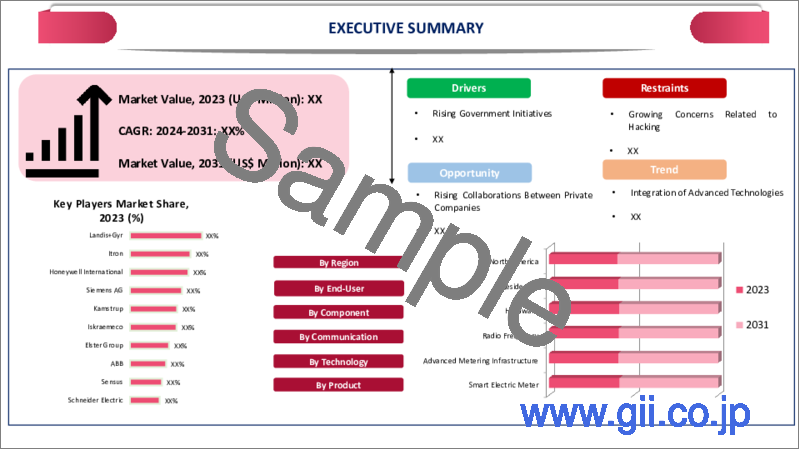
Global Smart Meter Market reached US$ 22.6 billion in 2022 and is expected to reach US$ 37.2 billion by 2030, growing with a CAGR of 9.5% during the forecast period 2023-2030.
Consumers are installing smart meters in their homes and office to monitor their energy usage more accurately and in real-time, this empowers them to take decisions about their energy consumption and leads to greater awareness and motivation to reduce their energy reduces and adopt energy-efficient practices.
Government organizes various response programs using smart meters, as these programs encourage consumers to reduce energy consumption during peak hours by offering incentives and the program also guides how to balance the energy grid and prevention from overloads. Many countries set energy efficiency targets and regulations that encourage consumers for the deployment of smart meters.
North America is expected to hold a share of around 1/4th of the global market during the forecast period 2023-2030. In North America, countries like U.S. and Canada smart meter enables to monitor the energy consumption and empowers consumers to manage their energy usage. By adopting smart meters it enhances reliability and resilience of the power grid system. It has the ability to track energy resources and costs in real-time which enhances consumer engagement in energy management systems.
Internet of Things technology has enhanced the capabilities of smart meters in North America. Advanced communication protocols, data analytics and cloud computing enable smart meters to transmit and process real-time data efficiently and this technology evolution not only improves grid management but also lays the foundation for innovative energy services and applications.
For instance, on 11 April 2023, Aetheros, a provider of IoT operating systems entered U.S. smart meter market with its scalable and open-edge intelligence solution and this technology aims to facilitate the deployment of smart meters by enabling distributed intelligence at the edge of the network. By introducing its IoT operating system to U.S. market, Aetheros seeks to enhance the capabilities of smart meters and contribute to the advancement of IoT-driven energy management solutions.
Dynamics
Government Initiatives Boost the Market
Governments across the world introduced various regulatory mandates that require utilities that deploy smart meters to consumers. In October 2018, Indore's smart city development limited issued a tender for 30,000 smart meters that are installed under Indore smart city projects, these developments in nations boost the growth of the market.
For instance, on 31 May 2023, Government planned to replace all traditional electricity meters across the nation with smart meters, this process started in April 2019 and initiatives were taken by the Ministry of Power for improving the financial health of companies and also make hassle-free bill payments. State governments have also begun installing smart meters under the NDA smart cities missions.
Governments run public awareness campaigns to educate consumers about the benefits of smart meters and encourage their adoption and these campaigns help overcome consumer resistance and promote acceptance. Government allocates funds for development of smart meter technology, these encourages the development of more advanced and cost-effective smart meters.
For instance, on 8 March 2023, the government of Andhra Pradesh plans to install around 18 lakh smart meters on farm electric motors within a year. The initiative, which involves an expenditure of INR 4,000 crore for procuring the necessary materials, aims to combat power theft and offer multiple benefits. The state will adhere to guidelines issued by the Central Government and Central Electricity Authority while implementing this project.
Advancements in Technology Drive the Market
The deployment of advanced metering infrastructure technology involves the integration of smart meters with communication networks, data management systems and analytics tools. This integration enhances the capabilities of smart meters, enabling utilities to gather and analyse data more efficiently, this technology boosts the growth of the market.
For instance, 0n 25 August 2023, Bharti Airtel collaborates with secure meters and is set to deploy Narrow Band Internet of Things (NB-IoT) smart meters in around 1.3 million homes in Bihar, India and this initiative makes Airtel the first company in India to introduce NB-IoT smart meters with a fall-back option that works on both 2G and 4G networks, ensuring uninterrupted data transfer and real-time connectivity.
Collaboration Between Private Companies Drives the Market
Energy and technology companies are collaborating as they technical know-how to develop innovative smart meters solutions, this collaboration ensures the smart meters are equipped with their advanced features such as gathering real-time data, remote monitoring and these integrations enhances the functionality of the smart meters.
For instance, on 18 May 2023, GridX and Sense collaborates with Energy Impact Partners and announced a partnership to leverage smart meter data to provide meaningful benefits for consumers and the energy grid. The integrated solution aims to offer customers real-time insights and control over their energy usage and costs.
Manufacturing and Massive Data Generation
Different manufacturers might design smart meters with varying communication protocols, making it challenging to ensure seamless interoperability within the grid and this can complicate integration efforts and hinder the development of standardized systems. As the massive amount of data is generated by smart meters and it requires advanced data management systems.
For instance, on 14 June 2023, according to a report from the National Audit Office that around four million first-generation SMETS 1 smart meters were still in operation in early May, which is over four months after the government's target to upgrade them. The report also highlights that nearly a tenth of all smart meter devices do not function properly and about a third of users have encountered issues after installation.
Hacking Posed to Raise Issue
Smart meters collect detailed information about energy usage, potentially raising privacy concerns for consumers. The data collected will reveal personal details and occupancy patterns, so here data can be attacked by hackers, energy theft and even disruptions of the potential electricity grids, these factors downfall the growth of the market.
The connectivity of smart meters introduces cybersecurity vulnerabilities. If not properly secured, these devices could be targets for hacking, potentially leading to unauthorized access to consumer data, energy theft or even disruptions to the electricity grid. The data being collected by smart meters is exploited if accessed by malicious users.
Segment Analysis
The global smart meter market is segmented based on product, technology, communication, component, end-user and region.
The Accuracy of Smart Electricity Drives the Segment's Growth
The smart electricity segment holds a major share of around 1/3rd of the global smart meter market. Smart electricity meters offer a more accurate result that how much energy is consumed when compared to other traditional meters, these smart electricity meters help to reduce electricity bills, error and disputes and they also provide data on their energy usage patterns and helps consumers to make decisions about their energy consumption.
For instance, on 5 September 2022, Delving Research and Development, a company based in Coimbatore, developed smart electricity meters known as Delsmart IoT meters and these meters will be installed in Madhya Pradesh in part of the pilot project. The project aims to install around 100 meters by December, focusing on service connections and transformers covered under a single feeder in Madhya Pradesh.
Geographical Penetration
Governments Plans in Asia-Pacific Boosts the Market
Asia-Pacific is among the growing regions in the global smart meters market covering more than 1/3rd of the market. Countries like China, South Korea and India set ambitious goal energy efficiency and sustainability targets. Smart meters help to manage the demand effectively which enables time-to-time usage of pricing and response programs.
Aging electricity grids require modern techniques to handle the complexity of energy resources and renewable integrations. Governments are implementing regulations and policies that mandate the deployment of smart meters to enhance energy management, reduce losses and achieve carbon reduction goals, this aligns with regional initiatives that promote energy efficiency and energy consumption.
For instance, on 28 April 2023, IntelliSmart Infrastructure Pvt. Ltd. secured a significant contract to install 6.7 million prepaid smart meters in 14 districts of Uttar Pradesh, which fall under the jurisdiction of Pashchimanchal Vidyut Vitran Nigam Limited and this achievement marks the largest competitively bid smart metering project awarded under the Revamped Distribution Sector Scheme in India.
Competitive Landscape
The major global players include: Landis+Gyr, Itron, Honeywell International, Siemens AG, Kamstrup, Iskraemeco, Elster Group, ABB, Sensus and Schneider Electric.
COVID-19 Impact Analysis
The COVID-19 pandemic brought about significant changes in daily routines, including widespread remote work and lockdown measures and these changes had a notable impact on electricity demand patterns due to shifts in activities, such as increased residential energy consumption and altered work schedules.
Consumer spending more time at home during lockdowns and restrictions, there has been a shift in energy consumption patterns. Smart meters provide accurate and real-time data, ensuring that consumers are billed correctly based on their actual usage. The pandemic has increased awareness of the need for energy conservation.
During the pandemic smart water, meters identify leaks in water distribution systems, whether in households or public infrastructure. Detecting leaks early prevents water wastage, reduces water bills and helps maintain the integrity of water infrastructure. In the context of the pandemic, conserving water resources becomes even more critical to ensure proper sanitation and hygiene.
The global supply chain disturbance caused by the pandemic has affected the manufacturing and distribution of smart gas meters. Delays in the production and delivery of meters slow down the adoption of smart gas metering systems in many countries. The economic downturn caused by the pandemic has affected investments in infrastructure projects, including the deployment of smart gas meters.
AI Impact
AI-powered algorithms analyze the vast amount of data collected by smart meters to provide actionable insights, this includes identifying usage patterns, peak demand times, energy wastage and potential areas for efficiency improvements and these insights help consumers and utilities make informed decisions to optimize energy consumption.
For instance, on 2 April 2023, Moro Hub, a subsidiary of Digital DEWA (Dubai Electricity and Water Authority), partnered with Bidgely to enhance customer engagement and promote a clean energy future. The partnership involves the use of smart meter data and Bidgely's UtilityAI Platform to provide appliance-level consumption insights to customers.
AI-enabled smart meters and communicate with appliances and devices in homes which leads to managing energy consumption in real time. During peak demanding period these devices automatically adjust their energy usage as sensors are connected with the systems and also reduces strains on the grid infrastructure and minimize the overall cost of the system.
For instance, on 11 July 2023, The Xenn AI-based smart meter data-driven energy management app, developed by re.alto, offers Belgian consumers the ability to monitor their energy consumption and control their expenses. The app is powered by re.alto's Connect platform and was created in response to the introduction of a capacity-based grid tariff.
Russia- Ukraine War Impact
Ukraine's Regional Gas Company achieved certification for its locally developed smart natural gas meters and these new meters are set to be produced and installed by RGC's metering centers in the second quarter of 2023. The innovative meters combine a membrane meter with a built-in smart module equipped with a modem, allowing automatic transmission of gas consumption data to the gas distribution company.
Hungary signed agreements with Russia for ensuring its access to Russia energy resources that includes natural gas. The agreements with Russian state energy company Gazprom allows Hungary to import larger quantities of natural gas beyond what was stipulated in a long-term contract. The gas would be delivered through the Turkstream pipeline and the price would be capped at € 150 per cubic meter.
The war damage to the existing gas infrastructure, including gas pipelines and distribution networks and these factors affect the deployment of smart gas meters, as the damaged infrastructure would need to be repaired or replaced before the meters can be installed. Due to this factor, there is a downfall in the growth of the smart gas meter market.
For instance, on 30 October 2022, Report from the International Energy Agency suggests that the Russian oil and gas sector will experience long-term consequences following the invasion of Ukraine. The report indicates that the fallout from the invasion has disrupted international markets and could weaken Russia energy sector for decades.
By Product
- Smart Electric Meter
- Smart Gas Meter
- Smart Water Meter
By Technology
- Advanced Metering Infrastructure
- Automated Meter Reading device
By Communication
- Radio Frequency
- Power Supply System
- Cellular
By Component
- Hardware
- Software
By End-User
- Residential
- Commercial
- Industrial
By Region
- North America
- U.S.
- Canada
- Mexico
- Europe
- Germany
- UK
- France
- Italy
- Russia
- Rest of Europe
- South America
- Brazil
- Argentina
- Rest of South America
- Asia-Pacific
- China
- India
- Japan
- Australia
- Rest of Asia-Pacific
- Middle East and Africa
Key Developments
- On 5 July 2023, Indian smart metering company Genus Power & Infrastructures and Singapore-based GIC, through its affiliate Gem View Investment, formed a joint venture to establish a funding platform for smart meter projects in India.
- On 28 December 2022, Adani Transmission established a subsidiary named BEST Smart Metering Ltd to handle its smart meter business. Adani Transmission holds 100% equity in BSML, with a total equity of INR 1 lakh divided into 10,000 equity shares of INR 10 each.
- On 20 April 2023, the Maharashtra State Electricity Distribution Company plans to install smart prepaid meters in Pune and across the state and these meters will have an 'automatic power disconnection facility' for consumers who fail to pay their electricity bills on time. The smart prepaid meters, costing INR 2,600 each, can be recharged online similar to mobile phones.
Why Purchase the Report?
- To visualize the global smart meter market segmentation based on product, technology, communication, component, end-user and region, as well as understand key commercial assets and players.
- Identify commercial opportunities by analyzing trends and co-development.
- Excel data sheet with numerous data points of smart meter market-level with all segments.
- PDF report consists of a comprehensive analysis after exhaustive qualitative interviews and an in-depth study.
- Product mapping available as Excel consisting of key products of all the major players.
The global smart meter market report would provide approximately 77 tables, 75 figures and 201 pages.
Target Audience 2023
- Manufacturers/ Buyers
- Industry Investors/Investment Bankers
- Research Professionals
- Emerging Companies
Table of Contents
1. Methodology and Scope
- 1.1. Research Methodology
- 1.2. Research Objective and Scope of the Report
2. Definition and Overview
3. Executive Summary
- 3.1. Snippet by Product
- 3.2. Snippet by Technology
- 3.3. Snippet by Communication
- 3.4. Snippet by Component
- 3.5. Snippet by End-User
- 3.6. Snippet by Region
4. Dynamics
- 4.1. Impacting Factors
- 4.1.1. Driver
- 4.1.1.1. Government Initiatives Boost the Market
- 4.1.1.2. Advancements in Technology Drive the Market
- 4.1.1.3. Collaboration Between Private Companies Drives the Market
- 4.1.2. Restraints
- 4.1.2.1. Hacking Posed to Raise Issue
- 4.1.2.2. Manufacturing and Massive Data Generation
- 4.1.3. Opportunity
- 4.1.4. Impact Analysis
- 4.1.1. Driver
5. Industry Analysis
- 5.1. Porter's Five Force Analysis
- 5.2. Supply Chain Analysis
- 5.3. Pricing Analysis
- 5.4. Regulatory Analysis
- 5.5. Russia-Ukraine War Impact Analysis
- 5.6. DMI Opinion
6. COVID-19 Analysis
- 6.1. Analysis of COVID-19
- 6.1.1. Scenario Before COVID
- 6.1.2. Scenario During COVID
- 6.1.3. Scenario Post COVID
- 6.2. Pricing Dynamics Amid COVID-19
- 6.3. Demand-Supply Spectrum
- 6.4. Government Initiatives Related to the Market During Pandemic
- 6.5. Manufacturers Strategic Initiatives
- 6.6. Conclusion
7. By Product
- 7.1. Introduction
- 7.1.1. Market Size Analysis and Y-o-Y Growth Analysis (%), By Product
- 7.1.2. Market Attractiveness Index, By Product
- 7.2. Smart Electric Meter*
- 7.2.1. Introduction
- 7.2.2. Market Size Analysis and Y-o-Y Growth Analysis (%)
- 7.3. Smart Gas Meter
- 7.4. Smart Water Meter
8. By Technology
- 8.1. Introduction
- 8.1.1. Market Size Analysis and Y-o-Y Growth Analysis (%), By Technology
- 8.1.2. Market Attractiveness Index, By Technology
- 8.2. Advanced Metering Infrastructure*
- 8.2.1. Introduction
- 8.2.2. Market Size Analysis and Y-o-Y Growth Analysis (%)
- 8.3. Automated Meter Reading device
9. By Communication
- 9.1. Introduction
- 9.1.1. Market Size Analysis and Y-o-Y Growth Analysis (%), By Communication
- 9.1.2. Market Attractiveness Index, By Communication
- 9.2. Radio Frequency*
- 9.2.1. Introduction
- 9.2.2. Market Size Analysis and Y-o-Y Growth Analysis (%)
- 9.3. Power Supply System
- 9.4. Cellular
10. By Component
- 10.1. Introduction
- 10.1.1. Market Size Analysis and Y-o-Y Growth Analysis (%), By Component
- 10.1.2. Market Attractiveness Index, By Component
- 10.2. Hardware*
- 10.2.1. Introduction
- 10.2.2. Market Size Analysis and Y-o-Y Growth Analysis (%)
- 10.3. Software
11. By End-User
- 11.1. Introduction
- 11.1.1. Market Size Analysis and Y-o-Y Growth Analysis (%), By End-User
- 11.1.2. Market Attractiveness Index, By End-User
- 11.2. Residential*
- 11.2.1. Introduction
- 11.2.2. Market Size Analysis and Y-o-Y Growth Analysis (%)
- 11.3. Commercial
- 11.4. Industrial
12. By Region
- 12.1. Introduction
- 12.1.1. Market Size Analysis and Y-o-Y Growth Analysis (%), By Region
- 12.1.2. Market Attractiveness Index, By Region
- 12.2. North America
- 12.2.1. Introduction
- 12.2.2. Key Region-Specific Dynamics
- 12.2.3. Market Size Analysis and Y-o-Y Growth Analysis (%), By Product
- 12.2.4. Market Size Analysis and Y-o-Y Growth Analysis (%), By Technology
- 12.2.5. Market Size Analysis and Y-o-Y Growth Analysis (%), By Communication
- 12.2.6. Market Size Analysis and Y-o-Y Growth Analysis (%), By Component
- 12.2.7. Market Size Analysis and Y-o-Y Growth Analysis (%), By End-User
- 12.2.8. Market Size Analysis and Y-o-Y Growth Analysis (%), By Country
- 12.2.8.1. U.S.
- 12.2.8.2. Canada
- 12.2.8.3. Mexico
- 12.3. Europe
- 12.3.1. Introduction
- 12.3.2. Key Region-Specific Dynamics
- 12.3.3. Market Size Analysis and Y-o-Y Growth Analysis (%), By Product
- 12.3.4. Market Size Analysis and Y-o-Y Growth Analysis (%), By Technology
- 12.3.5. Market Size Analysis and Y-o-Y Growth Analysis (%), By Communication
- 12.3.6. Market Size Analysis and Y-o-Y Growth Analysis (%), By Component
- 12.3.7. Market Size Analysis and Y-o-Y Growth Analysis (%), By End-User
- 12.3.8. Market Size Analysis and Y-o-Y Growth Analysis (%), By Country
- 12.3.8.1. Germany
- 12.3.8.2. UK
- 12.3.8.3. France
- 12.3.8.4. Italy
- 12.3.8.5. Russia
- 12.3.8.6. Rest of Europe
- 12.4. South America
- 12.4.1. Introduction
- 12.4.2. Key Region-Specific Dynamics
- 12.4.3. Market Size Analysis and Y-o-Y Growth Analysis (%), By Product
- 12.4.4. Market Size Analysis and Y-o-Y Growth Analysis (%), By Technology
- 12.4.5. Market Size Analysis and Y-o-Y Growth Analysis (%), By Communication
- 12.4.6. Market Size Analysis and Y-o-Y Growth Analysis (%), By Component
- 12.4.7. Market Size Analysis and Y-o-Y Growth Analysis (%), By End-User
- 12.4.8. Market Size Analysis and Y-o-Y Growth Analysis (%), By Country
- 12.4.8.1. Brazil
- 12.4.8.2. Argentina
- 12.4.8.3. Rest of South America
- 12.5. Asia-Pacific
- 12.5.1. Introduction
- 12.5.2. Key Region-Specific Dynamics
- 12.5.3. Market Size Analysis and Y-o-Y Growth Analysis (%), By Product
- 12.5.4. Market Size Analysis and Y-o-Y Growth Analysis (%), By Technology
- 12.5.5. Market Size Analysis and Y-o-Y Growth Analysis (%), By Communication
- 12.5.6. Market Size Analysis and Y-o-Y Growth Analysis (%), By Component
- 12.5.7. Market Size Analysis and Y-o-Y Growth Analysis (%), By End-User
- 12.5.8. Market Size Analysis and Y-o-Y Growth Analysis (%), By Country
- 12.5.8.1. China
- 12.5.8.2. India
- 12.5.8.3. Japan
- 12.5.8.4. Australia
- 12.5.8.5. Rest of Asia-Pacific
- 12.6. Middle East and Africa
- 12.6.1. Introduction
- 12.6.2. Key Region-Specific Dynamics
- 12.6.3. Market Size Analysis and Y-o-Y Growth Analysis (%), By Product
- 12.6.4. Market Size Analysis and Y-o-Y Growth Analysis (%), By Technology
- 12.6.5. Market Size Analysis and Y-o-Y Growth Analysis (%), By Communication
- 12.6.6. Market Size Analysis and Y-o-Y Growth Analysis (%), By Component
- 12.6.7. Market Size Analysis and Y-o-Y Growth Analysis (%), By End-User
13. Competitive Landscape
- 13.1. Competitive Scenario
- 13.2. Market Positioning/Share Analysis
- 13.3. Mergers and Acquisitions Analysis
14. Company Profiles
- 14.1. Landis+Gyr *
- 14.1.1. Company Overview
- 14.1.2. Product Portfolio and Description
- 14.1.3. Financial Overview
- 14.1.4. Key Developments
- 14.2. Itron
- 14.3. Honeywell International
- 14.4. Siemens AG
- 14.5. Kamstrup
- 14.6. Iskraemeco
- 14.7. Elster Group
- 14.8. ABB
- 14.9. Sensus
- 14.10. Schneider Electric
LIST NOT EXHAUSTIVE
15. Appendix
- 15.1. About Us and Services
- 15.2. Contact Us
