|
|
市場調査レポート
商品コード
1319144
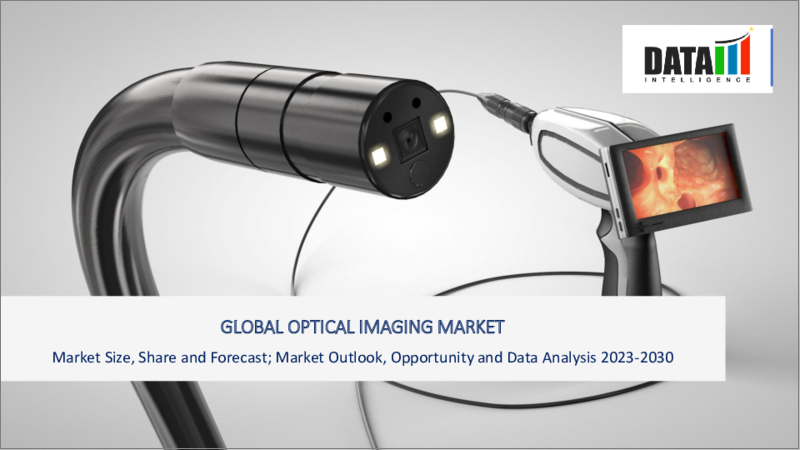
光学イメージングの世界市場-2023年~2030年Global Optical Imaging Market - 2023-2030 |
||||||
|
|
|||||||
カスタマイズ可能
適宜更新あり
|
|||||||


| 光学イメージングの世界市場-2023年~2030年 |
|
出版日: 2023年07月31日
発行: DataM Intelligence
ページ情報: 英文 195 Pages
納期: 即日から翌営業日
|

- 全表示
- 概要
- 目次
市場概要
世界の光学イメージング市場は、2022年に16億米ドルに達し、2030年には40億米ドルに達し、有利な成長が見込まれています。世界の光学イメージング市場は、予測期間(2023-2030年)に12.4%のCAGRを示すと予測されています。
光学イメージングでは、吸収や散乱などの光子特性を利用して、臓器や軟部組織の質を測定し、知覚します。光学イメージング技術はまだ開発の初期段階であるにもかかわらず、現在のイメージング方法よりもいくつかの技術的な利点があります。医師は様々な疾患の診断や治療に写真を使用し、科学者は様々な研究プロジェクトの実施に写真を使用します。イメージングに電離放射線を使用するMRIやX線に比べ、光学イメージングは格段に安全で効率的であることが示されています。
市場力学
腫瘍学における無放射線装置への需要の高まり
より安全で正確な診断機器への要望が、がんにおける放射線フリーの光学イメージング技術への需要を高めています。これらのアプローチには、リアルタイムイメージング、優れた解像度、分子レベルでの組織特性解析能力という利点があります。
光学イメージングは、放射線被曝を減らし、腫瘍生物学に関する重要な情報を提供することで、がんの検出、診断、治療計画の改善に重要な役割を果たしています。例えば、2022年10月、GenWorks社は、早期発見と放射線被曝の低減によって病院に革命をもたらすことを目指し、放射線不要で、使いやすく、接触型の乳がんスクリーニング装置であるBraster Proを発表しました。
光学イメージングの技術進歩が予測期間中の市場重要促進要因の1つ
光学イメージングの技術的進歩は、予測期間中の市場成長を支える重要な促進要因の1つです。光学イメージング技術の開発は、その能力を大幅に向上させ、医学、生物学、材料科学、その他を含む様々な分野で利用されています。
例えば、2023年3月、CytoVerisとAdventHealth Central Floridaは、手術中にAIを搭載したイメージングデバイスを使用することで前立腺がんの転帰を改善する臨床研究で協力しました。MarginASSUREと呼ばれるこの装置は、リアルタイムで正確なマージン評価を提供することにより、手術の意思決定と患者の転帰を向上させることを目的としています。
世界の光学イメージング市場における熟練オペレーターの不足
光学画像は高度な診断ツールであり、効果的な使用には熟練したオペレーターが必要です。しかし、特に発展途上国では有資格のオペレーターが不足しており、臨床診断用途での使用が妨げられています。急速に変化する技術状況により、ヘルスケアプロバイダーは高度な画像システムを操作するために必要なスキルを習得する必要があります。このような採用の遅れが、予測期間中の市場成長の妨げになると予想されます。
COVID-19影響分析
COVID-19の流行は、医師やその他のヘルスケア従事者が社会的距離を保つ必要性を高めました。COVID-19の結果、いくつかの画像診断部門は光画像症例数の急激な減少を目の当たりにしました。光画像症例の減少は、すべての診療現場の短期的・長期的な経済性に大きな影響を及ぼします。
Journal of the American College of Radiology(JACR)に掲載された研究によると、この世界の健康危機の間、2019年と比較すると、7週間にわたって総撮影件数の約28%の減少が観察され、これにはすべての患者サービスの場所と画像モダリティの種類が含まれていました。
ロシア・ウクライナ紛争の影響分析
ロシア・ウクライナ紛争は、この地域での普及率が低く、主要な市場プレーヤーが不在であることから、世界の光学イメージング市場に中程度の影響を与えると推定・予測されています。しかし、機器の輸出入の影響は、予測期間中、世界の光学イメージング市場の成長にほとんど影響を与えないと予測されています。
目次
第1章 調査手法と調査範囲
第2章 定義と概要
第3章 エグゼクティブサマリー
第4章 市場力学
- 影響要因
- 促進要因
- 腫瘍学における放射線フリー機器への需要の高まり
- 光学イメージング技術の進歩
- 抑制要因
- 光学イメージングの世界市場における熟練オペレーターの不足
- 機会
- 新しい技術
- 影響分析
- 促進要因
第5章 産業分析
- ポーターの5フォース分析
- サプライチェーン分析
- 価格分析
- 規制分析
第6章 COVID-19分析
第7章 技術別
- 光干渉断層計(OCT)
- 内視鏡
- 光音響イメージング
- 拡散光トモグラフィ(DOT)
- ラマン分光法
- 超解像顕微鏡
- その他
第8章 製品別
- イメージングシステム
- 照明システム
- ソフトウェア
- レンズ
- カメラ
第9章 治療領域別
- 眼科
- 腫瘍学
- 神経学
- 心臓病学
- 皮膚科
- その他
第10章 アプリケーション別
- 病理画像
- 術中画像
- その他
第11章 エンドユーザー別
- 病院/クリニック
- 画像診断センター
- 研究所
- その他
第12章 地域別
- 北米
- 米国
- カナダ
- メキシコ
- 欧州
- ドイツ
- 英国
- フランス
- スペイン
- イタリア
- その他欧州
- 南米
- ブラジル
- アルゼンチン
- その他南米
- アジア太平洋
- 中国
- インド
- 日本
- オーストラリア
- その他アジア太平洋地域
- 中東・アフリカ
第13章 競合情勢
- 競合シナリオ
- 市況/シェア分析
- M&A分析
第14章 企業プロファイル
- Abbott Laboratories
- 会社概要
- 製品ポートフォリオと説明
- 財務概要
- 主な発展
- Carl-Zeiss AG
- Canon Inc.
- Danaher Corporation
- Koninklijke Philips N.V.
- PerkinElmer Inc.
- Topcon Healthcare
- Leica Microsystems
- Visionix
- Cylite Pty Ltd
第15章 付録
Market Overview
The global optical imaging market reached US$ 1.6 billion in 2022 and is expected to witness lucrative growth by reaching up to US$ 4.0 billion by 2030. the global optical imaging market is expected to exhibit a CAGR of 12.4% during the forecast period (2023-2030).
Optical imaging employs photon characteristics such as absorption and scattering to measure and perceive the qualities of organs and soft tissues. Despite the fact that optical imaging technology is still in its early stages of development, it offers several technological benefits over current imaging methods. Doctors use photos to diagnose and cure various disorders, while scientists use them to conduct a variety of research projects. In comparison to MRI and X-ray, which employ ionising radiation for imaging, optical imaging has been shown to be significantly safer and more efficient.
Market Dynamics
Rising Demand For Radiation-Free Devices in Oncology
The desire for safer and more accurate diagnostic instruments drives the demand for radiation-free optical imaging techniques in cancer. These approaches have the benefit of real-time imaging, excellent resolution, and the ability to characterise tissues at the molecular level.
Optical imaging plays a critical role in improving cancer detection, diagnosis, and treatment planning by reducing radiation exposure and providing essential information about tumour biology. For instance, In Oct 2022, GenWorks introduced the Braster Pro, a radiation-free device, easy-to-use, contact-based breast cancer screening device, aiming to revolutionize hospitals by providing early detection and reducing radiation exposure.
Technological Advancements in Optical Imaging is one of the Key Significant Drivers in the Market during Forecast Period
Technological advancements in optical imaging is one of the key significant drivers that help the market to grow during the forecast period. Optical imaging technology developments have substantially improved its capabilities and use in a variety of sectors, including medicine, biology, materials science, and others.
For instance, In March 2023 CytoVeris and AdventHealth Central Florida have collaborated on a clinical study to improve prostate cancer outcomes by using AI-powered imaging devices during surgery. The device, called MarginASSURE, aims to enhance surgical decision-making and patient outcomes by providing real-time, accurate margin assessment.
Shortage of Skilled Operators in the Global Optical Imaging Market
Optical imaging is an advanced diagnostic tool that requires skilled operators for effective use. However, a shortage of qualified operators, especially in developing nations, hinders its use in clinical diagnostic applications. The rapidly changing technological landscape requires healthcare providers to acquire the necessary skills to operate advanced imaging systems. This delay in adoption is expected to hinder the market's growth during the forecast period.
COVID-19 Impact Analysis
The COVID-19 epidemic enhanced the necessity for doctors and other healthcare workers to maintain social distancing. As a result of COVID-19, several imaging and diagnostic departments have witnessed a rapid decline in optical imaging case volumes. The fall in optical imaging cases has major consequences for all practising settings' short- and long-term economic viability.
According to a study published in the Journal of the American College of Radiology (JACR), a nearly 28 per cent decrease in total imaging volume was observed during this global health crisis over a seven-week period when compared to 2019, and this included all patient service locations and imaging modality types.
Russia-Ukraine War Impact Analysis
The Russia-Ukraine conflict is estimated to have a moderate impact on the global optical imaging market, owing to the low prevalence and absence of key market players in this region. however, the impact of the import and export of devices is expected to have little influence over the global optical imaging market growth over the forecast period.
Segment Analysis
The global optical imaging market is segmented based on infection type, drug type, end user and region.
The Optical Coherence Tomography (OCT) from the Technology Segment Accounted for Approximately 40.1 % of the Optical Imaging Share
The optical coherence tomography from the technology segment with around (40.1%) is expected to dominate during the forecast period. Non-invasive imaging tests include optical coherence tomography (OCT) and optical coherence tomography angiography (OCTA). They capture cross-section photographs of your retina using light waves.
OCT is a non-invasive medical imaging tool that is increasingly being used in the regular examination and therapy of patients with neuro-ophthalmic diseases. Its capacity to define the optic nerve head, peripapillary retinal nerve fibre layer, and cellular layers of the macula, including the ganglion cell layer, allows for both qualitative and quantitative evaluation of optic nerve pathology.
For instance, In Sep 2022 Kubota Vision announced a collaboration agreement with Joslin Diabetes Center for their Patient Based Ophthalmology Suite (PBOS) in-home optical coherence tomography (OCT) device. The collaboration aims to evaluate the effectiveness of home-based OCT in evaluating diabetic macular edema and monitoring patients at risk for losing vision. The agreement aims to improve the quality of care for patients with diabetic macular edema.
Geographical Analysis
North America Accounted for Approximately 38.7% of the Market Share
North America is estimated to hold about 38.7% of the total market share throughout the forecast period with enormous possibilities. For instance, According to a report published in NCBI by the Department of Neurology, it is estimated that 30 million people in India suffer from neurological disorders. The optical image market is expected to grow due to the large patient pool, healthcare technology adaptation, government initiatives, and favourable insurance policies. Key players are also setting up regional headquarters and manufacturing plants in emerging economies like Singapore, China, Korea, and India, resulting in a positive growth curve in the optical imaging market.
Competitive Landscape
The major global players in optical imaging include: Abbott Laboratories, Carl-Zeiss AG, Canon Inc, Danaher Corporation, Koninklijke Philips N.V, PerkinElmer Inc, Topcon Healthcare, Leica Microsystems, Visionix, Cylite Pty Ltd and others.
Why Purchase the Report?
- To visualize the global optical imaging market segmentation based on technology, product, therapeutic area, application, end user and region. end user and region, as well as understand key commercial assets and players.
- Identify commercial opportunities by analyzing trends and co-development.
- Excel data sheet with numerous data points of optical imaging market level with all segments.
- PDF report consists of a comprehensive analysis after exhaustive qualitative interviews and an in-depth study.
Product mapping available as excel consisting of key products of all the major players.
The global optical imaging market report would provide approximately 53 tables, 54 figures and 195 Pages.
Target Audience 2023
- Manufacturers/ Buyers
- Industry Investors/Investment Bankers
- Research Professionals
- Emerging Companies
Table of Contents
1. Methodology and Scope
- 1.1. Research Methodology
- 1.2. Research Objective and Scope of the Report
2. Definition and Overview
3. Executive Summary
- 3.1. Snippet by Technology
- 3.2. Snippet by Product
- 3.3. Snippet by Therapeutic Area
- 3.4. Snippet by Application
- 3.5. Snippet by End User
- 3.6. Snippet by Region
4. Dynamics
- 4.1. Impacting Factors
- 4.1.1. Drivers
- 4.1.1.1. Rising demand for radiation-free devices in oncology
- 4.1.1.2. Technological Advancements in Optical Imaging
- 4.1.2. Restraints
- 4.1.2.1. Shortage of skilled operators in the Global Optical Imaging Market
- 4.1.3. Opportunity
- 4.1.3.1. Emerging Technologies
- 4.1.4. Impact Analysis
- 4.1.1. Drivers
5. Industry Analysis
- 5.1. Porter's 5 Forces Analysis
- 5.2. Supply Chain Analysis
- 5.3. Pricing Analysis
- 5.4. Regulatory Analysis
6. COVID-19 Analysis
- 6.1. Analysis of COVID-19
- 6.1.1. Scenario Before COVID-19
- 6.1.2. Scenario During COVID-19
- 6.1.3. Scenario Post COVID-19
- 6.2. Pricing Dynamics Amid COVID-19
- 6.3. Demand-Supply Spectrum
- 6.4. Government Initiatives Related to the Market During Pandemic
- 6.5. Manufacturers Strategic Initiatives
- 6.6. Conclusion
7. By Technology
- 7.1. Introduction
- 7.1.1. Market Size Analysis and Y-o-Y Growth Analysis (%), By Technology
- 7.1.2. Market Attractiveness Index, By Technology
- 7.2. Optical Coherence Tomography (OCT)*
- 7.2.1. Introduction
- 7.2.2. Market Size Analysis and Y-o-Y Growth Analysis (%)
- 7.3. Endoscopy
- 7.4. Photoacoustic imaging
- 7.5. Diffused optical tomography (DOT)
- 7.6. Raman Spectroscopy
- 7.7. Super-resolution microscopy
- 7.8. Others
8. By Product
- 8.1. Introduction
- 8.1.1. Market Size Analysis and Y-o-Y Growth Analysis (%), By Product
- 8.1.2. Market Attractiveness Index, By Product
- 8.2. Imaging System *
- 8.2.1. Introduction
- 8.2.2. Market Size Analysis and Y-o-Y Growth Analysis (%)
- 8.3. Illumination System
- 8.4. Software
- 8.5. Lenses
- 8.6. Camera
9. By Therapeutic Area
- 9.1. Introduction
- 9.1.1. Market Size Analysis and Y-o-Y Growth Analysis (%), By Therapeutic Area
- 9.1.2. Market Attractiveness Index, By Therapeutic Area
- 9.2. Ophthalmology *
- 9.2.1. Introduction
- 9.2.2. Market Size Analysis and Y-o-Y Growth Analysis (%)
- 9.3. Oncology
- 9.4. Neurology
- 9.5. Cardiology
- 9.6. Dermatology
- 9.7. Others
10. By Application
- 10.1. Introduction
- 10.1.1. Market Size Analysis and Y-o-Y Growth Analysis (%), By Application
- 10.1.2. Market Attractiveness Index, By Application
- 10.2. Pathological Imaging *
- 10.2.1. Introduction
- 10.2.2. Market Size Analysis and Y-o-Y Growth Analysis (%)
- 10.3. Intra-Operative Imaging
- 10.4. Others
11. By End User
- 11.1. Introduction
- 11.1.1. Market Size Analysis and Y-o-Y Growth Analysis (%), By End User
- 11.1.2. Market Attractiveness Index, By End User
- 11.2. Hospitals/Clinics *
- 11.2.1. Introduction
- 11.2.2. Market Size Analysis and Y-o-Y Growth Analysis (%)
- 11.3. Diagnostic Imaging Centres
- 11.4. Research Laboratories
- 11.5. Others
12. By Region
- 12.1. Introduction
- 12.1.1. Market Size Analysis and Y-o-Y Growth Analysis (%), By Region
- 12.1.2. Market Attractiveness Index, By Region
- 12.2. North America
- 12.2.1. Introduction
- 12.2.2. Key Region-Specific Dynamics
- 12.2.3. Market Size Analysis and Y-o-Y Growth Analysis (%), By Technology
- 12.2.4. Market Size Analysis and Y-o-Y Growth Analysis (%), By Product
- 12.2.5. Market Size Analysis and Y-o-Y Growth Analysis (%), By Therapeutic Area
- 12.2.6. Market Size Analysis and Y-o-Y Growth Analysis (%), By Application
- 12.2.7. Market Size Analysis and Y-o-Y Growth Analysis (%), By End User
- 12.2.8. Market Size Analysis and Y-o-Y Growth Analysis (%), By Country
- 12.2.8.1. U.S.
- 12.2.8.2. Canada
- 12.2.8.3. Mexico
- 12.3. Europe
- 12.3.1. Introduction
- 12.3.2. Key Region-Specific Dynamics
- 12.3.3. Market Size Analysis and Y-o-Y Growth Analysis (%), By Technology
- 12.3.4. Market Size Analysis and Y-o-Y Growth Analysis (%), By Product
- 12.3.5. Market Size Analysis and Y-o-Y Growth Analysis (%), By Therapeutic Area
- 12.3.6. Market Size Analysis and Y-o-Y Growth Analysis (%), By Application
- 12.3.7. Market Size Analysis and Y-o-Y Growth Analysis (%), By End User
- 12.3.8. Market Size Analysis and Y-o-Y Growth Analysis (%), By Country
- 12.3.8.1. Germany
- 12.3.8.2. U.K.
- 12.3.8.3. France
- 12.3.8.4. Spain
- 12.3.8.5. Italy
- 12.3.8.6. Rest of Europe
- 12.4. South America
- 12.4.1. Introduction
- 12.4.2. Key Region-Specific Dynamics
- 12.4.3. Market Size Analysis and Y-o-Y Growth Analysis (%), By Technology
- 12.4.4. Market Size Analysis and Y-o-Y Growth Analysis (%), By Product
- 12.4.5. Market Size Analysis and Y-o-Y Growth Analysis (%), By Therapeutic Area
- 12.4.6. Market Size Analysis and Y-o-Y Growth Analysis (%), By Application
- 12.4.7. Market Size Analysis and Y-o-Y Growth Analysis (%), By End User
- 12.4.8. Market Size Analysis and Y-o-Y Growth Analysis (%), By Country
- 12.4.8.1. Brazil
- 12.4.8.2. Argentina
- 12.4.8.3. Rest of South America
- 12.5. Asia-Pacific
- 12.5.1. Introduction
- 12.5.2. Key Region-Specific Dynamics
- 12.5.3. Market Size Analysis and Y-o-Y Growth Analysis (%), By Technology
- 12.5.4. Market Size Analysis and Y-o-Y Growth Analysis (%), By Product
- 12.5.5. Market Size Analysis and Y-o-Y Growth Analysis (%), By Therapeutic Area
- 12.5.6. Market Size Analysis and Y-o-Y Growth Analysis (%), By Application
- 12.5.7. Market Size Analysis and Y-o-Y Growth Analysis (%), By End User
- 12.5.8. Market Size Analysis and Y-o-Y Growth Analysis (%), By Country
- 12.5.8.1. China
- 12.5.8.2. India
- 12.5.8.3. Japan
- 12.5.8.4. Australia
- 12.5.8.5. Rest of Asia-Pacific
- 12.6. Middle East and Africa
- 12.6.1. Introduction
- 12.6.2. Key Region-Specific Dynamics
- 12.6.3. Market Size Analysis and Y-o-Y Growth Analysis (%), By Technology
- 12.6.4. Market Size Analysis and Y-o-Y Growth Analysis (%), By Product
- 12.6.5. Market Size Analysis and Y-o-Y Growth Analysis (%), By Therapeutic Area
- 12.6.6. Market Size Analysis and Y-o-Y Growth Analysis (%), By Application
- 12.6.7. Market Size Analysis and Y-o-Y Growth Analysis (%), By End User
13. Competitive Landscape
- 13.1. Competitive Scenario
- 13.2. Market Positioning/Share Analysis
- 13.3. Mergers and Acquisitions Analysis
14. Company Profiles
- 14.1. Abbott Laboratories*
- 14.1.1. Company Overview
- 14.1.2. Product Portfolio and Description
- 14.1.3. Financial Overview
- 14.1.4. Key Developments
- 14.2. Carl-Zeiss AG
- 14.3. Canon Inc.
- 14.4. Danaher Corporation
- 14.5. Koninklijke Philips N.V.
- 14.6. PerkinElmer Inc.
- 14.7. Topcon Healthcare
- 14.8. Leica Microsystems
- 14.9. Visionix
- 14.10. Cylite Pty Ltd
LIST NOT EXHAUSTIVE
15. Appendix
- 15.1. About Us and Services
- 15.2. Contact Us
