|
|
市場調査レポート
商品コード
1608259
世界の家具製造業者トップ200社Top 200 Furniture Manufacturers Worldwide |
||||||
|
|||||||
| 世界の家具製造業者トップ200社 |
|
出版日: 2024年11月30日
発行: CSIL Centre for Industrial Studies
ページ情報: 英文 247 Pages
納期: 即日から翌営業日
|

全表示
- 概要
- 目次
ハイライト
トップ200社の売上高と世界全体の家具生産
指数(2019=100)
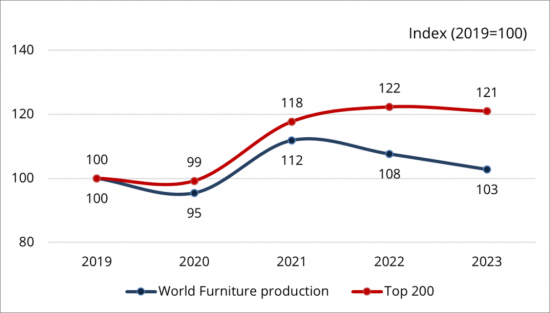
出典CSIL
世界の家具製造業者トップ200社による家具の総売上高は約1,600億米ドルを示しています。また、トップ200社の総売上高は2019年から2023年にかけて著しい成長を遂げ、同期間の売上高実績では業界全体を大きく上回る見通しです。この成長は、前例のない課題に直面する業界大手企業の回復力と戦略的敏捷性を示しています。
当レポートは、世界の主要な家具製造業者を特定、比較、紹介するための広範な調査の結果を掲載しています。
調査結果は2つのセクションで構成されています:
I. 世界の家具セクターの概要:本パートでは、世界の家具セクターの背景情報を提供し、2015年から2024年までの地域ごとの家具生産の推移と家具の国際貿易に焦点を当てています。
世界の家具製造業者トップ200社:多様な企業グループの章では、以下の統計と比較分析を行っています:
- 地域:本社および製造工場の数と所在地
- 財務実績:売上高・従業員数
- 戦略:製造拠点・M&A
- 家具部門の専門性
- サステナビリティの概要
II. 家具製造業者トップ200社の詳細プロファイル:各企業プロファイルは、家具製造業者の主な特徴、活動など包括的で詳細な情報を提供しています。
掲載内容:
- 企業名、設立年、本社、ウェブサイト、Eメールアドレス
- 事業活動、製品ポートフォリオ、製品の専門性、傘下企業および子会社
- 財務指標、総売上高と従業員数の動向、地域別売上高内訳
- 生産設備、製品別売上高内訳
- 流通、小売店、eコマースプラットフォーム、ブランドの詳細に関する情報
- サステナビリティ戦略と取り組み
目次(要約)
第1章 イントロダクション:本書の目的と内容
第2章 調査手法・注記
セクション1:世界の家具製造業者トップ200社の分析
第3章 背景:世界の家具産業と国際貿易の概要
- 世界の家具生産:2015-2024年
- 世界の家具貿易:2015-2026年
第4章 家具製造業者トップ200社:多様な企業グループ
- 世界のトップクラスの家具製造業者の選定
- 世界の家具業界におけるトップ200製造業者の代表性
- 地域的範囲
- 家具製造業者トップ200社の製造工場数と所在地
- 家具製造業者トップ200社:製品別
- 財務実績:売上高と雇用 (本社所在地・専門分野別の内訳)
- 家具製造業者トップ200社の業績
- 家具製造業者トップ200社:M&A
- 家具製造業者トップ200社:持続可能性戦略と取り組み
セクション2:家具製造業者トップ200社のプロファイル
第5章 世界のトップ200家具製造業者
- サマリーテーブル:売上高順・アルファベット順 (欧州・南北アメリカ・アジア太平洋)
- 企業プロファイル
- 企業名、設立年、本社所在地、ウェブサイト、メールアドレス
- 事業活動、製品ポートフォリオと製品の専門性、管理会社と子会社
- 財務指標、総収益と従業員数の動向、地域別の売上内訳
- 生産拠点と製品別の売上内訳
- 流通、小売店、eコマースプラットフォーム、ブランドの詳細に関する情報
- 持続可能性戦略と取り組み
The CSIL report "Top 200 furniture manufacturers worldwide" is the result of extensive research work to identify, compare, and profile the leading furniture manufacturers in the world.
The output of the research is organized into two sections:
I. OVERVIEW OF THE GLOBAL FURNITURE SECTOR: this part offers background information on the world furniture sector highlighting the evolution of global furniture production by geographical region for the time frame 2015-2024, and the international trade of furniture.
The chapter Top 200 furniture manufacturers: a heterogeneous group of companies presents aggregated statistics and comparative analysis according to:
- Geographical coverage: Headquarters and manufacturing plants number and location
- Financial performance: turnover and number of employees
- Strategies: manufacturing footprint, mergers, and acquisitions
- Furniture segment specialization
- Sustainability overview
II. THE TOP 200 FURNITURE MANUFACTURERS. DETAILED PROFILES. Each company profile provides comprehensive and detailed information for an in-depth overview of furniture manufacturers' key characteristics and activities.
Specifically, they include:
- Company name, year of establishment, headquarters, website, company e-mail address
- Business activity, product portfolio and product specialization, controlled companies and subsidiaries
- Financial indicators, trends in total revenue and number of employees, sales breakdown by geographical area
- Production facilities and sales breakdown by product
- Information on distribution, retail stores, e-commerce platforms, and brand details
- Sustainability strategies and initiatives
The 'Top 200 Furniture Manufacturers Worldwide' report also provides summary tables, with company data by turnover and alphabetical order, even broken down by country and geographical area (Europe, Americas, Asia and Pacific).
The segments identified are: Office furniture; Kitchen furniture, Upholstered furniture; Soft furniture, Outdoor furniture and Multiproduct furniture (including the mentioned segments plus other furniture, e.g., dining/living room furniture, bedrooms, bathroom, etc.). A group of companies is identified as Multiproduct when they are not specialized in furniture production.
Countries and regions covered: The selected companies have headquarters in the following countries: Australia, Austria, Brazil, Canada, China, Denmark, Finland, France, Germany, Hong Kong, China, India, Italy, Japan, Liechtenstein, Lithuania, Malaysia, Netherlands, Norway, Poland, Portugal, Romania, Singapore, South Africa, South Korea, Spain, Sweden, Switzerland, Taiwan, Turkey, United Kingdom, United States, Vietnam.
Highlights:
Top 200 furniture turnover and world furniture production, production,
Index (2019=100)
Source: CSIL
According to CSIL, the Top 200 furniture manufacturers in the world generate a combined furniture turnover of around USD 160 billion.
The total turnover of the Top 200 furniture producers experienced remarkable growth between 2019 and 2023, significantly outpacing the overall sector in terms of sales performance during the same period. This growth highlights the resilience and strategic agility of the industry's leading players in the face of unprecedented challenges. Their stronger financial resources and established market positions enabled them to respond swiftly, implementing a range of adaptive measures and ensuring greater flexibility.
TABLE OF CONTENTS (ABSTRACT)
1. INTRODUCTION: Aim of the report and contents
2. METHODOLOGICAL NOTES
SECTION ONE: ANALYSIS OF THE TOP 200 FURNITURE MANUFACTURERS ON A GLOBAL LEVEL
3. THE BACKGROUND: Overview of the world furniture industry and international trade
- World furniture production, 2015-2024
- World furniture trade, 2015-2026
4. TOP 200 FURNITURE MANUFACTURERS: A HETEROGENEOUS GROUP OF COMPANIES
- 4.1. Selection of the world leading furniture manufacturers
- 4.2. Top 200 furniture manufacturers' representativeness in the world furniture industry
- 4.3. Geographical coverage
- 4.4. Manufacturing plants of the Top 200 furniture manufacturers: number and location
- 4.5. Top 200 furniture manufacturers by product specialization
- 4.6. Financial performance: Turnover and employment. Breakdown by geographical location of headquarters and by company specialization in the furniture segment
- 4.7. Business performance of the Top 200 furniture manufacturers
- Top 200 furniture turnover and world furniture production
- Top 200 furniture turnover by geographical area of headquarters and by product specialization
- 4.8. Top 200 furniture manufacturers: Mergers & Acquisitions
- 4.9. Top 200 furniture manufacturers: Sustainability strategies and initiatives
SECTION TWO: TOP 200 FURNITURE MANUFACTURERS' PROFILES
5. TOP 200 FURNITURE MANUFACTURERS WORLDWIDE
- 5.1. Summary tables: Turnover order, Alphabetical order, Europe, Americas and Asia Pacific
- 5.2. Company profiles. For each considered furniture manufacturer
- Company name, year of establishment, headquarters, website, e-mail address
- Business activity, product portfolio and product specialization, controlled companies and subsidiaries
- Financial indicators, trends in total revenues and number of employees, sales breakdown by geographical area
- Production facilities and sales breakdown by product
- Information on distribution, retail stores, e-commerce platforms, and brand details
- Sustainability strategies and initiatives

