
|
市場調査レポート
商品コード
1608898
カーボンフットプリント削減市場:ソリューションタイプ別、エンドユーザー別、地域別Carbon Footprint Reduction Market, By Solution Type, By End User, By Geography |
||||||
カスタマイズ可能
|
|||||||

| カーボンフットプリント削減市場:ソリューションタイプ別、エンドユーザー別、地域別 |
|
出版日: 2024年11月25日
発行: Coherent Market Insights
ページ情報: 英文 120 Pages
納期: 2~3営業日
|

- 全表示
- 概要
- 目次
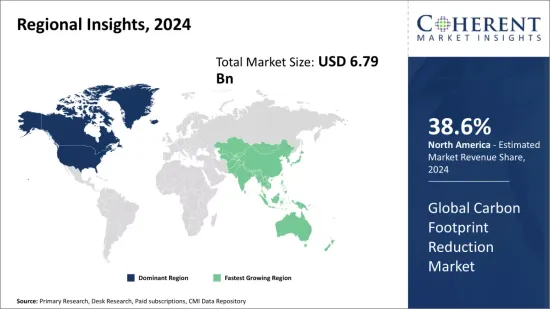
世界のカーボンフットプリント削減市場は、2024年には67億9,000万米ドルと推定され、2031年には233億2,000万米ドルに達すると予測され、2024年から2031年までのCAGRは19.3%です。
| レポート範囲 | レポート詳細 | ||
|---|---|---|---|
| 基準年 | 2023 | 2024年の市場規模 | 67億9,000万米ドル |
| 実績データ | 2019年~2023年 | 予測期間 | 2024年から2031年 |
| 予測期間2024年から2031年 CAGR: | 19.30% | 2031年の金額予測 | 233億2,000万米ドル |
カーボン・フットプリント削減の世界市場は、環境汚染に対する懸念の高まりと、より持続可能な慣行への転換の必要性によって、近年著しい成長を遂げています。カーボンフットプリントとは、個人、イベント、組織、サービス、製品によって直接的・間接的に引き起こされる温室効果ガスの総排出量を指します。カーボンフットプリントの削減には、二酸化炭素やその他の温室効果ガスの大気中への排出を最小限に抑えるための、さまざまな分野にわたる取り組みが必要です。エネルギー効率化、再生可能エネルギー導入、持続可能な輸送、植林プログラムに対するニーズの高まりが、カーボンフットプリント削減活動の需要を促進すると予想されます。各国は今後数十年の間にネットゼロ排出目標を達成することを約束しており、低炭素技術やソリューションへの投資は加速するとみられます。
市場力学:
世界のカーボンフットプリント削減市場は、いくつかの要因によって、予測期間中に顕著な成長を遂げると予測されます。産業や輸送部門からの二酸化炭素排出に関する政府規制の高まりにより、企業はカーボンフットプリントの削減に注力せざるを得なくなっています。その結果、温室効果ガスの排出量を削減する技術やサービスに対する需要が高まっています。クリーン・エネルギーの採用に対する炭素クレジットや税制優遇措置という好意的な規制政策が、カーボン・オフセットの取り組みへの投資を産業界にさらに促しています。一方、持続可能性の目標を達成するために再生可能な電源に移行する必要性が高まっており、ソーラーパネル、風力タービン、その他のグリーン・エネルギー・インフラストラクチャの売上が世界的に増加しています。しかし、炭素削減プロジェクトの実施に伴う初期コストの高さが、大規模な導入の妨げになる可能性があります。また、低開発地域における認識不足も課題となっています。しかし、カーボンプライシングプログラムの成長と炭素クレジットの利用可能性は、市場拡大の有利な機会を提供しています。
本調査の主な特徴
当レポートでは、世界のカーボンフットプリント削減市場を詳細に分析し、2023年を基準年とした予測期間(2024年~2031年)の市場規模(10億米ドル)と年間平均成長率(CAGR%)を掲載しています。
また、さまざまなセグメントにわたる潜在的な収益機会を明らかにし、この市場の魅力的な投資提案マトリクスについて解説しています。
また、市場促進要因、抑制要因、機会、新製品の発売や承認、市場動向、地域別の展望、主要企業が採用する競争戦略などに関する重要な考察も提供しています。
企業ハイライト、製品ポートフォリオ、主要なハイライト、財務実績、戦略などのパラメータに基づいて、世界のカーボンフットプリント削減市場の主要企業をプロファイルしています。
本調査の対象となる主要企業には、シーメンスAG、シュナイダーエレクトリックSE、ゼネラルエレクトリック、ジョンソンコントロールズ・インターナショナルplc、エネルSpA、ヴェオリア・エンバイロメントS.A.、カーボン・クリーン・ソリューションズ・リミテッド、エコアクト、3Mカンパニー、BP p.l.c.、トータルエナジーズSE、ザ・ネイチャー・コンサーバンシー、クライメートパートナー、カーボントラスト、DNV GLなどが含まれます。
このレポートからの洞察により、マーケティング担当者や企業の経営陣は、将来の製品発売、タイプアップ、市場拡大、マーケティング戦術に関する情報に基づいた意思決定を行うことができます。
この調査レポートは、投資家、サプライヤー、製品メーカー、流通業者、新規参入者、財務アナリストなど、この業界のさまざまな利害関係者を対象としています。
利害関係者は、世界のカーボンフットプリント削減市場の分析に使用される様々な戦略マトリックスを通じて、意思決定を容易にすることができます。
目次
第1章 調査の目的と前提条件
- 調査目的
- 前提条件
- 略語
第2章 市場の展望
- レポートの説明
- 市場の定義と範囲
- エグゼクティブサマリー
第3章 市場力学、規制、動向分析
- 市場力学
- 影響分析
- 主なハイライト
- 規制シナリオ
- 製品の発売/承認
- PEST分析
- PORTERの分析
- 市場機会
- 規制シナリオ
- 主な発展
- 業界動向
第4章 世界のカーボンフットプリント削減市場、ソリューションタイプ別、2019年-2031年
- カーボンオフセットプロジェクト
- エネルギー効率ソリューション
- 再生可能エネルギー源
- 持続可能な輸送
第5章 世界のカーボンフットプリント削減市場、エンドユーザー別、2019年-2031年
- 企業
- 政府
- 住宅
- 非営利団体
第6章 世界のカーボンフットプリント削減市場、地域別、2019年-2031年
- 北米
- ラテンアメリカ
- 欧州
- アジア太平洋
- 中東
- アフリカ
第7章 競合情勢
- Siemens AG
- Schneider Electric SE
- General Electric Company
- Johnson Controls International plc
- Enel SpA
- Veolia Environnement S.A.
- Carbon Clean Solutions Limited
- EcoAct
- 3M Company
- BP p.l.c.
- TotalEnergies SE
- The Nature Conservancy
- ClimatePartner
- Carbon Trust
- DNV GL
第8章 アナリストの推奨事項
- 運命の輪
- アナリストの見解
- 一貫した機会マップ
第9章 参考文献と調査手法
- 参考文献
- 調査手法
- 出版社について
The global carbon footprint reduction market is estimated to be valued at USD 6.79 Bn in 2024 and is expected to reach USD 23.32 Bn by 2031, exhibiting a compound annual growth rate (CAGR) of 19.3% from 2024 to 2031.
| Report Coverage | Report Details | ||
|---|---|---|---|
| Base Year: | 2023 | Market Size in 2024: | 6.79 Bn |
| Historical Data for: | 2019 to 2023 | Forecast Period: | 2024 to 2031 |
| Forecast Period 2024 to 2031 CAGR: | 19.30% | 2031 Value Projection: | 23.32 Bn |
The global carbon footprint reduction market has been witnessing significant growth in recent years, driven by the increasing concerns about environmental pollution and the need to transition towards more sustainable practices. Carbon footprint refers to the total greenhouse gas emissions caused directly and indirectly by an individual, event, organization, service, or product. Reducing carbon footprint involves various initiatives across different sectors to minimize the emission of carbon dioxide and other greenhouse gases into the atmosphere. Growing need for energy efficiency, renewable energy adoption, sustainable transportation and afforestation programs are expected to drive the demand for carbon footprint reduction activities. With nations committing to achieve net zero emissions targets over the coming decades, investments in low-carbon technologies and solutions are likely to accelerate.
Market Dynamics:
The global carbon footprint reduction market is projected to experience notable growth over the forecast period, driven by several factors. Growing government regulations regarding carbon emissions from industries and transportation sectors have compelled organizations to focus on reducing their carbon footprints. Subsequently, this has increased the demand for technologies and services that help lower greenhouse gas emissions. Favorable regulatory policies in the form of carbon credits and tax incentives for adopting clean energy are further encouraging industries to invest in carbon offsetting initiatives. Meanwhile, rising need to transition to renewable power sources to achieve sustainability goals has augmented the sales of solar panels, wind turbines and other green energy infrastructure worldwide. However, high initial costs associated with implementing carbon reduction projects could hinder the large-scale adoption. Also, lack of awareness in underdeveloped regions poses a challenge. But growing carbon pricing programs and the availability of carbon credits present lucrative opportunities for market expansion.
Key Features of the Study:
This report provides in-depth analysis of the global carbon footprint reduction market, and provides market size (USD Bn) and compound annual growth rate (CAGR%) for the forecast period (2024-2031), considering 2023 as the base year
It elucidates potential revenue opportunities across different segments and explains attractive investment proposition matrices for this market
This study also provides key insights about market drivers, restraints, opportunities, new product launches or approvals, market trends, regional outlook, and competitive strategies adopted by key players
It profiles key players in the global carbon footprint reduction market based on the following parameters - company highlights, products portfolio, key highlights, financial performance, and strategies
Key companies covered as a part of this study include Siemens AG, Schneider Electric SE, General Electric Company, Johnson Controls International plc, Enel SpA, Veolia Environnement S.A., Carbon Clean Solutions Limited, EcoAct, 3M Company, BP p.l.c., TotalEnergies SE, The Nature Conservancy, ClimatePartner, Carbon Trust, and DNV GL
Insights from this report would allow marketers and the management authorities of the companies to make informed decisions regarding their future product launches, type up-gradation, market expansion, and marketing tactics
The global carbon footprint reduction market report caters to various stakeholders in this industry including investors, suppliers, product manufacturers, distributors, new entrants, and financial analysts
Stakeholders would have ease in decision-making through various strategy matrices used in analyzing the global carbon footprint reduction market
Market Segmentation
- By Solution Type Insights (Revenue, USD Bn, 2019 - 2031)
- Carbon Offset Projects
- Energy Efficiency Solutions
- Renewable Energy Sources
- Sustainable Transportation
- By End User Insights (Revenue, USD Bn, 2019 - 2031)
- Corporate
- Government
- Residential
- Non-Profit Organizations
- Regional Insights (Revenue, USD Bn, 2019 - 2031)
- North America
- U.S.
- Canada
- Latin America
- Brazil
- Argentina
- Mexico
- Rest of Latin America
- Europe
- Germany
- U.K.
- Spain
- France
- Italy
- Russia
- Rest of Europe
- Asia Pacific
- China
- India
- Japan
- Australia
- South Korea
- ASEAN
- Rest of Asia Pacific
- Middle East
- GCC Countries
- Israel
- Rest of Middle East
- Africa
- South Africa
- North Africa
- Central Africa
- Key Players Insights
- Siemens AG
- Schneider Electric SE
- General Electric Company
- Johnson Controls International plc
- Enel SpA
- Veolia Environnement S.A.
- Carbon Clean Solutions Limited
- EcoAct
- 3M Company
- BP p.l.c.
- TotalEnergies SE
- The Nature Conservancy
- ClimatePartner
- Carbon Trust
- DNV GL
Table of Contents
1. Research Objectives and Assumptions
- Research Objectives
- Assumptions
- Abbreviations
2. Market Purview
- Report Description
- Market Definition and Scope
- Executive Summary
- Global Carbon Footprint Reduction Market, By Solution Type
- Global Carbon Footprint Reduction Market, By End User
- Global Carbon Footprint Reduction Market, By Region
3. Market Dynamics, Regulations, and Trends Analysis
- Market Dynamics
- Impact Analysis
- Key Highlights
- Regulatory Scenario
- Product Launches/Approvals
- PEST Analysis
- PORTER's Analysis
- Market Opportunities
- Regulatory Scenario
- Key Developments
- Industry Trend
4. Global Carbon Footprint Reduction Market, By Solution Type, 2019-2031, (USD Bn)
- Introduction
- Market Share Analysis, 2024 and 2031 (%)
- Y-o-Y Growth Analysis, 2020 - 2031
- Segment Trends
- Carbon Offset Projects
- Introduction
- Market Size and Forecast, and Y-o-Y Growth, 2019-2031, (USD Bn)
- Energy Efficiency Solutions
- Introduction
- Market Size and Forecast, and Y-o-Y Growth, 2019-2031, (USD Bn)
- Renewable Energy Sources
- Introduction
- Market Size and Forecast, and Y-o-Y Growth, 2019-2031, (USD Bn)
- Sustainable Transportation
- Introduction
- Market Size and Forecast, and Y-o-Y Growth, 2019-2031, (USD Bn)
5. Global Carbon Footprint Reduction Market, By End User, 2019-2031, (USD Bn)
- Introduction
- Market Share Analysis, 2024 and 2031 (%)
- Y-o-Y Growth Analysis, 2020 - 2031
- Segment Trends
- Corporate
- Introduction
- Market Size and Forecast, and Y-o-Y Growth, 2019-2031, (USD Bn)
- Government
- Introduction
- Market Size and Forecast, and Y-o-Y Growth, 2019-2031, (USD Bn)
- Residential
- Introduction
- Market Size and Forecast, and Y-o-Y Growth, 2019-2031, (USD Bn)
- Non-Profit Organizations
- Introduction
- Market Size and Forecast, and Y-o-Y Growth, 2019-2031, (USD Bn)
6. Global Carbon Footprint Reduction Market, By Region, 2019 - 2031, Value (USD Bn)
- Introduction
- Market Share (%) Analysis, 2024,2027 & 2031, Value (USD Bn)
- Market Y-o-Y Growth Analysis (%), 2020 - 2031, Value (USD Bn)
- Regional Trends
- North America
- Introduction
- Market Size and Forecast, By Solution Type, 2019 - 2031, Value (USD Bn)
- Market Size and Forecast, By End-user, 2019 - 2031, Value (USD Bn)
- Market Size and Forecast, By Country, 2019 - 2031, Value (USD Bn)
- U.S.
- Canada
- Latin America
- Introduction
- Market Size and Forecast, By Solution Type, 2019 - 2031, Value (USD Bn)
- Market Size and Forecast, By End-user, 2019 - 2031, Value (USD Bn)
- Market Size and Forecast, By Country, 2019 - 2031, Value (USD Bn)
- Brazil
- Argentina
- Mexico
- Rest of Latin America
- Europe
- Introduction
- Market Size and Forecast, By Solution Type, 2019 - 2031, Value (USD Bn)
- Market Size and Forecast, By End-user, 2019 - 2031, Value (USD Bn)
- Market Size and Forecast, By Country, 2019 - 2031, Value (USD Bn)
- Germany
- U.K.
- Spain
- France
- Italy
- Russia
- Rest of Europe
- Asia Pacific
- Introduction
- Market Size and Forecast, By Solution Type, 2019 - 2031, Value (USD Bn)
- Market Size and Forecast, By End-user, 2019 - 2031, Value (USD Bn)
- Market Size and Forecast, By Country, 2019 - 2031, Value (USD Bn)
- China
- India
- Japan
- Australia
- South Korea
- ASEAN
- Rest of Asia Pacific
- Middle East
- Introduction
- Market Size and Forecast, By Solution Type, 2019 - 2031, Value (USD Bn)
- Market Size and Forecast, By End-user, 2019 - 2031, Value (USD Bn)
- Market Size and Forecast, By Country, 2019 - 2031, Value (USD Bn)
- GCC Countries
- Israel
- Rest of Middle East
- Africa
- Introduction
- Market Size and Forecast, By Solution Type, 2019 - 2031, Value (USD Bn)
- Market Size and Forecast, By End-user, 2019 - 2031, Value (USD Bn)
- Market Size and Forecast, By Country/Region, 2019 - 2031, Value (USD Bn)
- South Africa
- North Africa
- Central Africa
7. Competitive Landscape
- Siemens AG
- Company Highlights
- Product Portfolio
- Key Developments
- Financial Performance
- Strategies
- Schneider Electric SE
- Company Highlights
- Product Portfolio
- Key Developments
- Financial Performance
- Strategies
- General Electric Company
- Company Highlights
- Product Portfolio
- Key Developments
- Financial Performance
- Strategies
- Johnson Controls International plc
- Company Highlights
- Product Portfolio
- Key Developments
- Financial Performance
- Strategies
- Enel SpA
- Company Highlights
- Product Portfolio
- Key Developments
- Financial Performance
- Strategies
- Veolia Environnement S.A.
- Company Highlights
- Product Portfolio
- Key Developments
- Financial Performance
- Strategies
- Carbon Clean Solutions Limited
- Company Highlights
- Product Portfolio
- Key Developments
- Financial Performance
- Strategies
- EcoAct
- Company Highlights
- Product Portfolio
- Key Developments
- Financial Performance
- Strategies
- 3M Company
- Company Highlights
- Product Portfolio
- Key Developments
- Financial Performance
- Strategies
- BP p.l.c.
- Company Highlights
- Product Portfolio
- Key Developments
- Financial Performance
- Strategies
- TotalEnergies SE
- Company Highlights
- Product Portfolio
- Key Developments
- Financial Performance
- Strategies
- The Nature Conservancy
- Company Highlights
- Product Portfolio
- Key Developments
- Financial Performance
- Strategies
- ClimatePartner
- Company Highlights
- Product Portfolio
- Key Developments
- Financial Performance
- Strategies
- Carbon Trust
- Company Highlights
- Product Portfolio
- Key Developments
- Financial Performance
- Strategies
- DNV GL
- Company Highlights
- Product Portfolio
- Key Developments
- Financial Performance
- Strategies
8. Analyst Recommendations
- Wheel of Fortune
- Analyst View
- Coherent Opportunity Map
9. References and Research Methodology
- References
- Research Methodology
- About us