
|
市場調査レポート
商品コード
1608882
エネルギーレジリエンス市場:タイプ別、用途別、地域別Energy Resilience Market, By Type, By Application, By Geography |
||||||
カスタマイズ可能
|
|||||||

| エネルギーレジリエンス市場:タイプ別、用途別、地域別 |
|
出版日: 2024年11月21日
発行: Coherent Market Insights
ページ情報: 英文 165 Pages
納期: 2~3営業日
|

- 全表示
- 概要
- 目次
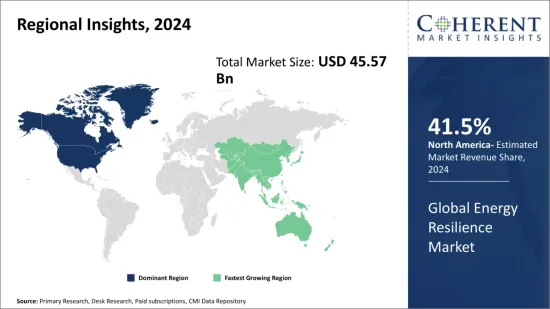
世界のエネルギーレジリエンス市場の2024年の市場規模は455億7,000万米ドルと推定され、2031年には857億7,000万米ドルに達すると予測され、2024年から2031年までのCAGRは9.5%です。
| レポート範囲 | レポート詳細 | ||
|---|---|---|---|
| 基準年 | 2023 | 2024年の市場規模 | 455億7,000万米ドル |
| 実績データ | 2019年~2023年 | 予測期間 | 2024年から2031年 |
| 予測期間2024年から2031年 CAGR: | 9.50% | 2031年の金額予測 | 857億7,000万米ドル |
世界のエネルギーレジリエンス市場は、停電の増加、バックアップ電源ソリューションの進歩、さまざまな部門における無停電電源の確保への注力などの要因により、大きな成長を遂げています。IT・通信、医療、製造業などの主要な最終用途産業では、ミッションクリティカルな業務を支えるために信頼性の高い電源が継続的に必要とされています。重要インフラの強化やスマート・マイクログリッドの確立に向けた投資の増加は、エネルギーレジリエンスソリューションの需要をさらに押し上げています。
市場力学
世界のエネルギーレジリエンス市場の成長を牽引しているのは、電力インフラの老朽化や悪天候による停電の増加といった要因です。さらに、オングリッドとオフグリッドの両方の用途に対応したスマート・マイクログリッドの確立に向けた政府や企業による投資の増加が需要を促進しています。しかし、バックアップ電源ソリューションの展開に必要な初期資本要件が高いため、市場成長の妨げになる可能性があります。分散型エネルギー資源の出現と再生可能エネルギー統合への注力は、有利な機会を提供します。市場開拓者は、効率を高めるために、統合されたストレージと制御を備えたハイブリッド電源ソリューションを開発するための研究開発に投資しています。AIとIoTの採用も急成長が見込まれます。新興国の企業は新たな要件に対応するため、革新的で持続可能な製品の開発に注力しています。しかし、弾力性のあるインフラの設置に伴う初期コストの高さなどの要因が、市場の成長を妨げる可能性があります。
当研究の主な特徴
当レポートでは、世界のエネルギーレジリエンス市場を詳細に分析し、2023年を基準年とした予測期間 (2024年~2031年) の市場規模 (10億米ドル) とCAGRを掲載しています。
また、さまざまなセグメントにわたる潜在的な収益機会を明らかにし、この市場の魅力的な投資提案マトリクスについて解説しています。
また、市場促進要因、抑制要因、機会、新製品の発売や承認、市場動向、地域別の展望、主要企業が採用する競争戦略などに関する主要考察も提供しています。
世界のエネルギーレジリエンス市場における主要企業を、企業ハイライト、製品ポートフォリオ、主要なハイライト、業績、戦略などのパラメータに基づいてプロファイルしています。
主な企業は、Tesla, Inc.、Siemens AG、Schneider Electric、General Electric、ABB Ltd.、Honeywell International Inc.、LG Chem、Panasonic Corporation、NextEra Energy, Inc.、Eaton Corporation、Enphase Energy、Vestas Wind Systems A/S、First Solar、三菱電機、SunPower Corporationなどです。
このレポートからの洞察により、マーケティング担当者や企業の経営陣は、将来の製品の発売、タイプのアップグレード、市場拡大、マーケティング戦術に関する情報に基づいた意思決定を行うことができます。
世界のエネルギーレジリエンス市場レポートは、投資家、サプライヤー、製品メーカー、流通業者、新規参入者、財務アナリストなど、この業界の様々な利害関係者を対象としています。
目次
第1章 分析目的と前提条件
- 分析目的
- 前提条件
- 略語
第2章 市場の展望
- レポートの説明
- 市場の定義と範囲
- エグゼクティブサマリー
第3章 市場力学・規制・動向の分析
- 市場力学
- 影響分析
- 主なハイライト
- 規制シナリオ
- 製品の発売/承認
- PEST分析
- Porterの分析
- 市場機会
- 規制シナリオ
- 主な発展
- 業界動向
第4章 世界のエネルギーレジリエンス市場:種類別、2019~2031年 (10億米ドル)
- エネルギー貯蔵システム
- マイクログリッド
- 需要応答 (DR) ソリューション
- 再生可能エネルギー技術
- エネルギー管理システム
第5章 世界のエネルギーレジリエンス市場:用途別、2019~2031年 (10億米ドル)
- 家庭用
- 商業用
- 産業用
- ユーティリティ
第6章 世界のエネルギーレジリエンス市場:地域別、2019~2031年 (10億米ドル)
- 北米
- ラテンアメリカ
- 欧州
- アジア太平洋
- 中東
- アフリカ
第7章 競合情勢
- Tesla, Inc.
- Siemens AG
- Schneider Electric
- General Electric
- ABB Ltd.
- Honeywell International Inc.
- LG Chem
- Panasonic Corporation
- NextEra Energy, Inc.
- Eaton Corporation
- Enphase Energy
- Vestas Wind Systems A/S
- First Solar
- Mitsubishi Electric
- SunPower Corporation
第8章 アナリストの提言
- 「運命の輪」
- アナリストの見解
- Coherent Opportunity Map (COM)
第9章 参考文献と調査手法
- 参考文献
- 分析手法
- Coherent Market Insightsについて
Global energy resilience market is estimated to be valued at USD 45.57 Bn in 2024 and is expected to reach USD 85.77 Bn by 2031, exhibiting a compound annual growth rate (CAGR) of 9.5% from 2024 to 2031.
| Report Coverage | Report Details | ||
|---|---|---|---|
| Base Year: | 2023 | Market Size in 2024: | 45.57 Bn |
| Historical Data for: | 2019 to 2023 | Forecast Period: | 2024 to 2031 |
| Forecast Period 2024 to 2031 CAGR: | 9.50% | 2031 Value Projection: | 85.77 Bn |
Global energy resilience market has been witnessing significant growth due to factors such as rising power outages, advancements in backup power solutions, and focus toward ensuring uninterrupted power supply across various sectors. Key end-use industries such as IT & telecom, healthcare, manufacturing continuously require reliable power sources to support mission critical operations. Growing investments toward strengthening critical infrastructure and establishing smart microgrids are further driving the demand for energy resilience solutions.
Market Dynamics
Global energy resilience market growth is driven by factors such as increasing power outages due to aging electricity infrastructure and adverse weather conditions. Moreover, growing investments by governments and enterprises toward establishing smart microgrids for both on-grid and off-grid applications is propelling the demand. However, high initial capital requirements for deployment of backup power solutions can hamper the market growth. Emergence of distributed energy resources and focus on renewable energy integration offer lucrative opportunities. Market players are investing in R&D to develop hybrid power solutions with integrated storage and controls to boost efficiency. Adoption of AI and IoT is also expected grow rapidly. Players in the market are focusing on developing innovative and sustainable products to cater to emerging requirements. However, factors such as high initial costs associated with setting up resilience infrastructure could hamper the market growth.
Key features of the study
This report provides in-depth analysis of the global energy resilience market, and provides market size (USD Bn) and compound annual growth rate (CAGR%) for the forecast period (2024-2031), considering 2023 as the base year
It elucidates potential revenue opportunities across different segments and explains attractive investment proposition matrices for this market
This study also provides key insights about market drivers, restraints, opportunities, new product launches or approval, market trends, regional outlook, and competitive strategies adopted by key players
It profiles key players in the global energy resilience market based on the following parameters - company highlights, products portfolio, key highlights, financial performance, and strategies
Key companies covered as a part of this study include Tesla, Inc., Siemens AG, Schneider Electric, General Electric, ABB Ltd., Honeywell International Inc., LG Chem, Panasonic Corporation, NextEra Energy, Inc., Eaton Corporation, Enphase Energy, Vestas Wind Systems A/S, First Solar, Mitsubishi Electric, and SunPower Corporation
Insights from this report would allow marketers and the management authorities of the companies to make informed decisions regarding their future product launches, type up-gradation, market expansion, and marketing tactics
Global energy resilience market report caters to various stakeholders in this industry including investors, suppliers, product manufacturers, distributors, new entrants, and financial analysts
Market Segmentation
- Type Insights (Revenue, USD Bn, 2019 - 2031)
- Energy Storage Systems
- Microgrids
- Demand Response Solutions
- Renewable Energy Technologies
- Energy Management Systems
- Application Insights (Revenue, USD Bn, 2019 - 2031)
- Residential
- Commercial
- Industrial
- Utilities
- Regional Insights (Revenue, USD Bn, 2019 - 2031)
- North America
- U.S.
- Canada
- Latin America
- Brazil
- Argentina
- Mexico
- Rest of Latin America
- Europe
- Germany
- U.K.
- Spain
- France
- Italy
- Russia
- Rest of Europe
- Asia Pacific
- China
- India
- Japan
- Australia
- South Korea
- ASEAN
- Rest of Asia Pacific
- Middle East
- GCC Countries
- Israel
- Rest of Middle East
- Africa
- South Africa
- North Africa
- Central Africa
- Key Players Insights
- Tesla, Inc.
- Siemens AG
- Schneider Electric
- General Electric
- ABB Ltd.
- Honeywell International Inc.
- LG Chem
- Panasonic Corporation
- NextEra Energy, Inc.
- Eaton Corporation
- Enphase Energy
- Vestas Wind Systems A/S
- First Solar
- Mitsubishi Electric
- SunPower Corporation
Table of Contents
1. Research Objectives and Assumptions
- Research Objectives
- Assumptions
- Abbreviations
2. Market Purview
- Report Description
- Market Definition and Scope
- Executive Summary
- Global Energy Resilience Market, By Type
- Global Energy Resilience Market, By Application
- Global Energy Resilience Market, By Region
3. Market Dynamics, Regulations, and Trends Analysis
- Market Dynamics
- Impact Analysis
- Key Highlights
- Regulatory Scenario
- Product Launches/Approvals
- PEST Analysis
- PORTER's Analysis
- Market Opportunities
- Regulatory Scenario
- Key Developments
- Industry Trend
4. Global Energy Resilience Market, By Type, 2019-2031, (USD Bn)
- Introduction
- Market Share Analysis, 2024 and 2031 (%)
- Y-o-Y Growth Analysis, 2020 - 2031
- Segment Trends
- Energy Storage Systems
- Introduction
- Market Size and Forecast, and Y-o-Y Growth, 2019-2031, (USD Bn)
- Microgrids
- Introduction
- Market Size and Forecast, and Y-o-Y Growth, 2019-2031, (USD Bn)
- Demand Response Solutions
- Introduction
- Market Size and Forecast, and Y-o-Y Growth, 2019-2031, (USD Bn)
- Renewable Energy Technologies
- Introduction
- Market Size and Forecast, and Y-o-Y Growth, 2019-2031, (USD Bn)
- Energy Management Systems
- Introduction
- Market Size and Forecast, and Y-o-Y Growth, 2019-2031, (USD Bn)
5. Global Energy Resilience Market, By Application, 2019-2031, (USD Bn)
- Introduction
- Market Share Analysis, 2024 and 2031 (%)
- Y-o-Y Growth Analysis, 2020 - 2031
- Segment Trends
- Residential
- Introduction
- Market Size and Forecast, and Y-o-Y Growth, 2019-2031, (USD Bn)
- Commercial
- Introduction
- Market Size and Forecast, and Y-o-Y Growth, 2019-2031, (USD Bn)
- Industrial
- Introduction
- Market Size and Forecast, and Y-o-Y Growth, 2019-2031, (USD Bn)
- Utilities
- Introduction
- Market Size and Forecast, and Y-o-Y Growth, 2019-2031, (USD Bn)
6. Global Energy Resilience Market, By Region, 2019 - 2031, (USD Bn)
- Introduction
- Market Share (%) Analysis, 2024,2027 & 2031, (USD Bn)
- Market Y-o-Y Growth Analysis (%), 2020 - 2031, (USD Bn)
- Regional Trends
- North America
- Introduction
- Market Size and Forecast, By Type, 2019 - 2031, (USD Bn)
- Market Size and Forecast, By Application, 2019 - 2031, (USD Bn)
- Market Size and Forecast, By Country, 2019 - 2031, (USD Bn)
- U.S.
- Canada
- Latin America
- Introduction
- Market Size and Forecast, By Type, 2019 - 2031, (USD Bn)
- Market Size and Forecast, By Application, 2019 - 2031, (USD Bn)
- Market Size and Forecast, By Country, 2019 - 2031, (USD Bn)
- Brazil
- Argentina
- Mexico
- Rest of Latin America
- Europe
- Introduction
- Market Size and Forecast, By Type, 2019 - 2031, (USD Bn)
- Market Size and Forecast, By Application, 2019 - 2031, (USD Bn)
- Market Size and Forecast, By Country, 2019 - 2031, (USD Bn)
- Germany
- U.K.
- Spain
- France
- Italy
- Russia
- Rest of Europe
- Asia Pacific
- Introduction
- Market Size and Forecast, By Type, 2019 - 2031, (USD Bn)
- Market Size and Forecast, By Application, 2019 - 2031, (USD Bn)
- Market Size and Forecast, By Country, 2019 - 2031, (USD Bn)
- China
- India
- Japan
- Australia
- South Korea
- ASEAN
- Rest of Asia Pacific
- Middle East
- Introduction
- Market Size and Forecast, By Type, 2019 - 2031, (USD Bn)
- Market Size and Forecast, By Application, 2019 - 2031, (USD Bn)
- Market Size and Forecast, By Country, 2019 - 2031, (USD Bn)
- GCC Countries
- Israel
- Rest of Middle East
- Africa
- Introduction
- Market Size and Forecast, By Type, 2019 - 2031, (USD Bn)
- Market Size and Forecast, By Application, 2019 - 2031, (USD Bn)
- Market Size and Forecast, By Country/Region, 2019 - 2031, (USD Bn)
- South Africa
- North Africa
- Central Africa
7. Competitive Landscape
- Tesla, Inc.
- Company Highlights
- Product Portfolio
- Key Developments
- Financial Performance
- Strategies
- Siemens AG
- Company Highlights
- Product Portfolio
- Key Developments
- Financial Performance
- Strategies
- Schneider Electric
- Company Highlights
- Product Portfolio
- Key Developments
- Financial Performance
- Strategies
- General Electric
- Company Highlights
- Product Portfolio
- Key Developments
- Financial Performance
- Strategies
- ABB Ltd.
- Company Highlights
- Product Portfolio
- Key Developments
- Financial Performance
- Strategies
- Honeywell International Inc.
- Company Highlights
- Product Portfolio
- Key Developments
- Financial Performance
- Strategies
- LG Chem
- Company Highlights
- Product Portfolio
- Key Developments
- Financial Performance
- Strategies
- Panasonic Corporation
- Company Highlights
- Product Portfolio
- Key Developments
- Financial Performance
- Strategies
- NextEra Energy, Inc.
- Company Highlights
- Product Portfolio
- Key Developments
- Financial Performance
- Strategies
- Eaton Corporation
- Company Highlights
- Product Portfolio
- Key Developments
- Financial Performance
- Strategies
- Enphase Energy
- Company Highlights
- Product Portfolio
- Key Developments
- Financial Performance
- Strategies
- Vestas Wind Systems A/S
- Company Highlights
- Product Portfolio
- Key Developments
- Financial Performance
- Strategies
- First Solar
- Company Highlights
- Product Portfolio
- Key Developments
- Financial Performance
- Strategies
- Mitsubishi Electric
- Company Highlights
- Product Portfolio
- Key Developments
- Financial Performance
- Strategies
- SunPower Corporation
- Company Highlights
- Product Portfolio
- Key Developments
- Financial Performance
- Strategies
8. Analyst Recommendations
- Wheel of Fortune
- Analyst View
- Coherent Opportunity Map
9. References and Research Methodology
- References
- Research Methodology
- About us