|
|
市場調査レポート
商品コード
1517367
拡張現実(AR)および仮想現実(VR)ディスプレイの世界市場規模調査:技術、デバイス、ディスプレイ技術、エンドユーザー別、地域別予測、2022年~2032年Global Augmented Reality and Virtual Reality Display Market Size Study by Technology, Device, Display Technology, End-User, and Regional Forecasts 2022-2032 |
||||||
|
|||||||
カスタマイズ可能
|
|||||||

| 拡張現実(AR)および仮想現実(VR)ディスプレイの世界市場規模調査:技術、デバイス、ディスプレイ技術、エンドユーザー別、地域別予測、2022年~2032年 |
|
出版日: 2024年07月15日
発行: Bizwit Research & Consulting LLP
ページ情報: 英文 200 Pages
納期: 2~3営業日
|

全表示
- 概要
- 目次
世界の拡張現実(AR)および仮想現実(VR)ディスプレイ市場は、2023年に約42億米ドルと評価され、予測期間2024年から2032年にかけて17.99%以上の健全な成長率で成長すると予測されています。
ARとVR技術はそれぞれ、現実世界にデジタル情報を重ね合わせたり、完全にシミュレートされた環境を作り出したりすることで、没入型体験を提供します。これらの技術をディスプレイ・システムに統合することで、ゲーム、eコマース、ヘルスケア、教育など、さまざまな分野に革命が起きています。特にCOVID-19の大流行で注目されたリモートワークやバーチャル・コラボレーションのニーズの急増は、高度なAR/VRディスプレイ技術の需要をさらに加速させています。小売業やeコマースの分野では、こうした技術を活用してバーチャル試用室や製品デモを提供し、消費者のショッピング体験を向上させています。AR/VRデバイスに関連する高いコストと複雑な製造プロセスにもかかわらず、市場プレーヤーはコスト効率が高く高品質なディスプレイ技術の開発に努めています。技術の進歩が進むにつれて、ディスプレイの解像度、視野角、ユーザーの快適性の向上が期待され、ヘルスケアにおけるシミュレーションベースのトレーニング、遠隔手術、治療などのより高度なアプリケーションにつながります。
AR技術は、物理的な世界をデジタル的な拡張機能と融合させるもので、ユーザーは周囲の環境を認識しながら拡張された情報と対話することができます。ヘッドアップ・ディスプレイ(HUD)、ハンドヘルド・ディスプレイ、空間ディスプレイなど、さまざまなARディスプレイ・タイプが、そのユニークな機能のためにさまざまな産業で利用されています。逆にVR技術は、ユーザーを完全にデジタル環境に没入させるもので、360度の体験を提供するためにヘッドマウントディスプレイ(HMD)や洞窟型自動仮想環境(CAVE)などのデバイスが必要となります。このような没入型ディスプレイは、研究や商業環境での応用に特に有益です。
ホログラムはデジタル・リアリティの最高峰であり、小売、ヘルスケア、その他の産業に応用されています。ホログラフィック投影用のリアルなAR/VRディスプレイに対する需要の高まりは、大きな商機を約束します。特に自動車や防衛分野でのHUDは、オペレーターが注意をそらすことなく重要なデータにアクセスすることを可能にし、それによって高解像度AR/VRディスプレイの需要を促進しています。AR/VRディスプレイを搭載したプロジェクターは、視聴者中心のダイナミックな体験を提供することで、映画、イベント、教育分野を変革しています。これらのディスプレイは、視覚品質を維持するために環境条件に適応する必要があり、現在進行中の研究開発の重点分野となっています。
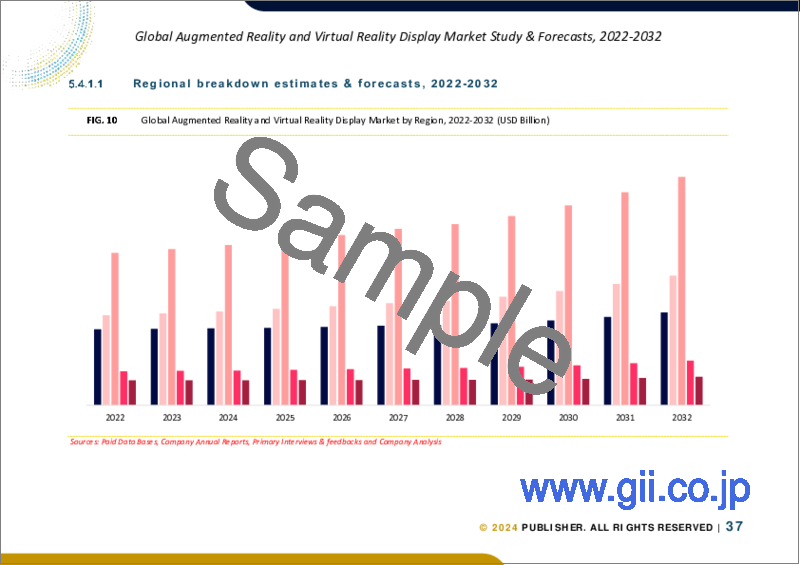
世界の拡張現実(AR)および仮想現実(VR)ディスプレイ市場の調査対象としている主要地域には、アジア太平洋地域、北米、欧州、ラテンアメリカ、その他世界の地域が含まれます。北米は、研究開発に多額の投資を行っているため、拡張現実(AR)および仮想現実(VR)ディスプレイ市場の収益において支配的な地域です。この地域は、ゲーム、ヘルスケア、軍事分野での応用で世界市場の主要シェアを占めています。一方、アジア太平洋地域の市場は、現地のエレクトロニクス企業が大きく貢献し、AR/VR技術への投資が増加していることから、予測期間中に最も速い速度で成長すると予測されています。また、AR/VR市場の需要に対応するため、高解像度ディスプレイに注力している企業もあります。
市場の詳細なセグメントとサブセグメントを以下に説明する:
目次
第1章 拡張現実(AR)および仮想現実(VR)ディスプレイの世界市場エグゼクティブサマリー
- 拡張現実(AR)および仮想現実(VR)ディスプレイの世界市場規模・予測(2022-2032年)
- 地域別概要
- セグメント別概要
- 技術別
- デバイス別
- ディスプレイ技術別
- エンドユーザー別
- アプリケーション別
- 主要動向
- 景気後退の影響
- アナリストの結論・提言
第2章 世界の拡張現実(AR)および仮想現実(VR)ディスプレイ市場の定義と調査前提条件
- 調査目的
- 市場の定義
- 調査前提条件
- 包含と除外
- 制限事項
- 供給サイドの分析
- 入手可能性
- インフラ
- 規制環境
- 市場競争
- 経済性(消費者の視点)
- 需要サイド分析
- 規制の枠組み
- 技術の進歩
- 環境への配慮
- 消費者の意識と受容
- 調査手法
- 調査対象年
- 通貨換算レート
第3章 拡張現実(AR)および仮想現実(VR)ディスプレイの世界市場力学
- 市場促進要因
- エンターテイメントと教育分野での採用の増加
- AR・VRソフトウェア企業の増加
- 市場の課題
- 高いコストとプライバシーへの懸念
- 熟練オペレーターの必要性
- 市場機会
- 待ち時間の短縮とクロスプラットフォーム互換性の革新
- 産業用途の拡大
第4章 世界の拡張現実(AR)および仮想現実(VR)ディスプレイ市場産業分析
- ポーターのファイブフォースモデル
- 供給企業の交渉力
- 買い手の交渉力
- 新規参入業者の脅威
- 代替品の脅威
- 競争企業間の敵対関係
- ポーターのファイブフォースモデルへの未来的アプローチ
- ポーターのファイブフォースの影響分析
- PESTEL分析
- 政治
- 経済
- 社会
- 技術
- 環境
- 法律
- 主な投資機会
- 主要成功戦略
- 破壊的動向
- 業界専門家の視点
- アナリストの結論・提言
第5章 拡張現実(AR)および仮想現実(VR)ディスプレイの世界市場規模と予測:技術別、2022年~2032年
- セグメントダッシュボード
- 拡張現実(AR)および仮想現実(VR)ディスプレイの世界市場:収益動向分析、2022年・2032年
- AR
- VR
第6章 拡張現実(AR)および仮想現実(VR)ディスプレイの世界市場規模と予測:デバイス別、2022年~2032年
- セグメントダッシュボード
- 拡張現実(AR)および仮想現実(VR)ディスプレイの世界市場:収益動向分析、2022年・2032年
- HMD
- ホログラム
- HUD
- プロジェクター
第7章 拡張現実(AR)および仮想現実(VR)ディスプレイの世界市場規模と予測:ディスプレイ技術別、2022年~2032年
- セグメントダッシュボード
- 拡張現実(AR)および仮想現実(VR)ディスプレイの世界市場:収益動向分析、2022年・2032年
- DLP
- LCD
- LCOS
- マイクロLED
- OLED
第8章 拡張現実(AR)および仮想現実(VR)ディスプレイの世界市場規模と予測:エンドユーザー別、2022年~2032年
- セグメントダッシュボード
- 拡張現実(AR)および仮想現実(VR)ディスプレイの世界市場:収益動向分析、2022年・2032年
- 航空宇宙・防衛
- 自動車
- 商業
- 消費者
- 教育
- エネルギー
- 企業
- ヘルスケア
第9章 拡張現実(AR)および仮想現実(VR)ディスプレイの世界市場規模と予測:用途別、2022年~2032年
- セグメントダッシュボード
- 拡張現実(AR)および仮想現実(VR)ディスプレイの世界市場:収益動向分析、2022年・2032年
- 広告・マーケティング
- ゲーム
- メンテナンス
- 製造業
- シミュレーション&トレーニング
- スポーツとエンターテインメント
第10章 拡張現実(AR)および仮想現実(VR)ディスプレイの世界市場規模と予測:地域別、2022年~2032年
- 北米
- 米国
- カナダ
- 欧州
- 英国
- ドイツ
- フランス
- スペイン
- イタリア
- その他欧州
- アジア太平洋
- 中国
- インド
- 日本
- オーストラリア
- 韓国
- その他アジア太平洋
- ラテンアメリカ
- ブラジル
- メキシコ
- その他ラテンアメリカ
- 中東・アフリカ
- サウジアラビア
- 南アフリカ
- その他中東・アフリカ
第11章 競合情報
- 主要企業のSWOT分析
- 主要市場戦略
- 企業プロファイル
- Barco N.V.
- 主要情報
- 概要
- 財務(データの入手可能性によります)
- 製品概要
- 市場戦略
- BOE Technology Group Co., Ltd.
- eMagin Corporation
- Google LLC
- Holoeye Photonics AG
- Innolux Corporation
- Jasper Display Corp.
- Kopin Corporation
- Kura Technologies
- Lenovo Group Limited
- Barco N.V.
第12章 調査プロセス
- 調査プロセス
- データマイニング
- 分析
- 市場推定
- 検証
- 出版
- 調査属性
Global Augmented Reality (AR) and Virtual Reality (VR) Display Market is valued approximately at USD 4.20 billion in 2023 and is anticipated to grow with a healthy growth rate of more than 17.99% over the forecast period 2024-2032. AR and VR technologies provide immersive experiences by overlaying digital information onto the real world or creating completely simulated environments, respectively. The integration of these technologies with display systems has revolutionized multiple sectors, including gaming, e-commerce, healthcare, and education. The surge in remote work and virtual collaboration needs, especially highlighted during the COVID-19 pandemic, has further accelerated the demand for advanced AR/VR display technologies. Retail and e-commerce sectors are leveraging these technologies to offer virtual trial rooms and product demos, thereby enhancing the consumer shopping experience. Despite the high costs and complex manufacturing processes associated with AR/VR devices, market players are striving to develop cost-effective and high-quality display technologies. As technological advancements continue, enhancements in display resolution, field of view, and user comfort are expected, leading to more sophisticated applications such as simulation-based training, remote surgeries, and therapeutic treatments in healthcare.
AR technology merges the physical world with digital enhancements, allowing users to interact with augmented information while remaining aware of their surroundings. Various AR display types, including head-up displays (HUD), handheld displays, and spatial displays, are utilized across different industries for their unique capabilities. Conversely, VR technology immerses users in a fully digital environment, requiring devices such as head-mounted displays (HMDs) and cave automatic virtual environments (CAVE) to deliver 360-degree experiences. These immersive displays are particularly beneficial for applications in research and commercial settings.
Holograms represent the pinnacle of digital reality, with applications spanning retail, healthcare, and other industries. The increasing demand for realistic AR/VR displays for holographic projections promises substantial commercial opportunities. HUDs, especially in automotive and defense sectors, enable operators to access critical data without diverting their attention, thereby driving the demand for high-resolution AR/VR displays. Projectors equipped with AR/VR displays are transforming the film, events, and education sectors by offering dynamic, viewer-centric experiences. These displays must adapt to environmental conditions to maintain visual quality, which is a focus area for ongoing research and development.
The key regions considered for the global Augmented Reality (AR) and Virtual Reality (VR) Display Market study include Asia Pacific, North America, Europe, Latin America, and Rest of the World. North America is a dominating region in the Augmented Reality (AR) and Virtual Reality (VR) Display Market in terms of revenue due to significant investments in research and development. The region holds a major share of the global market, with applications in gaming, healthcare, and military sectors. Whereas, the market in Asia Pacific is anticipated to grow at the fastest rate over the forecast period owing to the driven by substantial contributions from local electronic companies and increasingly investing in AR/VR technologies. Also, several companies focusing on high-resolution displays to meet the demands of the AR/VR market.
Major market players included in this report are:
- Barco N.V.
- BOE Technology Group Co., Ltd.
- eMagin Corporation
- Google LLC
- Holoeye Photonics AG
- Innolux Corporation
- Jasper Display Corp.
- Kopin Corporation
- Kura Technologies
- Lenovo Group Limited
The detailed segments and sub-segments of the market are explained below:
By Technology:
- AR
- VR
By Device:
- HMD
- Hologram
- HUD
- Projectors
By Display Technology:
- DLP
- LCD
- LCOS
- Micro-LED
- OLED
By End-User:
- Aerospace & Defense
- Automotive
- Commercial
- Consumer
- Education
- Energy
- Enterprise
- Healthcare
- Application
- Advertising & Marketing
- Gaming
- Maintenance
- Manufacturing
- Simulation & Training
- Sports & Entertainment
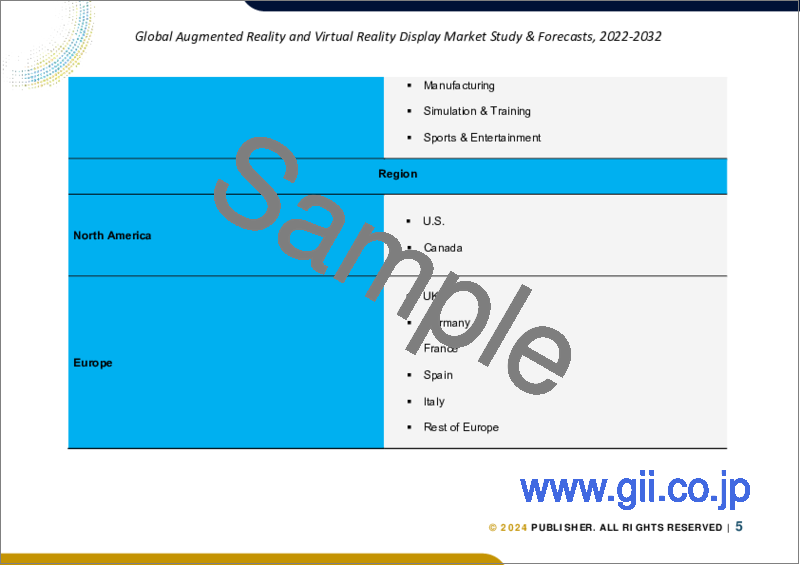
By Region:
- North America
- U.S.
- Canada
- Europe
- UK
- Germany
- France
- Spain
- Italy
- ROE
- Asia Pacific
- China
- India
- Japan
- Australia
- South Korea
- RoAPAC
- Latin America
- Brazil
- Mexico
- RoLA
- Middle East & Africa
- Saudi Arabia
- South Africa
- RoMEA
Years considered for the study are as follows:
- Historical year - 2022
- Base year - 2023
- Forecast period - 2024 to 2032
Key Takeaways:
- Market Estimates & Forecast for 10 years from 2022 to 2032.
- Annualized revenues and regional level analysis for each market segment.
- Detailed analysis of geographical landscape with Country level analysis of major regions.
- Competitive landscape with information on major players in the market.
- Analysis of key business strategies and recommendations on future market approach.
- Analysis of competitive structure of the market.
- Demand side and supply side analysis of the market.
Table of Contents
Chapter 1. Global Augmented Reality (AR) and Virtual Reality (VR) Display Market Executive Summary
- 1.1. Global Augmented Reality (AR) and Virtual Reality (VR) Display Market Size & Forecast (2022-2032)
- 1.2. Regional Summary
- 1.3. Segmental Summary
- 1.3.1. By Technology
- 1.3.2. By Device
- 1.3.3. By Display Technology
- 1.3.4. By End-User
- 1.3.5. By Application
- 1.4. Key Trends
- 1.5. Recession Impact
- 1.6. Analyst Recommendation & Conclusion
Chapter 2. Global Augmented Reality (AR) and Virtual Reality (VR) Display Market Definition and Research Assumptions
- 2.1. Research Objective
- 2.2. Market Definition
- 2.3. Research Assumptions
- 2.3.1. Inclusion & Exclusion
- 2.3.2. Limitations
- 2.3.3. Supply Side Analysis
- 2.3.3.1. Availability
- 2.3.3.2. Infrastructure
- 2.3.3.3. Regulatory Environment
- 2.3.3.4. Market Competition
- 2.3.3.5. Economic Viability (Consumer's Perspective)
- 2.3.4. Demand Side Analysis
- 2.3.4.1. Regulatory frameworks
- 2.3.4.2. Technological Advancements
- 2.3.4.3. Environmental Considerations
- 2.3.4.4. Consumer Awareness & Acceptance
- 2.4. Estimation Methodology
- 2.5. Years Considered for the Study
- 2.6. Currency Conversion Rates
Chapter 3. Global Augmented Reality (AR) and Virtual Reality (VR) Display Market Dynamics
- 3.1. Market Drivers
- 3.1.1. Increased adoption in entertainment and education sectors
- 3.1.2. Growing number of AR & VR software companies
- 3.2. Market Challenges
- 3.2.1. High costs and privacy concerns
- 3.2.2. Need for skilled operators
- 3.3. Market Opportunities
- 3.3.1. Innovations in latency reduction and cross-platform compatibility
- 3.3.2. Expanding industrial applications
Chapter 4. Global Augmented Reality (AR) and Virtual Reality (VR) Display Market Industry Analysis
- 4.1. Porter's 5 Force Model
- 4.1.1. Bargaining Power of Suppliers
- 4.1.2. Bargaining Power of Buyers
- 4.1.3. Threat of New Entrants
- 4.1.4. Threat of Substitutes
- 4.1.5. Competitive Rivalry
- 4.1.6. Futuristic Approach to Porter's 5 Force Model
- 4.1.7. Porter's 5 Force Impact Analysis
- 4.2. PESTEL Analysis
- 4.2.1. Political
- 4.2.2. Economical
- 4.2.3. Social
- 4.2.4. Technological
- 4.2.5. Environmental
- 4.2.6. Legal
- 4.3. Top investment opportunity
- 4.4. Top winning strategies
- 4.5. Disruptive Trends
- 4.6. Industry Expert Perspective
- 4.7. Analyst Recommendation & Conclusion
Chapter 5. Global Augmented Reality (AR) and Virtual Reality (VR) Display Market Size & Forecasts by Technology 2022-2032
- 5.1. Segment Dashboard
- 5.2. Global Augmented Reality (AR) and Virtual Reality (VR) Display Market: Technology Revenue Trend Analysis, 2022 & 2032 (USD Billion)
- 5.2.1. AR
- 5.2.2. VR
Chapter 6. Global Augmented Reality (AR) and Virtual Reality (VR) Display Market Size & Forecasts by Device 2022-2032
- 6.1. Segment Dashboard
- 6.2. Global Augmented Reality (AR) and Virtual Reality (VR) Display Market: Device Revenue Trend Analysis, 2022 & 2032 (USD Billion)
- 6.2.1. HMD
- 6.2.2. Hologram
- 6.2.3. HUD
- 6.2.4. Projectors
Chapter 7. Global Augmented Reality (AR) and Virtual Reality (VR) Display Market Size & Forecasts by Display Technology 2022-2032
- 7.1. Segment Dashboard
- 7.2. Global Augmented Reality (AR) and Virtual Reality (VR) Display Market: Display Technology Revenue Trend Analysis, 2022 & 2032 (USD Billion)
- 7.2.1. DLP
- 7.2.2. LCD
- 7.2.3. LCOS
- 7.2.4. Micro-LED
- 7.2.5. OLED
Chapter 8. Global Augmented Reality (AR) and Virtual Reality (VR) Display Market Size & Forecasts by End-User 2022-2032
- 8.1. Segment Dashboard
- 8.2. Global Augmented Reality (AR) and Virtual Reality (VR) Display Market: End-User Revenue Trend Analysis, 2022 & 2032 (USD Billion)
- 8.2.1. Aerospace & Defense
- 8.2.2. Automotive
- 8.2.3. Commercial
- 8.2.4. Consumer
- 8.2.5. Education
- 8.2.6. Energy
- 8.2.7. Enterprise
- 8.2.8. Healthcare
Chapter 9. Global Augmented Reality (AR) and Virtual Reality (VR) Display Market Size & Forecasts by Application 2022-2032
- 9.1. Segment Dashboard
- 9.2. Global Augmented Reality (AR) and Virtual Reality (VR) Display Market: Application Revenue Trend Analysis, 2022 & 2032 (USD Billion)
- 9.2.1. Advertising & Marketing
- 9.2.2. Gaming
- 9.2.3. Maintenance
- 9.2.4. Manufacturing
- 9.2.5. Simulation & Training
- 9.2.6. Sports & Entertainment
Chapter 10. Global Augmented Reality (AR) and Virtual Reality (VR) Display Market Size & Forecasts by Region 2022-2032
- 10.1. North America Augmented Reality (AR) and Virtual Reality (VR) Display Market
- 10.1.1. U.S. Augmented Reality (AR) and Virtual Reality (VR) Display Market
- 10.1.1.1. Technology breakdown size & forecasts, 2022-2032
- 10.1.1.2. Device breakdown size & forecasts, 2022-2032
- 10.1.1.3. Display Technology breakdown size & forecasts, 2022-2032
- 10.1.1.4. End-User breakdown size & forecasts, 2022-2032
- 10.1.1.5. Application breakdown size & forecasts, 2022-2032
- 10.1.2. Canada Augmented Reality (AR) and Virtual Reality (VR) Display Market
- 10.1.1. U.S. Augmented Reality (AR) and Virtual Reality (VR) Display Market
- 10.2. Europe Augmented Reality (AR) and Virtual Reality (VR) Display Market
- 10.2.1. U.K. Augmented Reality (AR) and Virtual Reality (VR) Display Market
- 10.2.2. Germany Augmented Reality (AR) and Virtual Reality (VR) Display Market
- 10.2.3. France Augmented Reality (AR) and Virtual Reality (VR) Display Market
- 10.2.4. Spain Augmented Reality (AR) and Virtual Reality (VR) Display Market
- 10.2.5. Italy Augmented Reality (AR) and Virtual Reality (VR) Display Market
- 10.2.6. Rest of Europe Augmented Reality (AR) and Virtual Reality (VR) Display Market
- 10.3. Asia-Pacific Augmented Reality (AR) and Virtual Reality (VR) Display Market
- 10.3.1. China Augmented Reality (AR) and Virtual Reality (VR) Display Market
- 10.3.2. India Augmented Reality (AR) and Virtual Reality (VR) Display Market
- 10.3.3. Japan Augmented Reality (AR) and Virtual Reality (VR) Display Market
- 10.3.4. Australia Augmented Reality (AR) and Virtual Reality (VR) Display Market
- 10.3.5. South Korea Augmented Reality (AR) and Virtual Reality (VR) Display Market
- 10.3.6. Rest of Asia Pacific Augmented Reality (AR) and Virtual Reality (VR) Display Market
- 10.4. Latin America Augmented Reality (AR) and Virtual Reality (VR) Display Market
- 10.4.1. Brazil Augmented Reality (AR) and Virtual Reality (VR) Display Market
- 10.4.2. Mexico Augmented Reality (AR) and Virtual Reality (VR) Display Market
- 10.4.3. Rest of Latin America Augmented Reality (AR) and Virtual Reality (VR) Display Market
- 10.5. Middle East & Africa Augmented Reality (AR) and Virtual Reality (VR) Display Market
- 10.5.1. Saudi Arabia Augmented Reality (AR) and Virtual Reality (VR) Display Market
- 10.5.2. South Africa Augmented Reality (AR) and Virtual Reality (VR) Display Market
- 10.5.3. Rest of Middle East & Africa Augmented Reality (AR) and Virtual Reality (VR) Display Market
Chapter 11. Competitive Intelligence
- 11.1. Key Company SWOT Analysis
- 11.2. Top Market Strategies
- 11.3. Company Profiles
- 11.3.1. Barco N.V.
- 11.3.1.1. Key Information
- 11.3.1.2. Overview
- 11.3.1.3. Financial (Subject to Data Availability)
- 11.3.1.4. Product Summary
- 11.3.1.5. Market Strategies
- 11.3.2. BOE Technology Group Co., Ltd.
- 11.3.3. eMagin Corporation
- 11.3.4. Google LLC
- 11.3.5. Holoeye Photonics AG
- 11.3.6. Innolux Corporation
- 11.3.7. Jasper Display Corp.
- 11.3.8. Kopin Corporation
- 11.3.9. Kura Technologies
- 11.3.10. Lenovo Group Limited
- 11.3.1. Barco N.V.
Chapter 12. Research Process
- 12.1. Research Process
- 12.1.1. Data Mining
- 12.1.2. Analysis
- 12.1.3. Market Estimation
- 12.1.4. Validation
- 12.1.5. Publishing
- 12.2. Research Attributes
