|
|
市場調査レポート
商品コード
1749760
艦艇シミュレーションの世界市場:シミュレータタイプ・技術・用途・エンドユーザー・地域別の分析・予測 (2025-2034年)Naval Vessels Simulation Market - A Global and Regional Analysis: Focus on Simulators Type, Technology, Application, End User, and Region - Analysis and Forecast, 2025-2034 |
||||||
|
|||||||
カスタマイズ可能
|
|||||||

| 艦艇シミュレーションの世界市場:シミュレータタイプ・技術・用途・エンドユーザー・地域別の分析・予測 (2025-2034年) |
|
出版日: 2025年06月18日
発行: BIS Research
ページ情報: 英文 140 Pages
納期: 1~5営業日
|

全表示
- 概要
- 図表
- 目次
艦艇シミュレーションの市場は、高度なデジタル訓練を可能にすることで、艦隊の即応性を高め、作戦リスクを低減する上で重要な役割を果たしています。
各国の海軍は、現実の海上環境を忠実に再現した高解像度のシミュレーションを導入しており、戦術的意思決定、工学的診断、ブリッジ操作、水中戦などを幅広くカバーしています。
デジタルツイン、クラウドベースのモデリングプラットフォーム、予測分析といった革新的技術により、従来の静的な演習としてのシミュレーションは、リアルタイムで適応可能な意思決定支援ツールへと進化しています。これにより、任務リハーサルの効率が向上し、多領域での作戦連携が円滑化され、乗員の訓練サイクルも加速されます。また、航海、被害制御、潜水艦運用に特化した訓練モジュールにおいて、バーチャルリアリティ(VR)や拡張現実(AR)への投資が増加しており、軍艦艇シミュレーション市場はさらなる発展を遂げつつあります。
| 主要市場統計 | |
|---|---|
| 予測期間 | 2025-2034年 |
| 2025年評価 | 13億5,000万米ドル |
| 2034年予測 | 37億5,000万米ドル |
| CAGR | 12.02% |
世界の艦艇シミュレーション市場のライフサイクルステージ
艦艇シミュレーション市場は現在、力強い成長段階にあります。これは、海上安全保障ニーズの高まり、各国の海軍予算の増加、統合型訓練エコシステムへの世界的な移行により推進されています。現在導入されているシステムの多くは、特に北米、欧州、アジア太平洋地域の海軍で使用されているものを中心に、高度な技術成熟度(TRL8~9)に到達しています。
米国、英国、インド、日本などの政府が主導する近代化プログラムでは、デジタル海軍訓練能力の強化が重視されており、これにより実戦的・仮想的・建設的(LVC)訓練に対応するカスタマイズ可能な多人数対応シミュレーターの需要が拡大しています。さらに、シミュレーションベンダーと造船企業の戦略的提携が進むことで、製品の適応性が高まり、ライフサイクルコストの削減にも寄与しています。
今後は、AIや自律型艦艇技術が海軍の運用に組み込まれていくにつれ、艦艇シミュレーションは作戦計画や乗員訓練においてますます重要な役割を果たすことが期待されています。
艦艇シミュレーション市場の分類
セグメンテーション1:シミュレータタイプ別
- 航海シミュレータ
- エンジニアリングシミュレータ
- 戦闘シミュレータ
- 無人艦艇シミュレータ
- その他
セグメンテーション2:技術別
- 仮想現実(VR)シミュレータ
- 拡張現実(AR)シミュレータ
- 複合現実シミュレータ
- デスクトップ/PCベースシミュレータ
セグメンテーション3:用途別
- 訓練・技能開発
- 研究開発
- テスト・検証
セグメンテーション4:エンドユーザー別
- 海軍・国防機関
- 海事アカデミー・訓練機関
- 民間企業・商業事業者
セグメンテーション5:地域別
- 北米:米国、カナダ、メキシコ
- 欧州:ドイツ、フランス、イタリア、スペイン、英国、その他
- アジア太平洋:中国、日本、韓国、インド、その他
- その他の地域:南米、中東・アフリカ
当レポートでは、世界の艦艇シミュレーションの市場を調査し、主要動向、市場影響因子の分析、法規制環境、技術・特許の分析、市場規模の推移・予測、各種区分・地域/主要国別の詳細分析、競合情勢、主要企業のプロファイルなどをまとめています。
目次
エグゼクティブサマリー
第1章 市場:業界展望
- 動向:現状と将来への影響評価
- 市場力学の概要
- 市場促進要因
- 市場抑制要因
- 市場機会
- 規制および政策の影響分析
- 地域別
- 特許分析
- 年別
- 地域別
- 技術の動向とイノベーション
- スタートアップの情勢
- 投資情勢と研究開発動向
- バリューチェーン分析
- 業界の魅力
第2章 世界の艦艇シミュレーション市場:シミュレータタイプ別
- ナビゲーションシミュレータ
- エンジニアリングシミュレータ
- 戦闘シミュレータ
- 無人艦艇シミュレータ
- その他
第3章 世界の艦艇シミュレーション市場:技術別
- バーチャルリアリティ(VR)シミュレータ
- 拡張現実(AR)シミュレータ
- 複合現実シミュレータ
- デスクトップ/PCベースのシミュレータ
第4章 世界の艦艇シミュレーション市場:用途別
- 訓練・技能開発
- 研究開発
- テスト・検証
第5章 世界の艦艇シミュレーション市場:エンドユーザー別
- 海軍・国防機関
- 海事アカデミー・訓練機関
- 民間企業・商業事業者
第6章 世界の艦艇シミュレーション市場:地域別
- 世界の艦艇シミュレーション市場:地域別
- 北米
- 地域概要
- 市場成長の原動力
- 市場課題
- 主要企業
- シミュレータタイプ別
- 技術別
- 用途別
- エンドユーザー別
- 北米(国別)
- 欧州
- 地域概要
- 市場成長の原動力
- 市場課題
- 主要企業
- シミュレータタイプ別
- 技術別
- 用途別
- エンドユーザー別
- 欧州(国別)
- アジア太平洋
- 地域概要
- 市場成長の原動力
- 市場課題
- 主要企業
- シミュレータタイプ別
- 技術別
- 用途別
- エンドユーザー別
- アジア太平洋(国別)
- その他の地域
- 地域概要
- 市場成長の原動力
- 市場課題
- 主要企業
- シミュレータタイプ別
- 技術別
- 用途別
- エンドユーザー別
- その他の地域(地域別)
第7章 市場:競合ベンチマーキングと企業プロファイル
- 次のフロンティア
- 地理的評価
- 企業プロファイル
- CAE Inc.
- L3Harris Technologies, Inc.
- ARI Simulation
- Kongsberg Maritime
- Rheinmetall AG
- Thales
- Dynautics Limited
- Wartsila
- Cubic Corporation
- Rheinmetall AG
- その他の主要企業
第8章 調査手法
List of Figures
- Figure 1: Naval Vessels Simulation Market (by Scenario), $Billion, 2025, 2028, and 2034
- Figure 2: Naval Vessels Simulation Market (by Region), $Billion, 2024, 2027, and 2034
- Figure 3: Naval Vessels Simulation Market (by Simulators Type), $Billion, 2024, 2027, and 2034
- Figure 4: Naval Vessels Simulation Market (by Technology), $Billion, 2024, 2027, and 2034
- Figure 5: Naval Vessels Simulation Market (by Application), $Billion, 2024, 2027, and 2034
- Figure 6: Naval Vessels Simulation Market (by End User), $Billion, 2024, 2027, and 2034
- Figure 7: Competitive Landscape Snapshot
- Figure 8: Supply Chain Analysis
- Figure 9: Value Chain Analysis
- Figure 10: Patent Analysis (by Country), January 2021-April 2025
- Figure 11: Patent Analysis (by Company), January 2021-April 2025
- Figure 12: Impact Analysis of Market Navigating Factors, 2024-2034
- Figure 13: U.S. Naval Vessels Simulation Market, $Billion, 2024-2034
- Figure 14: Canada Naval Vessels Simulation Market, $Billion, 2024-2034
- Figure 15: Mexico Naval Vessels Simulation Market, $Billion, 2024-2034
- Figure 16: Germany Naval Vessels Simulation Market, $Billion, 2024-2034
- Figure 17: France Naval Vessels Simulation Market, $Billion, 2024-2034
- Figure 18: Italy Naval Vessels Simulation Market, $Billion, 2024-2034
- Figure 19: Spain Naval Vessels Simulation Market, $Billion, 2024-2034
- Figure 20: U.K. Naval Vessels Simulation Market, $Billion, 2024-2034
- Figure 21: Rest-of-Europe Naval Vessels Simulation Market, $Billion, 2024-2034
- Figure 22: China Naval Vessels Simulation Market, $Billion, 2024-2034
- Figure 23: Japan Naval Vessels Simulation Market, $Billion, 2024-2034
- Figure 24: India Naval Vessels Simulation Market, $Billion, 2024-2034
- Figure 25: South Korea Naval Vessels Simulation Market, $Billion, 2024-2034
- Figure 26: Rest-of-Asia-Pacific Naval Vessels Simulation Market, $Billion, 2024-2034
- Figure 27: South America Naval Vessels Simulation Market, $Billion, 2024-2034
- Figure 28: Middle East and Africa Naval Vessels Simulation Market, $Billion, 2024-2034
- Figure 29: Strategic Initiatives (by Company), 2021-2025
- Figure 30: Share of Strategic Initiatives, 2021-2025
- Figure 31: Data Triangulation
- Figure 32: Top-Down and Bottom-Up Approach
- Figure 33: Assumptions and Limitations
List of Tables
- Table 1: Market Snapshot
- Table 2: Opportunities across Region
- Table 3: Trends Overview
- Table 4: Naval Vessels Simulation Market (by Region), $Billion, 2024-2034
- Table 5: North America Naval Vessels Simulation Market (by Simulators Type), $Billion, 2024-2034
- Table 6: North America Naval Vessels Simulation Market (by Technology), $Billion, 2024-2034
- Table 7: North America Naval Vessels Simulation Market (by Application), $Billion, 2024-2034
- Table 8: North America Naval Vessels Simulation Market (by End User), $Billion, 2024-2034
- Table 9: U.S. Naval Vessels Simulation Market (by Simulators Type), $Billion, 2024-2034
- Table 10: U.S. Naval Vessels Simulation Market (by Technology), $Billion, 2024-2034
- Table 11: U.S. Naval Vessels Simulation Market (by Application), $Billion, 2024-2034
- Table 12: U.S. Naval Vessels Simulation Market (by End User), $Billion, 2024-2034
- Table 13: Canada Naval Vessels Simulation Market (by Simulators Type), $Billion, 2024-2034
- Table 14: Canada Naval Vessels Simulation Market (by Technology), $Billion, 2024-2034
- Table 15: Canada Naval Vessels Simulation Market (by Application), $Billion, 2024-2034
- Table 16: Canada Naval Vessels Simulation Market (by End User), $Billion, 2024-2034
- Table 17: Mexico Naval Vessels Simulation Market (by Simulators Type), $Billion, 2024-2034
- Table 18: Mexico Naval Vessels Simulation Market (by Technology), $Billion, 2024-2034
- Table 19: Mexico Naval Vessels Simulation Market (by Application), $Billion, 2024-2034
- Table 20: Mexico Naval Vessels Simulation Market (by End User), $Billion, 2024-2034
- Table 21: Europe Naval Vessels Simulation Market (by Simulators Type), $Billion, 2024-2034
- Table 22: Europe Naval Vessels Simulation Market (by Technology), $Billion, 2024-2034
- Table 23: Europe Naval Vessels Simulation Market (by Application), $Billion, 2024-2034
- Table 24: Europe Naval Vessels Simulation Market (by End User), $Billion, 2024-2034
- Table 25: Germany Naval Vessels Simulation Market (by Simulators Type), $Billion, 2024-2034
- Table 26: Germany Naval Vessels Simulation Market (by Technology), $Billion, 2024-2034
- Table 27: Germany Naval Vessels Simulation Market (by Application), $Billion, 2024-2034
- Table 28: Germany Naval Vessels Simulation Market (by End User), $Billion, 2024-2034
- Table 29: France Naval Vessels Simulation Market (by Simulators Type), $Billion, 2024-2034
- Table 30: France Naval Vessels Simulation Market (by Technology), $Billion, 2024-2034
- Table 31: France Naval Vessels Simulation Market (by Application), $Billion, 2024-2034
- Table 32: France Naval Vessels Simulation Market (by End User), $Billion, 2024-2034
- Table 33: Italy Naval Vessels Simulation Market (by Simulators Type), $Billion, 2024-2034
- Table 34: Italy Naval Vessels Simulation Market (by Technology), $Billion, 2024-2034
- Table 35: Italy Naval Vessels Simulation Market (by Application), $Billion, 2024-2034
- Table 36: Italy Naval Vessels Simulation Market (by End User), $Billion, 2024-2034
- Table 37: Spain Naval Vessels Simulation Market (by Simulators Type), $Billion, 2024-2034
- Table 38: Spain Naval Vessels Simulation Market (by Technology), $Billion, 2024-2034
- Table 39: Spain Naval Vessels Simulation Market (by Application), $Billion, 2024-2034
- Table 40: Spain Naval Vessels Simulation Market (by End User), $Billion, 2024-2034
- Table 41: U.K. Naval Vessels Simulation Market (by Simulators Type), $Billion, 2024-2034
- Table 42: U.K. Naval Vessels Simulation Market (by Technology), $Billion, 2024-2034
- Table 43: U.K. Naval Vessels Simulation Market (by Application), $Billion, 2024-2034
- Table 44: U.K. Naval Vessels Simulation Market (by End User), $Billion, 2024-2034
- Table 45: Rest-of-Europe Naval Vessels Simulation Market (by Simulators Type), $Billion, 2024-2034
- Table 46: Rest-of-Europe Naval Vessels Simulation Market (by Technology), $Billion, 2024-2034
- Table 47: Rest-of-Europe Naval Vessels Simulation Market (by Application), $Billion, 2024-2034
- Table 48: Rest-of-Europe Naval Vessels Simulation Market (by End User), $Billion, 2024-2034
- Table 49: China Naval Vessels Simulation Market (by Simulators Type), $Billion, 2024-2034
- Table 50: China Naval Vessels Simulation Market (by Technology), $Billion, 2024-2034
- Table 51: China Naval Vessels Simulation Market (by Application), $Billion, 2024-2034
- Table 52: China Naval Vessels Simulation Market (by End User), $Billion, 2024-2034
- Table 53: Japan Naval Vessels Simulation Market (by Simulators Type), $Billion, 2024-2034
- Table 54: Japan Naval Vessels Simulation Market (by Technology), $Billion, 2024-2034
- Table 55: Japan Naval Vessels Simulation Market (by Application), $Billion, 2024-2034
- Table 56: Japan Naval Vessels Simulation Market (by End User), $Billion, 2024-2034
- Table 57: India Naval Vessels Simulation Market (by Simulators Type), $Billion, 2024-2034
- Table 58: India Naval Vessels Simulation Market (by Technology), $Billion, 2024-2034
- Table 59: India Naval Vessels Simulation Market (by Application), $Billion, 2024-2034
- Table 60: India Naval Vessels Simulation Market (by End User), $Billion, 2024-2034
- Table 61: South Korea Naval Vessels Simulation Market (by Simulators Type), $Billion, 2024-2034
- Table 62: South Korea Naval Vessels Simulation Market (by Technology), $Billion, 2024-2034
- Table 63: South Korea Naval Vessels Simulation Market (by Application), $Billion, 2024-2034
- Table 64: South Korea Naval Vessels Simulation Market (by End User), $Billion, 2024-2034
- Table 65: Rest-of-Asia-Pacific Naval Vessels Simulation Market (by Simulators Type), $Billion, 2024-2034
- Table 66: Rest-of-Asia-Pacific Naval Vessels Simulation Market (by Technology), $Billion, 2024-2034
- Table 67: Rest-of-Asia-Pacific Naval Vessels Simulation Market (by Application), $Billion, 2024-2034
- Table 68: Rest-of-Asia-Pacific Naval Vessels Simulation Market (by End User), $Billion, 2024-2034
- Table 69: Rest-of-the-World Naval Vessels Simulation Market (by Simulators Type), $Billion, 2024-2034
- Table 70: Rest-of-the-World Naval Vessels Simulation Market (by Technology), $Billion, 2024-2034
- Table 71: Rest-of-the-World Naval Vessels Simulation Market (by Application), $Billion, 2024-2034
- Table 72: Rest-of-the-World Naval Vessels Simulation Market (by End User), $Billion, 2024-2034
- Table 73: South America Naval Vessels Simulation Market (by Simulators Type), $Billion, 2024-2034
- Table 74: South America Naval Vessels Simulation Market (by Technology), $Billion, 2024-2034
- Table 75: South America Naval Vessels Simulation Market (by Application), $Billion, 2024-2034
- Table 76: South America Naval Vessels Simulation Market (by End User), $Billion, 2024-2034
- Table 77: Middle East and Africa Naval Vessels Simulation Market (by Simulators Type), $Billion, 2024-2034
- Table 78: Middle East and Africa Naval Vessels Simulation Market (by Technology), $Billion, 2024-2034
- Table 79: Middle East and Africa Naval Vessels Simulation Market (by Application), $Billion, 2024-2034
- Table 80: Middle East and Africa Naval Vessels Simulation Market (by End User), $Billion, 2024-2034
- Table 81: Market Share
Naval Vessels Simulation Market Industry and Technology Overview
The naval vessels simulation market plays a critical role in enhancing fleet readiness and reducing operational risks by enabling advanced digital training. Naval forces across regions are integrating high-resolution simulations that mirror real-world maritime environments, covering tactical decision-making, engineering diagnostics, bridge operations, and undersea warfare.
Innovations such as digital twins, cloud-based modeling platforms, and predictive analytics are transforming simulation from static exercises into adaptive, real-time decision support tools. These technologies improve mission rehearsal efficiency, facilitate multi-domain operational coordination, and accelerate crew training cycles. The naval vessels simulation market is also seeing a rise in investments in virtual reality (VR) and augmented reality (AR), particularly in training modules for navigation, damage control, and submarine operations.
| KEY MARKET STATISTICS | |
|---|---|
| Forecast Period | 2025 - 2034 |
| 2025 Evaluation | $1.35 Billion |
| 2034 Forecast | $3.75 Billion |
| CAGR | 12.02% |
Global Naval Vessels Simulation Market Lifecycle Stage
The naval vessels simulation market is in a robust growth phase, fueled by heightened maritime security requirements, increased naval budgets, and a global push toward integrated training ecosystems. Most of the current systems have reached advanced Technology Readiness Levels (TRL 8-9), especially those used by navies in North America, Europe, and Asia-Pacific.
Modernization programs led by governments in the U.S., U.K., India, and Japan are emphasizing digital naval training capabilities. These initiatives are driving demand for customizable, multi-user simulators that support live, virtual, and constructive (LVC) training frameworks in the naval vessels simulation market. Strategic alignments between simulation vendors and shipbuilders are further enhancing product adaptability and reducing lifecycle costs.
As AI and autonomous vessel technologies become embedded in naval operations, simulation systems are expected to play an even larger role in operational planning and crew preparation in the naval vessels simulation market.
Naval Vessels Simulation Market Segmentation:
Segmentation 1: by Simulators Type
- Navigation Simulators
- Engineering Simulators
- Combat Simulators
- Unmanned Naval Vessel Simulators
- Others
Segmentation 2: by Technology
- Virtual Reality (VR) Simulators
- Augmented Reality (AR) Simulators
- Mixed Reality Simulators
- Desktop/PC-Based Simulators
Segmentation 3: by Application
- Training and Skill Development
- Research and Development
- Testing and Validation
Segmentation 4: by End User
- Navies & Defense Force
- Maritime Academies and Training Institutes
- Private Sector and Commercial Operators
Segmentation 5: by Region
- North America - U.S., Canada, and Mexico
- Europe - Germany, France, Italy, Spain, U.K., and Rest-of-Europe
- Asia-Pacific China, Japan, South Korea, India, and Rest-of-Asia-Pacific
- Rest-of-the-World - South America and Middle East and Africa
Demand - Drivers and Limitations
The following are the demand drivers for the naval vessels simulation market:
- Growth in maritime defense expenditures and personnel readiness programs
- Rising demand for high-fidelity, scenario-based naval training
- Technological convergence of AI, cloud computing, and virtual reality
The naval vessels simulation market is expected to face some limitations as well due to the following challenges:
- High cost of integration with legacy naval systems
- Complexity in ensuring simulation interoperability across allied fleets
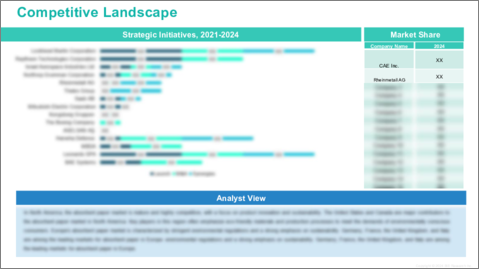
Naval Vessels Simulation Market Key Players and Competition Synopsis
The Naval Vessels Simulation Market is characterized by strategic innovation and strong competition among established defense technology providers and specialized training solution developers. Key players such as CAE Inc., L3Harris Technologies, Inc., and Rheinmetall AG are actively shaping the future of naval training through simulation-driven modernization. These companies focus on enhancing shipboard readiness, reducing live training dependency, and delivering mission-specific scenarios using high-fidelity digital environments.
The competitive environment of the naval vessels simulation market is also influenced by emerging players offering flexible, interoperable platforms tailored for both manned and unmanned naval systems. Real-time simulation software, AI-powered scenario generation, and mixed-reality interfaces are central to current development efforts. The naval vessels simulation market continues to expand due to partnerships between simulation firms, shipbuilders, and naval research institutions, aiming to advance platform interoperability and operator skill acquisition.
Some prominent names established in the naval vessels simulation market are:
- CAE Inc.
- L3Harris Technologies, Inc.
- ARI Simulation
- Kongsberg Maritime
- Rheinmetall AG
- Thales
- Dynautics Limited
- Wartsila
- Cubic Corporation
- Rheinmetall AG
Companies that are not a part of the previously mentioned pool have been well represented across different sections of the naval vessels simulation market report (wherever applicable).
Table of Contents
Executive Summary
Scope and Definition
Market/Product Definition
Key Questions Answered
Analysis and Forecast Note
1. Markets: Industry Outlook
- 1.1 Trends: Current and Future Impact Assessment
- 1.2 Market Dynamics Overview
- 1.2.1 Market Drivers
- 1.2.2 Market Restraints
- 1.2.3 Market Opportunities
- 1.3 Regulatory & Policy Impact Analysis
- 1.3.1 By Region
- 1.4 Patent Analysis
- 1.4.1 By Year
- 1.4.2 By Region
- 1.5 Technology Trends and Innovations
- 1.6 Start-Up Landscape
- 1.7 Investment Landscape and R&D Trends
- 1.8 Value Chain Analysis
- 1.9 Industry Attractiveness
2. Global Naval Vessels Simulation Market (by Simulators Type)
- 2.1 Navigation Simulators
- 2.2 Engineering Simulators
- 2.3 Combat Simulators
- 2.4 Unmanned Naval Vessel Simulators
- 2.5 Others
3. Global Naval Vessels Simulation Market (by Technology)
- 3.1 Virtual Reality (VR) Simulators
- 3.2 Augmented Reality (AR) Simulators
- 3.3 Mixed Reality Simulators
- 3.4 Desktop/PC-Based Simulators
4. Global Naval Vessels Simulation Market (by Application)
- 4.1 Training and Skill Development
- 4.2 Research and Development
- 4.3 Testing and Validation
5. Global Naval Vessels Simulation Market (by End User)
- 5.1 Navies & Defense Force
- 5.2 Maritime Academies and Training Institutes
- 5.3 Private Sector and Commercial Operators
6. Global Naval Vessels Simulation Market (by Region)
- 6.1 Global Naval Vessels Simulation Market (by Region)
- 6.2 North America
- 6.2.1 Regional Overview
- 6.2.2 Driving Factors for Market Growth
- 6.2.3 Factors Challenging the Market
- 6.2.4 Key Companies
- 6.2.5 Simulators Type
- 6.2.6 Technology
- 6.2.7 Application
- 6.2.8 End User
- 6.2.9 North America (by Country)
- 6.2.9.1 U.S.
- 6.2.9.1.1 Market by Simulators Type
- 6.2.9.1.2 Market by Technology
- 6.2.9.1.3 Market by Application
- 6.2.9.1.4 Market by End User
- 6.2.9.2 Canada
- 6.2.9.2.1 Market by Simulators Type
- 6.2.9.2.2 Market by Technology
- 6.2.9.2.3 Market by Application
- 6.2.9.2.4 Market by End User
- 6.2.9.3 Mexico
- 6.2.9.3.1 Market by Simulators Type
- 6.2.9.3.2 Market by Technology
- 6.2.9.3.3 Market by Application
- 6.2.9.3.4 Market by End User
- 6.2.9.1 U.S.
- 6.3 Europe
- 6.3.1 Regional Overview
- 6.3.2 Driving Factors for Market Growth
- 6.3.3 Factors Challenging the Market
- 6.3.4 Key Companies
- 6.3.5 Simulators Type
- 6.3.6 Technology
- 6.3.7 Application
- 6.3.8 End User
- 6.3.9 Europe (by Country)
- 6.3.9.1 Germany
- 6.3.9.1.1 Market by Simulators Type
- 6.3.9.1.2 Market by Technology
- 6.3.9.1.3 Market by Application
- 6.3.9.1.4 Market by End User
- 6.3.9.2 France
- 6.3.9.2.1 Market by Simulators Type
- 6.3.9.2.2 Market by Technology
- 6.3.9.2.3 Market by Application
- 6.3.9.2.4 Market by End User
- 6.3.9.3 Italy
- 6.3.9.3.1 Market by Simulators Type
- 6.3.9.3.2 Market by Technology
- 6.3.9.3.3 Market by Application
- 6.3.9.3.4 Market by End User
- 6.3.9.4 Spain
- 6.3.9.4.1 Market by Simulators Type
- 6.3.9.4.2 Market by Technology
- 6.3.9.4.3 Market by Application
- 6.3.9.4.4 Market by End User
- 6.3.9.5 U.K.
- 6.3.9.5.1 Market by Simulators Type
- 6.3.9.5.2 Market by Technology
- 6.3.9.5.3 Market by Application
- 6.3.9.5.4 Market by End User
- 6.3.9.6 Rest-of-Europe
- 6.3.9.6.1 Market by Simulators Type
- 6.3.9.6.2 Market by Technology
- 6.3.9.6.3 Market by Application
- 6.3.9.6.4 Market by End User
- 6.3.9.1 Germany
- 6.4 Asia-Pacific
- 6.4.1 Regional Overview
- 6.4.2 Driving Factors for Market Growth
- 6.4.3 Factors Challenging the Market
- 6.4.4 Key Companies
- 6.4.5 Simulators Type
- 6.4.6 Technology
- 6.4.7 Application
- 6.4.8 End User
- 6.4.9 Asia-Pacific (by Country)
- 6.4.9.1 China
- 6.4.9.1.1 Market by Simulators Type
- 6.4.9.1.2 Market by Technology
- 6.4.9.1.3 Market by Application
- 6.4.9.1.4 Market by End User
- 6.4.9.2 Japan
- 6.4.9.2.1 Market by Simulators Type
- 6.4.9.2.2 Market by Technology
- 6.4.9.2.3 Market by Application
- 6.4.9.2.4 Market by End User
- 6.4.9.3 India
- 6.4.9.3.1 Market by Simulators Type
- 6.4.9.3.2 Market by Technology
- 6.4.9.3.3 Market by Application
- 6.4.9.3.4 Market by End User
- 6.4.9.4 South Korea
- 6.4.9.4.1 Market by Simulators Type
- 6.4.9.4.2 Market by Technology
- 6.4.9.4.3 Market by Application
- 6.4.9.4.4 Market by End User
- 6.4.9.5 Rest-of-Asia-Pacific
- 6.4.9.5.1 Market by Simulators Type
- 6.4.9.5.2 Market by Technology
- 6.4.9.5.3 Market by Application
- 6.4.9.5.4 Market by End User
- 6.4.9.1 China
- 6.5 Rest-of-the-World
- 6.5.1 Regional Overview
- 6.5.2 Driving Factors for Market Growth
- 6.5.3 Factors Challenging the Market
- 6.5.4 Key Companies
- 6.5.5 Simulators Type
- 6.5.6 Technology
- 6.5.7 Application
- 6.5.8 End User
- 6.5.9 Rest-of-the-World (by Region)
- 6.5.9.1 South America
- 6.5.9.1.1 Market by Simulators Type
- 6.5.9.1.2 Market by Technology
- 6.5.9.1.3 Market by Application
- 6.5.9.1.4 Market by End User
- 6.5.9.2 Middle East and Africa
- 6.5.9.2.1 Market by Simulators Type
- 6.5.9.2.2 Market by Technology
- 6.5.9.2.3 Market by Application
- 6.5.9.2.4 Market by End User
- 6.5.9.1 South America
7. Markets - Competitive Benchmarking & Company Profiles
- 7.1 Next Frontiers
- 7.2 Geographic Assessment
- 7.3 Company Profiles
- 7.3.1 CAE Inc.
- 7.3.1.1 Overview
- 7.3.1.2 Top Products/Product Portfolio
- 7.3.1.3 Top Competitors
- 7.3.1.4 Target Customers
- 7.3.1.5 Key Personnel
- 7.3.1.6 Analyst View
- 7.3.1.7 Market Share
- 7.3.2 L3Harris Technologies, Inc.
- 7.3.2.1 Overview
- 7.3.2.2 Top Products/Product Portfolio
- 7.3.2.3 Top Competitors
- 7.3.2.4 Target Customers
- 7.3.2.5 Key Personnel
- 7.3.2.6 Analyst View
- 7.3.2.7 Market Share
- 7.3.3 ARI Simulation
- 7.3.3.1 Overview
- 7.3.3.2 Top Products/Product Portfolio
- 7.3.3.3 Top Competitors
- 7.3.3.4 Target Customers
- 7.3.3.5 Key Personnel
- 7.3.3.6 Analyst View
- 7.3.3.7 Market Share
- 7.3.4 Kongsberg Maritime
- 7.3.4.1 Overview
- 7.3.4.2 Top Products/Product Portfolio
- 7.3.4.3 Top Competitors
- 7.3.4.4 Target Customers
- 7.3.4.5 Key Personnel
- 7.3.4.6 Analyst View
- 7.3.4.7 Market Share
- 7.3.5 Rheinmetall AG
- 7.3.5.1 Overview
- 7.3.5.2 Top Products/Product Portfolio
- 7.3.5.3 Top Competitors
- 7.3.5.4 Target Customers
- 7.3.5.5 Key Personnel
- 7.3.5.6 Analyst View
- 7.3.5.7 Market Share
- 7.3.6 Thales
- 7.3.6.1 Overview
- 7.3.6.2 Top Products/Product Portfolio
- 7.3.6.3 Top Competitors
- 7.3.6.4 Target Customers
- 7.3.6.5 Key Personnel
- 7.3.6.6 Analyst View
- 7.3.6.7 Market Share
- 7.3.7 Dynautics Limited
- 7.3.7.1 Overview
- 7.3.7.2 Top Products/Product Portfolio
- 7.3.7.3 Top Competitors
- 7.3.7.4 Target Customers
- 7.3.7.5 Key Personnel
- 7.3.7.6 Analyst View
- 7.3.7.7 Market Share
- 7.3.8 Wartsila
- 7.3.8.1 Overview
- 7.3.8.2 Top Products/Product Portfolio
- 7.3.8.3 Top Competitors
- 7.3.8.4 Target Customers
- 7.3.8.5 Key Personnel
- 7.3.8.6 Analyst View
- 7.3.8.7 Market Share
- 7.3.9 Cubic Corporation
- 7.3.9.1 Overview
- 7.3.9.2 Top Products/Product Portfolio
- 7.3.9.3 Top Competitors
- 7.3.9.4 Target Customers
- 7.3.9.5 Key Personnel
- 7.3.9.6 Analyst View
- 7.3.9.7 Market Share
- 7.3.10 Rheinmetall AG
- 7.3.10.1 Overview
- 7.3.10.2 Top Products/Product Portfolio
- 7.3.10.3 Top Competitors
- 7.3.10.4 Target Customers
- 7.3.10.5 Key Personnel
- 7.3.10.6 Analyst View
- 7.3.10.7 Market Share
- 7.3.1 CAE Inc.
- 7.4 Other Key Companies
