|
|
市場調査レポート
商品コード
1540775
欧州の農業用画像センサー市場:用途別、製品別、国別 - 分析と予測(2023年~2033年)Europe Agriculture Imaging Sensor Market: Focus on Application, Product, and Country - Analysis and Forecast, 2023-2033 |
||||||
|
|||||||
カスタマイズ可能
|
|||||||

| 欧州の農業用画像センサー市場:用途別、製品別、国別 - 分析と予測(2023年~2033年) |
|
出版日: 2024年08月27日
発行: BIS Research
ページ情報: 英文 70 Pages
納期: 1~5営業日
|

全表示
- 概要
- 図表
- 目次
欧州の農業用画像センサーの市場規模は、2023年に5億110万米ドルとなりました。
同市場は、2033年には20億8,970万米ドルに達すると予測されています。この地域でのこの技術の採用と進歩の高まりが、欧州の農業用画像センサー市場の大幅な成長の原動力となっています。2023年初頭、欧州委員会は、EUの農業界全体でデジタル農業技術の採用が拡大していることを強調する重要な報告書を発表しました。この報告書では、欧州の技術革新への熱心さが、重要作物における収量マップ、土壌マップ、可変速度技術(VRT)の利用の増加にいかに反映されているかが強調されています。デジタルマッピングにおける画像センサーの広範な使用は、今後数年間、欧州におけるこれらのセンサーに対する需要が大幅に増加すると予想されることを示しています。
| 主要市場統計 | |
|---|---|
| 予測期間 | 2023年~2033年 |
| 2023年の評価 | 5億110万米ドル |
| 2033年の予測 | 20億8,970万米ドル |
| CAGR | 15.35% |
マルチスペクトルセンサーは、同様に革命的な変化を経験している農業用画像センサーの世界市場において、主要な製品カテゴリーとして台頭してきています。複数の波長にわたってデータを取り込むことができるこれらのセンサーは、作物の健康状態、栄養レベル、害虫の発生に関する本質的な洞察を欧州の農家に提供します。この高度な技術は的確な意思決定をサポートし、収穫量を増やし資源効率を向上させる農業慣行を強化します。
作物の収穫量を増やし、資源利用を最適化し、環境への影響を軽減するために、農業部門が精密農業技術を採用する頻度が高まる中、欧州の農業用画像センサの精密農業技術市場は急速に成長しています。画像センサーは、作物の健康状態、土壌の状態、圃場の変動に関する詳細なデータを取得できるため、現代農業の課題に対応しようとする欧州の農家にとって不可欠なツールとなっています。熱画像、ハイパースペクトル画像、マルチスペクトル画像ツールなどを含むこれらのセンサーは、施肥や灌漑の最大化から、病気や害虫の侵入を早期に警告する兆候の発見まで、さまざまな用途で正確な意思決定を促進する重要な情報を提供します。
食料安全保障、持続可能な農業、温室効果ガス排出削減を重視するEUなど、多くの要因が市場の成長を後押ししています。欧州グリーンディールや共通農業政策(CAP)のような政策が、デジタル農業や精密農業技術の採用を後押ししており、これが高度画像センサーの需要を押し上げています。さらに、高解像度の衛星画像やドローンベースの画像処理システムの利用可能性が高まっていることから、これらの技術は地域全体の農家にとってより身近で手頃なものとなっています。
当レポートでは、欧州の農業用画像センサー市場について調査し、市場の概要とともに、用途別、製品別、国別の動向、および市場に参入する企業のプロファイルなどを提供しています。
目次
エグゼクティブサマリー
第1章 市場
- 動向:現在および将来の影響評価
- サプライチェーンの概要
- 規制状況
- 市場力学の概要
第2章 地域
- 地域別概要
- 欧州
- 地域概要
- 市場成長促進要因
- 市場成長抑制要因
- 応用
- 製品
- フランス
- ドイツ
- 英国
- スペイン
- イタリア
- ベルギー
- ウクライナ
- その他
第3章 市場- 競合ベンチマーキングと企業プロファイル
- Cubert GmbH
- Specim
- Parrot Drone SAS
第4章 調査手法
List of Figures
- Figure 1: Europe Agriculture Imaging Sensor Market (by End User), $Million, 2022, 2023, and 2033
- Figure 2: Europe Agriculture Imaging Sensor Market (by Product), $ Million, 2022, 2023, and 2033
- Figure 3: Agriculture Imaging Sensor, Recent Developments
- Figure 4: Investments in Artificial Intelligence, $Billion, 2019-2022
- Figure 5: Supply Chain and Risks within the Supply Chain
- Figure 6: Impact Analysis of Market Navigating Factors, 2023-2033
- Figure 7: France Agriculture Imaging Sensor Market, $Million, 2022-2033
- Figure 8: Germany Agriculture Imaging Sensor Market, $Million, 2022-2033
- Figure 9: U.K. Agriculture Imaging Sensor Market, $Million, 2022-2033
- Figure 10: Spain Agriculture Imaging Sensor Market, $Million, 2022-2033
- Figure 11: Italy Agriculture Imaging Sensor Market, $Million, 2022-2033
- Figure 12: Belgium Agriculture Imaging Sensor Market, $Million, 2022-2033
- Figure 13: Ukraine Agriculture Imaging Sensor Market, $Million, 2022-2033
- Figure 14: Rest-of-Europe Agriculture Imaging Sensor Market, $Million, 2022-2033
- Figure 15: Data Triangulation
- Figure 16: Top-Down and Bottom-Up Approach
- Figure 17: Assumptions and Limitations
List of Tables
- Table 1: Market Snapshot
- Table 2: Opportunities across Region
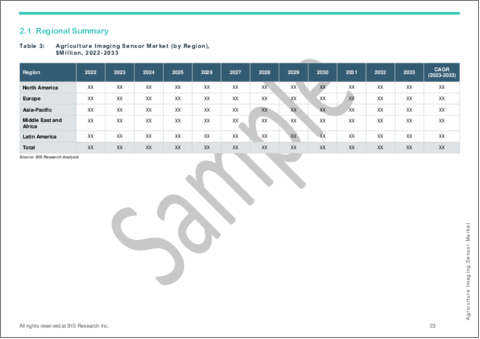
- Table 3: Agriculture Imaging Sensor Market (by Region), $Million, 2022-2033
- Table 4: Europe Agriculture Imaging Sensor Market (by End User), $Million, 2022-2033
- Table 5: Europe Agriculture Imaging Sensor Market (by End User), Units, 2022-2033
- Table 6: Europe Agriculture Imaging Sensor Market (by Product), $Million, 2022-2033
- Table 7: Europe Agriculture Imaging Sensor Market (by Product), Units, 2022-2033
- Table 8: France Agriculture Imaging Sensor Market (by End User), $Million, 2022-2033
- Table 9: France Agriculture Imaging Sensor Market (by End User), Units, 2022-2033
- Table 10: France Agriculture Imaging Sensor Market (by Product), $Million, 2022-2033
- Table 11: France Agriculture Imaging Sensor Market (by Product), Units, 2022-2033
- Table 12: Germany Agriculture Imaging Sensor Market (by End User), $Million, 2022-2033
- Table 13: Germany Agriculture Imaging Sensor Market (by End User), Units, 2022-2033
- Table 14: Germany Agriculture Imaging Sensor Market (by Product), $Million, 2022-2033
- Table 15: Germany Agriculture Imaging Sensor Market (by Product), Units, 2022-2033
- Table 16: U.K. Agriculture Imaging Sensor Market (by End User), $Million, 2022-2033
- Table 17: U.K. Agriculture Imaging Sensor Market (by End User), Units, 2022-2033
- Table 18: U.K. Agriculture Imaging Sensor Market (by Product), $Million, 2022-2033
- Table 19: U.K. Agriculture Imaging Sensor Market (by Product), Units, 2022-2033
- Table 20: Spain Agriculture Imaging Sensor Market (by End User), $Million, 2022-2033
- Table 21: Spain Agriculture Imaging Sensor Market (by End User), Units, 2022-2033
- Table 22: Spain Agriculture Imaging Sensor Market (by Product), $Million, 2022-2033
- Table 23: Spain Agriculture Imaging Sensor Market (by Product), Units, 2022-2033
- Table 24: Italy Agriculture Imaging Sensor Market (by End User), $Million, 2022-2033
- Table 25: Italy Agriculture Imaging Sensor Market (by End User), Units, 2022-2033
- Table 26: Italy Agriculture Imaging Sensor Market (by Product), $Million, 2022-2033
- Table 27: Italy Agriculture Imaging Sensor Market (by Product), Units, 2022-2033
- Table 28: Belgium Agriculture Imaging Sensor Market (by End User), $Million, 2022-2033
- Table 29: Belgium Agriculture Imaging Sensor Market (by End User), Units, 2022-2033
- Table 30: Belgium Agriculture Imaging Sensor Market (by Product), $Million, 2022-2033
- Table 31: Belgium Agriculture Imaging Sensor Market (by Product), Units, 2022-2033
- Table 32: Ukraine Agriculture Imaging Sensor Market (by End User), $Million, 2022-2033
- Table 33: Ukraine Agriculture Imaging Sensor Market (by End User), Units, 2022-2033
- Table 34: Ukraine Agriculture Imaging Sensor Market (by Product), $Million, 2022-2033
- Table 35: Ukraine Agriculture Imaging Sensor Market (by Product), Units, 2022-2033
- Table 36: Rest-of-Europe Agriculture Imaging Sensor Market (by End User), $Million, 2022-2033
- Table 37: Rest-of-Europe Agriculture Imaging Sensor Market (by End User), Units, 2022-2033
- Table 38: Rest-of-Europe Agriculture Imaging Sensor Market (by Product), $Million, 2022-2033
- Table 39: Rest-of-Europe Agriculture Imaging Sensor Market (by Product), Units, 2022-2033
Introduction to Europe Agriculture Imaging Sensor Market
The Europe agriculture imaging sensor market was valued at $501.1 million in 2023 and is expected to reach $2,089.7 million by 2033. Growing adoption and advancement of this technology in the region is driving the substantial growth of the European agriculture imaging sensor market. Early in 2023, the European Commission released a significant report that emphasized the growing adoption of digital agriculture technologies throughout the EU's farming industry. The report emphasized how Europe's dedication to technological innovation is reflected in the increasing use of yield maps, soil maps, and variable rate technologies (VRT) in important crops. The extensive use of imaging sensors in digital mapping points to a significant and expected increase in demand for these sensors in Europe over the next several years.
| KEY MARKET STATISTICS | |
|---|---|
| Forecast Period | 2023 - 2033 |
| 2023 Evaluation | $501.1 Million |
| 2033 Forecast | $2,089.7 Million |
| CAGR | 15.35% |
Multispectral sensors are emerging as a key product category in the global market for agriculture imaging sensors, which is likewise experiencing a revolutionary change. These sensors, capable of capturing data across multiple wavelengths, provide European farmers with essential insights into crop health, nutrient levels, and pest infestations. This advanced technology supports precise decision-making, enhancing agricultural practices to increase yields and improve resource efficiency.
Market Introduction
With the agricultural sector adopting precision farming technologies more frequently to increase crop yields, optimize resource use, and lessen environmental impact, precision farming technologies market for agriculture imaging sensors in Europe is growing quickly. Imaging sensors are becoming indispensable tools for European farmers trying to meet the challenges of modern agriculture because they capture detailed data on crop health, soil conditions, and field variability. These sensors, which include thermal, hyperspectral, and multispectral imaging tools, offer vital information that facilitates accurate decision-making in a variety of applications, from maximizing fertilization and irrigation to spotting early warning indications of disease and pest infestation.
A number of factors, such as the EU's emphasis on food security, sustainable agriculture, and the reduction of greenhouse gas emissions, are driving the market's growth. Policies like the Common Agricultural Policy (CAP) and the European Green Deal and the Common Agricultural Policy (CAP) are pushing for the adoption of digital and precision farming technologies, which, in turn, boosts demand for advanced imaging sensors. Additionally, the increasing availability of high-resolution satellite imagery and drone-based imaging systems is making these technologies more accessible and affordable for farmers across the region.
The market for agriculture imaging sensors in Europe is expected to grow significantly as the agricultural sector continues to embrace digital transformation. This development will be critical to the region's ability to continue practicing sustainable farming.
Market Segmentation
Segmentation 1: by End User
- Agriculture Robot Manufacturer
- Agriculture Drone Manufacturer
- Livestock Monitoring Equipment Manufacturer
- Others
Segmentation 2: by Product
- RGB Sensor
- Hyperspectral Sensor
- Multispectral Sensor
- Others
Segmentation 3: by Country
- Germany
- France
- U.K.
- Belgium
- Spain
- Italy
- Ukraine
- Rest-of-Europe
How can this report add value to an organization?
Product/Innovation Strategy: The product segment helps the reader understand the different applications of the Europe agriculture imaging sensor products available based on distribution channel, product type, and technology. The market is poised for significant expansion with ongoing technological advancements, increased investments, and growing awareness of precision agriculture. Therefore, the agriculture imaging sensor business is a high-investment and high-revenue generating model.
Growth/Marketing Strategy: The Europe agriculture imaging sensor market has been growing at a rapid pace. The market offers enormous opportunities for existing and emerging market players. Some of the strategies covered in this segment are mergers and acquisitions, product launches, partnerships and collaborations, business expansions, and investments. The strategies preferred by companies to maintain and strengthen their market position primarily include partnerships and collaborations.
Competitive Strategy: The key players in the Europe agriculture imaging sensor market analyzed and profiled in the study include imaging sensor manufacturers. Additionally, a comprehensive competitive landscape such as partnerships, agreements, and collaborations are expected to aid the reader in understanding the untapped revenue pockets in the market.
Key Market Players and Competition Synopsis
The companies that are profiled have been selected based on inputs gathered from primary experts and analyzing company coverage, product portfolio, and market penetration.
Some of the prominent names in this market are:
- Cubert GmbH
- Specim
- Parrot Drone SAS
Table of Contents
Executive Summary
Scope and Definition
1 Markets
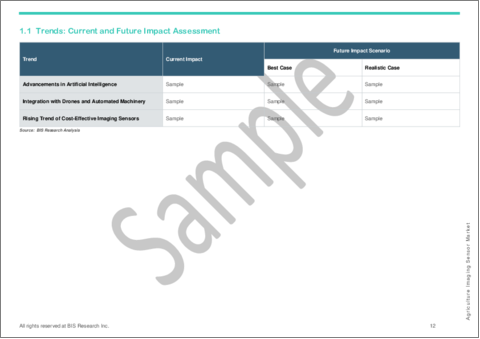
- 1.1 Trends: Current and Future Impact Assessment
- 1.1.1 Advancements in Artificial Intelligence
- 1.1.2 Integration with Drones and Automated Machinery
- 1.1.3 Rising Trend of Cost-Effective Imaging Sensors
- 1.2 Supply Chain Overview
- 1.2.1 Value Chain Analysis
- 1.2.2 Market Map
- 1.3 Regulatory Landscape
- 1.4 Market Dynamics Overview
- 1.4.1 Market Drivers
- 1.4.1.1 Increasing Use of Precision Agriculture and Yield Optimization
- 1.4.1.2 Innovations in Imaging Technologies
- 1.4.1.3 Government Initiatives and Support
- 1.4.2 Market Restraints
- 1.4.2.1 High Initial Investment Cost
- 1.4.2.2 Lack of Technical Skills in Farmers
- 1.4.3 Market Opportunities
- 1.4.3.1 Collaborations in Agri-Tech Startups
- 1.4.3.2 Expansion in Developing Economies
- 1.4.1 Market Drivers
2 Regions
- 2.1 Regional Summary
- 2.2 Europe
- 2.2.1 Regional Overview
- 2.2.2 Driving Factors for Market Growth
- 2.2.3 Factors Challenging the Market
- 2.2.4 Application
- 2.2.5 Product
- 2.2.6 France
- 2.2.7 Germany
- 2.2.8 U.K.
- 2.2.9 Spain
- 2.2.10 Italy
- 2.2.11 Belgium
- 2.2.12 Ukraine
- 2.2.13 Rest-of-Europe
3 Markets - Competitive Benchmarking & Company Profiles
- 3.1.1 Cubert GmbH
- 3.1.1.1 Overview
- 3.1.1.2 Top Products/Product Portfolio
- 3.1.1.3 Top Competitors
- 3.1.1.4 Target Customers
- 3.1.1.5 Key Personnel
- 3.1.1.6 Analyst View
- 3.1.1.7 Market Share
- 3.1.2 Specim
- 3.1.2.1 Overview
- 3.1.2.2 Top Products/Product Portfolio
- 3.1.2.3 Top Competitors
- 3.1.2.4 Target Customers
- 3.1.2.5 Key Personnel
- 3.1.2.6 Analyst View
- 3.1.2.7 Market Share
- 3.1.3 Parrot Drone SAS
- 3.1.3.1 Overview
- 3.1.3.2 Top Products/Product Portfolio
- 3.1.3.3 Top Competitors
- 3.1.3.4 Target Customers
- 3.1.3.5 Key Personnel
- 3.1.3.6 Analyst View
- 3.1.3.7 Market Share
4 Research Methodology
- 4.1 Data Sources
- 4.1.1 Primary Data Sources
- 4.1.2 Secondary Data Sources
- 4.1.3 Data Triangulation
- 4.2 Market Estimation and Forecast
