|
|
市場調査レポート
商品コード
1420113
植物性乳製品の世界市場(2024年版):製品カテゴリー別、流通チャネル別、地域別、国別の分析:市場考察、予測(2024年~2029年)Global Plant-Based Dairy Products Market (2024 Edition) - Analysis By Product Category (Milk, Desserts, Cream, Cheese, Others), Distribution Channel (Online, Offline), By Region, By Country: Market Insights and Forecast (2024-2029) |
||||||
|
|||||||
|
|||||||

| 植物性乳製品の世界市場(2024年版):製品カテゴリー別、流通チャネル別、地域別、国別の分析:市場考察、予測(2024年~2029年) |
|
出版日: 2024年02月01日
発行: Azoth Analytics
ページ情報: 英文 200 Pages
納期: 即納可能
|

全表示
- 概要
- 図表
- 目次
世界の植物性乳製品の市場規模は、2022年に246億米ドルに達し、2019年~2022年に2.33%の成長を示しました。植物性の製品は食品産業を変えつつあり、複数の要因が消費者の意思決定におけるこの変化を促進しています。植物性乳製品の入手可能性についての意識の高まりに基づき、自身と地球の健康にとって正しい決断を下そうとする消費者が増えています。さらに、乳糖不耐症の消費者が増え続けていることや、健康上の利益を重視するために食品の味を妥協する選好が高まっていることも、成長を後押ししています。
もっとも小規模な製品カテゴリである植物性卵は、より多くの製品が発売されるにつれて、高速な二桁成長を示しています。例えば、PURISはAcreMadeブランドでエンドウ豆タンパク質を使用した植物性卵の新製品を発売し、「植物性食の可能性の世界を解き放つ、美味しく使いやすく栄養価の高い、上位9つのアレルゲンを含まない製品による植物性卵の新時代」と述べています。
当レポートでは、世界の植物性乳製品市場について調査し、市場規模と予測、地域とセグメントの分析、主要動向と機会などの情報を提供しています。
目次
第1章 市場の背景
- 範囲と製品の見通し
- エグゼクティブサマリー
- 調査手法
第2章 戦略的推奨事項
第3章 世界の植物性乳製品市場:実績と予測(2019年~2029年)
- 植物性乳製品市場に対するマクロ経済要因の影響の分析
- 1人当たりGDP:国別(2022年)
- 世界中の都市部に住む人々の割合
- インターネットユーザー:国別
- 携帯電話ユーザー:国別、高齢者の割合がもっとも多い上位50ヶ国
- 世界の植物性乳製品市場:ダッシュボード
- 世界の植物性乳製品市場:市場規模とCAGR(2019年~2029年)
- 植物性乳製品市場に対するCOVID-19の影響度
- 世界の植物性乳製品市場セグメンテーション:製品カテゴリ別
- 世界の植物性乳製品市場:製品カテゴリ別、概要
- 世界の植物性乳製品の市場規模:牛乳(金額)(2019年~2029年)
- 世界の植物性乳製品の市場規模:デザート(金額)(2019年~2029年)
- 世界の植物性乳製品の市場規模:クリーム(金額)(2019年~2029年)
- 世界の植物性乳製品の市場規模:チーズ(金額)(2019年~2029年)
- 世界の植物性乳製品の市場規模:その他(金額)(2019年~2029年)
- 世界の植物性乳製品市場セグメンテーション:流通チャネル別
- 世界の植物性乳製品市場:流通チャネル別、概要
- 世界の植物性乳製品の市場規模:オンライン/eコマース(金額)(2019年~2029年)
- 世界の植物性乳製品の市場規模:オフライン(金額)(2019年~2029年)
第4章 世界の植物性乳製品市場、地域分析
- 研究の地域範囲
- 地域のスナップショット
第5章 北米の植物性乳製品市場:実績と予測(2019年~2029年)
- 北米の植物性乳製品市場:スナップショット
- 北米の植物性乳製品市場:市場規模とCAGR(2019年~2029年)
- 北米の植物性乳製品市場:主な要因
- 北米の植物性乳製品市場セグメンテーション:製品カテゴリ別
- 北米の植物性乳製品市場セグメンテーション:流通チャネル別
- 北米の植物性乳製品市場セグメンテーション:国別
- 米国の植物性乳製品市場:市場規模とCAGR(2019年~2029年)
- カナダの植物性乳製品市場:市場規模とCAGR(2019年~2029年)
第6章 欧州の植物性乳製品市場:実績と予測(2019年~2029年)
- 欧州の植物性乳製品市場:スナップショット
- 欧州の植物性乳製品市場:市場規模とCAGR(2019年~2029年)
- 欧州の植物性乳製品市場:主な要因
- 欧州の植物性乳製品市場セグメンテーション:製品カテゴリ別
- 欧州の植物性乳製品市場セグメンテーション:流通チャネル別
- 欧州の植物性乳製品市場セグメンテーション:国別
- 英国の植物性乳製品市場:市場規模とCAGR(2019年~2029年)
- フランスの植物性乳製品市場:市場規模とCAGR(2019年~2029年)
- ドイツの植物性乳製品市場:市場規模とCAGR(2019年~2029年)
- イタリアの植物性乳製品市場:市場規模とCAGR(2019年~2029年)
- その他の欧州の植物性乳製品市場:市場規模とCAGR(2019年~2029年)
第7章 アジア太平洋の植物性乳製品市場:実績と予測(2019年~2029年)
- アジア太平洋の植物性乳製品市場:スナップショット
- アジア太平洋の植物性乳製品市場:市場規模とCAGR(2019年~2029年)
- アジア太平洋の植物性乳製品市場:主な要因
- アジア太平洋の植物性乳製品市場セグメンテーション:製品カテゴリ別
- アジア太平洋の植物性乳製品市場:市場規模とCAGR(2019年~2029年)
- アジア太平洋の植物性乳製品市場:主な要因
- アジア太平洋の植物性乳製品市場セグメンテーション:製品カテゴリ別
- アジア太平洋の植物性乳製品市場セグメンテーション:流通チャネル別
- アジア太平洋の植物性乳製品市場:市場規模とCAGR(2019年~2029年)
- 中国の植物性乳製品市場:市場規模とCAGR(2019年~2029年)
- 日本の植物性乳製品市場:市場規模とCAGR(2019年~2029年)
- インドの植物性乳製品市場:市場規模とCAGR(2019年~2029年)
- 韓国の植物性乳製品市場:市場規模とCAGR(2019年~2029年)
- その他のアジア太平洋の植物性乳製品市場:市場規模とCAGR(2019年~2029年)
第8章 その他の地域の植物性乳製品市場:実績と予測
- その他の地域の植物性乳製品市場:スナップショット
- その他の地域の植物性乳製品市場:市場規模とCAGR(2019年~2029年)
- その他の地域の植物性乳製品市場セグメンテーション:製品カテゴリ別
- その他の地域の植物性乳製品市場セグメンテーション:流通チャネル別
第9章 市場力学
- 世界の植物性乳製品市場に対する市場力学の影響の評価
- 促進要因
- 抑制要因
- 動向
第10章 産業エコシステム分析
- バリューチェーン分析
- SWOT分析
第11章 競合情勢
- 競合ポジショニング
- 著名な企業の市場シェア
- 企業プロファイル
- Danone S.A.
- Nestle S.A.
- Natura Foods
- Oatly Group AB
- Unilever PLC
- Epigamia
- Earth's Own Food Company, Inc.
- Koninklijke DSM N.V.
- Plamil Foods Ltd.
- Sunrise Soya Foods
List of Figures
List of Figures
- Figure 1: GDP Per Capita, By Countries, 2022 (In USD)
- Figure 2: Population by World Region (1800-2100)
- Figure 3: World Medan Age, 2021
- Figure 4: Share of People Living in Urban Area, 2021
- Figure 5: Internet Users, By Country, 2022
- Figure 6: Cellphone Users, By Country, 2022
- Figure 7: Global Plant Based Dairy Products Market Size, By Value, 2019-2022 (USD Million)
- Figure 8: Global Plant Based Dairy Products Market Size, By Value, 2023-2029 (USD Million)
- Figure 9: Global Plant Based Dairy Products CAGR, 2019-2022 and 2024-2029 (%)
- Figure 10: Global Plant Based Dairy Products Market Size, By Milk, By Value, 2019H-2029F (USD Million & CAGR)
- Figure 11: Global Plant Based Dairy Products Market Absolute Opportunity, By Milk, 2019H-2029F (USD Million)
- Figure 12: Global Plant Based Dairy Products Market Size, By Desserts, By Value, 2019H-2029F (USD Million & CAGR)
- Figure 13: Global Plant Based Dairy Products Market Absolute Opportunity, By Desserts, 2019H-2029F (USD Million)
- Figure 14: Global Plant Based Dairy Products Market Size, By Cream, By Value, 2019H-2029F (USD Million)
- Figure 15: Global Plant Based Dairy Products Market Absolute Opportunity, By Cream, 2019H-2029F (USD Million)
- Figure 16: Global Plant Based Dairy Products Market Size, By Cheese, By Value, 2019H-2029F (USD Million)
- Figure 17: Global Plant Based Dairy Products Market Absolute Opportunity, By Cheese, 2019H-2029F (USD Million)
- Figure 18: Global Plant Based Dairy Products Market Size, By Others, By Value, 2019H-2029F (USD Million)
- Figure 19: Global Plant Based Dairy Products Market Absolute Opportunity, By Others, 2019H-2029F (USD Million)
- Figure 20: Global Plant Based Dairy Products Market Size, By Online/E-commerce, By Value, 2019H-2029F (USD Million & CAGR)
- Figure 21: Global Plant Based Dairy Products Market Absolute Opportunity, By Online/E-commerce, 2019H-2029F (USD Million)
- Figure 22: Global Plant Based Dairy Products Market Size, By Offline, By Value, 2019H-2029F (USD Million & CAGR)
- Figure 23: Global Plant Based Dairy Products Market Absolute Opportunity, By Offline, 2019H-2029F (USD Million)
- Figure 24: North America Plant Based Dairy Products Market Size, By Value, 2019H-2029F (USD Million)
- Figure 25: North America Plant Based Dairy Products Market Share, By Product Category, 2022 (%)
- Figure 26: North America Plant Based Dairy Products Market, By Milk, By Value, 2019H-2029F (USD Million & CAGR)
- Figure 27: North America Plant Based Dairy Products Market, By Desserts, By Value, 2019H-2029F (USD Million & CAGR)
- Figure 28: North America Plant Based Dairy Products Market, By Cream, By Value, 2019H-2029F (USD Million)
- Figure 29: North America Plant Based Dairy Products Market, By Cheese, By Value, 2019H-2029F (USD Million & CAGR)
- Figure 30: North America Plant Based Dairy Products Market, By Others, By Value, 2019H-2029F (USD Million & CAGR)
- Figure 31: North America Plant Based Dairy Products Market, By Online/E-commerce, By Value, 2019H-2029F (USD Million & CAGR)
- Figure 32: North America Plant Based Dairy Products Market, By Offline, By Value, 2019H-2029F (USD Million & CAGR)
- Figure 33: United States Plant Based Dairy Products Market, By Value, 2019H-2029F (USD Million & CAGR)
- Figure 34: United States Plant Based Dairy Products Market Value, By Product Category, 2022 (USD Million)
- Figure 35: United States Plant Based Dairy Products Market Share, By Product Category, By Value, 2022 (%)
- Figure 36: United States Plant Based Dairy Products Market Share, By Distribution Channel, By Value, 2022 (%)
- Figure 37: Canada Plant Based Dairy Products Market, By Value, 2019H-2029F (USD Million & CAGR)
- Figure 38: Canada Plant Based Dairy Products Market Share, By Product Category, By Value, 2022 (%)
- Figure 39: Canada Plant Based Dairy Products Market Share, By Product Category, By Value, 2022 (%)
- Figure 40: Canada Plant Based Dairy Products Market Share, By Distribution Channel, By Value, 2022 (%)
- Figure 41: Europe Plant Based Dairy Products Market Size, By Value, 2019H-2029F (USD Million)
- Figure 42: Europe Plant Based Dairy Products Market Share, By Product Category, 2022 (%)
- Figure 43: Europe Plant Based Dairy Products Market, By Milk, By Value, 2019H-2029F (USD Million & CAGR)
- Figure 44: Europe Plant Based Dairy Products Market, By Desserts, By Value, 2019H-2029F (USD Million & CAGR)
- Figure 45: Europe Plant Based Dairy Products Market, By Cream, By Value, 2019H-2029F (USD Million & CAGR)
- Figure 46: Europe Plant Based Dairy Products Market, By Cheese, By Value, 2019H-2029F (USD Million & CAGR)
- Figure 47: Europe Plant Based Dairy Products Market, By Others, By Value, 2019H-2029F (USD Million & CAGR)
- Figure 48: Europe Plant Based Dairy Products Market, By Online/E-commerce , By Value, 2019H-2029F (USD Million & CAGR)
- Figure 49: Europe Plant Based Dairy Products Market, By Offline, By Value, 2019H-2029F (USD Million & CAGR)
- Figure 50: United Kingdom Plant Based Dairy Products Market, By Value, 2019H-2029F (USD Million & CAGR)
- Figure 51: United Kingdom Plant Based Dairy Products Market Value, By Product Category, 2022 (USD Million)
- Figure 52: United Kingdom Plant Based Dairy Products Market Share, By Product Category, By Value, 2022 (%)
- Figure 53: United Kingdom Plant Based Dairy Products Market Share, By Distribution Channel, By Value, 2022 (%)
- Figure 54: France Plant Based Dairy Products Market, By Value, 2019H-2029F (USD Million & CAGR)
- Figure 55: France Plant Based Dairy Products Market Value, By Product Category, 2022 (USD Million)
- Figure 56: France Plant Based Dairy Products Market Share, By Product Category, By Value, 2022 (%)
- Figure 57: France Plant Based Dairy Products Market Share, By Distribution Channel, By Value, 2022 (%)
- Figure 58: Germany Plant Based Dairy Products Market, By Value, 2019H-2029F (USD Million & CAGR)
- Figure 59: Germany Plant Based Dairy Products Market Value, By Product Category, 2022 (USD Million)
- Figure 60: Germany Plant Based Dairy Products Market Share, By Product Category, By Value, 2022 (%)
- Figure 61: Germany Plant Based Dairy Products Market Share, By Distribution Channel, By Value, 2022 (%)
- Figure 62: Italy Plant Based Dairy Products Market, By Value, 2019H-2029F (USD Million & CAGR)
- Figure 63: Italy Plant Based Dairy Products Market Value, By Product Category, 2022 (USD Million)
- Figure 64: Italy Plant Based Dairy Products Market Share, By Product Category, By Value, 2022 (%)
- Figure 65: Italy Plant Based Dairy Products Market Share, By Distribution Channel, By Value, 2022 (%)
- Figure 66: Rest of Europe Plant Based Dairy Products Market, By Value, 2019H-2029F (USD Million & CAGR)
- Figure 67: Rest of Europe Plant Based Dairy Products Market Value, By Product Category, 2022 (USD Million)
- Figure 68: Rest of Europe Plant Based Dairy Products Market Share, By Product Category, By Value, 2022 (%)
- Figure 69: Rest of Europe Plant Based Dairy Products Market Share, By Distribution Channel, By Value, 2022 (%)
- Figure 70: Asia Pacific Plant Based Dairy Products Market Size, By Value, 2019H-2029F (USD Million)
- Figure 71: Asia Pacific Plant Based Dairy Products Market Share, By Product Category, 2022 (%)
- Figure 72: Asia Pacific Plant Based Dairy Products Market, By Milk, By Value, 2019H-2029F (USD Million & CAGR)
- Figure 73: Asia Pacific Plant Based Dairy Products Market, By Desserts, By Value, 2019H-2029F (USD Million & CAGR)
- Figure 74: Asia Pacific Plant Based Dairy Products Market, By Cream, By Value, 2019H-2029F (USD Million & CAGR)
- Figure 75: Asia Pacific Plant Based Dairy Products Market, By Cheese, By Value, 2019H-2029F (USD Million & CAGR)
- Figure 76: Asia Pacific Plant Based Dairy Products Market, By Others, By Value, 2019H-2029F (USD Million & CAGR)
- Figure 77: Asia Pacific Plant Based Dairy Products Market, By Online/E-commerce , By Value, 2019H-2029F (USD Million & CAGR)
- Figure 78: Asia Pacific Plant Based Dairy Products Market, By Offline, By Value, 2019H-2029F (USD Million & CAGR)
- Figure 79: China Plant Based Dairy Products Market, By Value, 2019H-2029F (USD Million & CAGR)
- Figure 80: China Plant Based Dairy Products Market Value, By Product Category, 2022 (USD Million)
- Figure 81: China Plant Based Dairy Products Market Share, By Product Category, By Value, 2022 (%)
- Figure 82: China Plant Based Dairy Products Market Share, By Distribution Channel, By Value, 2022 (%)
- Figure 83: Japan Plant Based Dairy Products Market, By Value, 2019H-2029F (USD Million & CAGR)
- Figure 84: Japan Plant Based Dairy Products Market Value, By Product Category, 2022 (USD Million)
- Figure 85: Japan Plant Based Dairy Products Market Share, By Product Category, By Value, 2022 (%)
- Figure 86: Japan Plant Based Dairy Products Market Share, By Distribution Channel, By Value, 2022 (%)
- Figure 87: India Plant Based Dairy Products Market, By Value, 2019H-2029F (USD Million & CAGR)
- Figure 88: India Plant Based Dairy Products Market Value, By Product Category, 2022 (USD Million)
- Figure 89: India Plant Based Dairy Products Market Share, By Product Category, By Value, 2022 (%)
- Figure 90: India Plant Based Dairy Products Market Share, By Distribution Channel, By Value, 2022 (%)
- Figure 91: South Korea Plant Based Dairy Products Market, By Value, 2019H-2029F (USD Million & CAGR)
- Figure 92: South Korea Plant Based Dairy Products Market Value, By Product Category, 2022 (USD Million)
- Figure 93: South Korea Plant Based Dairy Products Market Share, By Product Category, By Value, 2022 (%)
- Figure 94: South Korea Plant Based Dairy Products Market Share, By Distribution Channel, By Value, 2022 (%)
- Figure 95: Rest of Asia Pacific Plant Based Dairy Products Market, By Value, 2019H-2029F (USD Million & CAGR)
- Figure 96: Rest of Asia Pacific Plant Based Dairy Products Market Value, By Product Category, 2022 (USD Million)
- Figure 97: Rest of Asia Pacific Plant Based Dairy Products Market Share, By Product Category, By Value, 2022 (%)
- Figure 98: Rest of Asia Pacific Plant Based Dairy Products Market Share, By Distribution Channel, By Value, 2022 (%)
- Figure 99: Rest of the World Plant Based Dairy Products Market Size, By Value, 2019H-2029F (USD Million)
- Figure 100: Rest of the World Plant Based Dairy Products Market Share, By Product Category, 2022 (%)
- Figure 101: Rest of the World Plant Based Dairy Products Market, By Milk, By Value, 2019H-2029F (USD Million & CAGR)
- Figure 102: Rest of the World Plant Based Dairy Products Market, By Desserts, By Value, 2019H-2029F (USD Million & CAGR)
- Figure 103: Rest of the World Plant Based Dairy Products Market, By Cream, By Value, 2019H-2029F (USD Million & CAGR)
- Figure 104: Rest of the World Plant Based Dairy Products Market, By Cheese, By Value, 2019H-2029F (USD Million & CAGR)
- Figure 105: Rest of the World Plant Based Dairy Products Market, By Others, By Value, 2019H-2029F (USD Million & CAGR)
- Figure 106: Rest of the World Plant Based Dairy Products Market, By Online/E-commerce , By Value, 2019H-2029F (USD Million & CAGR)
- Figure 107: Rest of the World Plant Based Dairy Products Market, By Offline, By Value, 2019H-2029F (USD Million & CAGR)
- Figure 108: Market Share of Prominent Companies in Plant Based Dairy Products Market, 2022 (%)
- Figure 109: Danone S.A. Revenue, 2020-2022 (USD Billion)
- Figure 110: Danone S.A. Revenue , By Business Segments, 2022 (%)
- Figure 111: Danone S.A. Revenue, By Geographical Segment , 2022 (%)
- Figure 112: Nestle S.A. Revenues, 2020-2022 (USD Billion)
- Figure 113: Nestle S.A. Revenues, By Operating Segments, 2022 (%)
- Figure 114: Oatly Group AB Revenues, 2020-2021 (USD Million)
- Figure 115: Oatly Group AB Revenues, By Geographical Segments, 2021 (%)
- Figure 116: Unilever PLC Revenues, 2020-2022 (USD Million)
- Figure 117: Unilever PLC Revenues, By Business Segments, 2021 (%)
- Figure 118: Unilever PLC Revenues, By Geographical Segments, 2021 (%)
- Figure 119: DSM Revenues, 2020-2022 (USD Billion)
- Figure 120: DSM Revenues, By Business Segments, 2021 (%)
- Figure 121: DSM Revenues, By Geographical Segments, 2021 (%)
List of Tables
Table A1: Global Impact of Macro Economic Factors, By Region
Table A2: United States Plant Based Dairy Products Market, By Product Category, By Value, 2019-2022 (USD Million)
Table A3: United States Plant Based Dairy Products Market, By Product Category, By Value, 2023-2029 (USD Million)
Table A4: United States Plant Based Dairy Products Market, By Distribution Channel, By Value, 2019-2022 (USD Million)
Table A5: United States Plant Based Dairy Products Market, By Distribution Channel, By Value, 2023-2029 (USD Million)
Table A6: Canada Plant Based Dairy Products Market, By Product Category, By Value, 2019-2022 (USD Million)
Table A7: Canada Plant Based Dairy Products Market, By Product Category, By Value, 2023-2029 (USD Million)
Table A8: Canada Plant Based Dairy Products Market, By Distribution Channel, By Value, 2019-2022 (USD Million)
Table A9: Canada Plant Based Dairy Products Market, By Distribution Channel, By Value, 2023-2029 (USD Million)
Table A10: United Kingdom Plant Based Dairy Products Market, By Product Category, By Value, 2019-2022 (USD Million)
Table A11: United Kingdom Plant Based Dairy Products Market, By Product Category, By Value, 2023-2029 (USD Million)
Table A12: United Kingdom Plant Based Dairy Products Market, By Distribution Channel, By Value, 2019-2022 (USD Million)
Table A13: United Kingdom Plant Based Dairy Products Market, By Distribution Channel, By Value, 2023-2029 (USD Million)
Table A14: France Plant Based Dairy Products Market, By Product Category, By Value, 2019-2022 (USD Million)
Table A15: France Plant Based Dairy Products Market, By Product Category, By Value, 2023-2029 (USD Million)
Table A16: France Plant Based Dairy Products Market, By Distribution Channel, By Value, 2019-2022 (USD Million)
Table A17: France Plant Based Dairy Products Market, By Distribution Channel, By Value, 2023-2029 (USD Million)
Table A18: Germany Plant Based Dairy Products Market, By Product Category, By Value, 2019-2022 (USD Million)
Table A19: Germany Plant Based Dairy Products Market, By Product Category, By Value, 2023-2029 (USD Million)
Table A20: Germany Plant Based Dairy Products Market, By Distribution Channel, By Value, 2019-2022 (USD Million)
Table A21: Germany Plant Based Dairy Products Market, By Distribution Channel, By Value, 2023-2029 (USD Million)
Table A22: Italy Plant Based Dairy Products Market, By Product Category, By Value, 2019-2022 (USD Million)
Table A23: Italy Plant Based Dairy Products Market, By Product Category, By Value, 2023-2029 (USD Million)
Table A24: Italy Plant Based Dairy Products Market, By Distribution Channel, By Value, 2019-2022 (USD Million)
Table A25: Italy Plant Based Dairy Products Market, By Distribution Channel, By Value, 2023-2029 (USD Million)
Table A26: Rest of Europe Plant Based Dairy Products Market, By Product Category, By Value, 2019-2022 (USD Million)
Table A27: Rest of Europe Plant Based Dairy Products Market, By Product Category, By Value, 2023-2029 (USD Million)
Table A28: Rest of Europe Plant Based Dairy Products Market, By Distribution Channel, By Value, 2019-2022 (USD Million)
Table A29: Rest of Europe Plant Based Dairy Products Market, By Distribution Channel, By Value, 2023-2029 (USD Million)
Table A30: China Plant Based Dairy Products Market, By Product Category, By Value, 2019-2022 (USD Million)
Table A31: China Plant Based Dairy Products Market, By Product Category, By Value, 2023-2029 (USD Million)
Table A32: China Plant Based Dairy Products Market, By Distribution Channel, By Value, 2019-2022 (USD Million)
Table A33: China Plant Based Dairy Products Market, By Distribution Channel, By Value, 2023-2029 (USD Million)
Table A34: Japan Plant Based Dairy Products Market, By Product Category, By Value, 2019-2022 (USD Million)
Table A35: Japan Plant Based Dairy Products Market, By Product Category, By Value, 2023-2029 (USD Million)
Table A36: Japan Plant Based Dairy Products Market, By Distribution Channel, By Value, 2019-2022 (USD Million)
Table A37: Japan Plant Based Dairy Products Market, By Distribution Channel, By Value, 2023-2029 (USD Million)
Table A38: India Plant Based Dairy Products Market, By Product Category, By Value, 2019-2022 (USD Million)
Table A39: India Plant Based Dairy Products Market, By Product Category, By Value, 2023-2029 (USD Million)
Table A40: India Plant Based Dairy Products Market, By Distribution Channel, By Value, 2019-2022 (USD Million)
Table A41: India Plant Based Dairy Products Market, By Distribution Channel, By Value, 2023-2029 (USD Million)
Table A42: South Korea Plant Based Dairy Products Market, By Product Category, By Value, 2019-2022 (USD Million)
Table A43: South Korea Plant Based Dairy Products Market, By Product Category, By Value, 2023-2029 (USD Million)
Table A44: South Korea Plant Based Dairy Products Market, By Distribution Channel, By Value, 2019-2022 (USD Million)
Table A45: South Korea Plant Based Dairy Products Market, By Distribution Channel, By Value, 2023-2029 (USD Million)
Table A46: Rest of Asia Pacific Plant Based Dairy Products Market, By Product Category, By Value, 2019-2022 (USD Million)
Table A47: Rest of Asia Pacific Plant Based Dairy Products Market, By Product Category, By Value, 2023-2029 (USD Million)
Table A48: Rest of Asia Pacific Plant Based Dairy Products Market, By Distribution Channel, By Value, 2019-2022 (USD Million)
Table A49: Rest of Asia Pacific Plant Based Dairy Products Market, By Distribution Channel, By Value, 2023-2029 (USD Million)
Table A50: Danone S.A. Key Company Financials, 2020-2022
Table A51: Nestle S.A. Key Financials, 2020-2022
Table A52: Oatly Group AB Key Financials, 2020-2021
Table A53: Unilever PLC Key Financials, 2020-2022
Table A54: DSM Key Financials, 2020-2022
Executive Summary
Azoth Analytics has released a research report titled "Global Plant-Based Dairy Products Market (2024 Edition)" which provides a complete analysis of the Global Plant-Based Dairy Products industry in terms of market segmentation By Product Category (Milk, Desserts, Cream, Cheese, Others), By Distribution Channel (Online/E-commerce, Offline), By Region and By Country for the historical period of 2019-2022, the estimates of 2023 and the forecast period of 2024-2029.
The research report covers a detailed analysis of the global market, the regions (North America, Europe, Asia Pacific, and Rest of the World) and 10 countries (United States, Canada, United Kingdom, Germany, France, Italy, China, India, Japan, and South Korea). Additionally, the research report presents data including market size, yearly growth and potential analysis, the competitive study of market players, investment opportunities and demand forecast. The research report also assesses growth indicators, restraints, supply and demand risk, and other important statistics, as well as a full assessment of current and future market trends that are relevant to the market evolution.
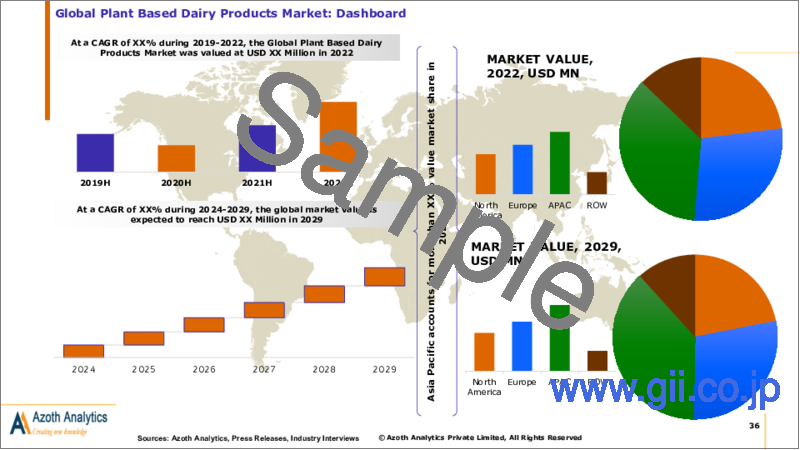
Global Plant Based Dairy Products Market attained a market value of USD 24.6 Billion in 2022 witnessing a growth of 2.33% during 2019-2022. Plant-based products are changing the food industry, and several factors are driving this shift in consumer decision-making. The increasing number of consumers are willing to make the right decisions for their health and the health of their planet based on their increasing awareness of the availability of plant-based dairy products. Additionally, an ever-increasing number of consumers with lactose intolerance and a growing preference for compromising the taste of food to focus on health benefits has been propelling the growth.
The smallest product category, plant-based eggs, is experiencing much faster double-digit growth as more products are launched. For example, PURIS released a new plant-based egg product made with pea protein under the AcreMade brand, citing "a new era of plant-based eggs with delicious, easy-to-use, nutritious products free from the top nine allergens, unlocking a world of potential within plant-based eating."
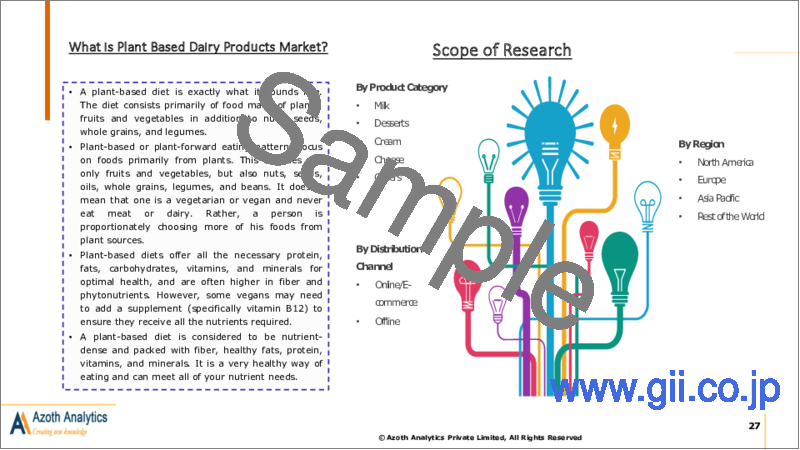
Scope of the Report
- The report analyses the Plant-Based Dairy Products Market by Value (USD Million)
- The report presents the analysis of Plant-Based Dairy Products Market for the historical period of 2019-2022, the estimated year 2023 and the forecast period of 2024-2029.
- The report analyses the Plant-Based Dairy Products Market by Product Category (Milk, Desserts, Cream, Cheese, and Others).
- The report analyses the Plant-Based Dairy Products Market by Distribution Channel (Online/E-commerce, and Offline).
- The key insights of the report have been presented through the frameworks of SWOT. Also, the attractiveness of the market has been presented by region, by services, by mode of operation & by end users.
- Also, the major opportunities, trends, drivers and challenges of the industry have been analysed in the report.
- The report tracks competitive developments, strategies, mergers and acquisitions and new product development. The companies analysed in the report include Danone S.A., Nestle S.A., Natura Foods, Oatly Group AB, Unilever PLC, Epigamia, Earth's Own Food Company, Inc., Koninklijke DSM N.V., Plamil Foods Ltd., Sunrise Soya Foods.
Table of Contents
1. Market Background
- 1.1 Scope and Product Outlook
- 1.2 Executive Summary
- 1.3 Research Methodology
2. Strategic Recommendations
3. Global Plant-Based Dairy Products Market: Historic and Forecast (2019-2029)
- 3.1 Impact Analysis of Macro Economic Factors on Plant-Based Dairy Products Market
- 3.2 GDP Per Capita, By Country (2022)
- 3.3 Share of People Living in the Urban Areas Across the Globe
- 3.4 Internet Users, By Country
- 3.5 Cellphone Users, By Country and Top 50 Countries With the Largest Percentage of Older Adults
- 3.6 Global Plant-Based Dairy Products Market: Dashboard
- 3.7 Global Plant-Based Dairy Products Market: Market Size and CAGR, 2019-2029 (USD Million & CAGR)
- 3.8 Degree of Impact of COVID-19 on Plant-Based Dairy Products Market
- 3.9 Global Plant-Based Dairy Products Market Segmentation: By Product Category
- 3.9.1 Global Plant-Based Dairy Products Market, By Product Category Overview
- 3.9.2 Global Plant-Based Dairy Products Market Size, By Milk, By Value, 2019H-2029F (USD Million & CAGR)
- 3.9.3 Global Plant-Based Dairy Products Market Size, By Desserts, By Value, 2019H-2029F (USD Million & CAGR)
- 3.9.4 Global Plant Based Dairy Products Market Size, By Cream, By Value, 2019H-2029F (USD Million & CAGR)
- 3.9.5 Global Plant Based Dairy Products Market Size, By Cheese, By Value, 2019H-2029F (USD Million & CAGR)
- 3.9.6 Global Plant Based Dairy Products Market Size, By Others, By Value, 2019H-2029F (USD Million & CAGR)
- 3.10 Global Plant Based Dairy Products Market Segmentation: By Distribution Channel
- 3.10.1 Global Plant Based Dairy Products Market, By Distribution Channel Overview
- 3.10.2 Global Plant Based Dairy Products Market Size, By Online/E-commerce , By Value, 2019H-2029F (USD Million & CAGR)
- 3.10.3 Global Plant Based Dairy Products Market Size, By Offline, By Value, 2019H-2029F (USD Million & CAGR)
4. Global Plant Based Dairy Products Market, Regional Analysis
- 4.1 Regional Coverage of the Study
- 4.2 Regional Snapshot
5. North America Plant Based Dairy Products Market: Historic and Forecast (2019-2029)
- 5.1 North America Plant Based Dairy Products Market: Snapshot
- 5.2 North America Plant Based Dairy Products Market: Market Size and CAGR, 2019-2029 (USD Million & CAGR)
- 5.3 North America Plant Based Dairy Products Market: Key Factors
- 5.4 North America Plant Based Dairy Products Market Segmentation: By Product Category
- 5.4.1 North America Plant Based Dairy Products Market, By Product Category Overview
- 5.4.2 North America Plant Based Dairy Products Market Size, By Milk, By Value, 2019H-2029F (USD Million & CAGR)
- 5.4.3 North America Plant Based Dairy Products Market Size, By Desserts, By Value, 2019H-2029F (USD Million & CAGR)
- 5.4.4 North America Plant Based Dairy Products Market Size, By Cream, By Value, 2019H-2029F (USD Million & CAGR)
- 5.4.5 North America Plant Based Dairy Products Market Size, By Cheese, By Value, 2019H-2029F (USD Million & CAGR)
- 5.4.6 North America Plant Based Dairy Products Market Size, By Others, By Value, 2019H-2029F (USD Million & CAGR)
- 5.5 North America Plant Based Dairy Products Market Segmentation: By Distribution Channel
- 5.5.1 North America Plant Based Dairy Products Market, By Distribution Channel Overview
- 5.5.2 North America Plant Based Dairy Products Market Size, By Online/E-commerce, By Value, 2019H-2029F (USD Million & CAGR)
- 5.5.3 North America Plant Based Dairy Products Market Size, By Offline, By Value, 2019H-2029F (USD Million & CAGR)
- 5.6 North America Plant Based Dairy Products Market Segmentation: By Country
- 5.6.1 United States Plant Based Dairy Products Market: Market Size and CAGR, 2019-2029 (USD Million & CAGR)
- 5.6.1.1 United States Plant Based Dairy Products Market, By Product Category
- 5.6.1.2 United States Plant Based Dairy Products Market, By Distribution Channel
- 5.6.2 Canada Plant Based Dairy Products Market: Market Size and CAGR, 2019-2029 (USD Million & CAGR)
- 5.6.2.1 Canada Plant Based Dairy Products Market, By Product Category
- 5.6.2.2 Canada Plant Based Dairy Products Market, By Distribution Channel
- 5.6.1 United States Plant Based Dairy Products Market: Market Size and CAGR, 2019-2029 (USD Million & CAGR)
6. Europe Plant Based Dairy Products Market: Historic and Forecast (2019-2029)
- 6.1 Europe Plant Based Dairy Products Market: Snapshot
- 6.2 Europe Plant Based Dairy Products Market: Market Size and CAGR, 2019-2029 (USD Million & CAGR)
- 6.3 Europe Plant Based Dairy Products Market: Key Factors
- 6.4 Europe Plant Based Dairy Products Market Segmentation: By Product Category
- 6.4.1 Europe Plant Based Dairy Products Market, By Product Category Overview
- 6.4.2 Europe Plant Based Dairy Products Market Size, By Milk, By Value, 2019H-2029F (USD Million & CAGR)
- 6.4.3 Europe Plant Based Dairy Products Market Size, By Desserts, By Value, 2019H-2029F (USD Million & CAGR)
- 6.4.4 Europe Plant Based Dairy Products Market Size, By Cream, By Value, 2019H-2029F (USD Million & CAGR)
- 6.4.5 Europe Plant Based Dairy Products Market Size, By Cheese, By Value, 2019H-2029F (USD Million & CAGR)
- 6.4.6 Europe Plant Based Dairy Products Market Size, By Others, By Value, 2019H-2029F (USD Million & CAGR)
- 6.5 Europe Plant Based Dairy Products Market Segmentation: By Distribution Channel
- 6.5.1 Europe Plant Based Dairy Products Market, By Distribution Channel Overview
- 6.5.2 Europe Plant Based Dairy Products Market Size, By Online/E-commerce, By Value, 2019H-2029F (USD Million & CAGR)
- 6.5.3 Europe Plant Based Dairy Products Market Size, By Offline, By Value, 2019H-2029F (USD Million & CAGR)
- 6.6 Europe Plant Based Dairy Products Market Segmentation: By Country
- 6.6.1 UK Plant Based Dairy Products Market: Market Size and CAGR, 2019-2029 (USD Million & CAGR)
- 6.6.1.1 United Kingdom Plant Based Dairy Products Market, By Product Category
- 6.6.1.2 United Kingdom Plant Based Dairy Products Market, By Distribution Channel
- 6.6.2 France Plant Based Dairy Products Market: Market Size and CAGR, 2019-2029 (USD Million & CAGR)
- 6.6.2.1 France Plant Based Dairy Products Market, By Product Category
- 6.6.2.2 France Plant Based Dairy Products Market, By Distribution Channel
- 6.6.3 Germany Plant Based Dairy Products Market: Market Size and CAGR, 2019-2029 (USD Million & CAGR)
- 6.6.3.1 Germany Plant Based Dairy Products Market, By Product Category
- 6.6.3.2 Germany Plant Based Dairy Products Market, By Distribution Channel
- 6.6.4 Italy Plant Based Dairy Products Market: Market Size and CAGR, 2019-2029 (USD Million & CAGR)
- 6.6.4.1 Italy Plant Based Dairy Products Market, By Product Category
- 6.6.4.2 Italy Plant Based Dairy Products Market, By Distribution Channel
- 6.6.5 Rest of Europe Plant Based Dairy Products Market: Market Size and CAGR, 2019-2029 (USD Million & CAGR)
- 6.6.5.1 Rest of Europe Plant Based Dairy Products Market, By Product Category
- 6.6.5.2 Rest of Europe Plant Based Dairy Products Market, By Distribution Channel
- 6.6.1 UK Plant Based Dairy Products Market: Market Size and CAGR, 2019-2029 (USD Million & CAGR)
7. Asia Pacific Plant-Based Dairy Products Market: Historic and Forecast (2019-2029)
- 7.1 Asia Pacific Plant Based Dairy Products Market: Snapshot
- 7.2 Asia Pacific Plant Based Dairy Products Market: Market Size and CAGR, 2019-2029 (USD Million & CAGR)
- 7.3 Asia Pacific Plant Based Dairy Products Market: Key Factors
- 7.4 Asia Pacific Plant Based Dairy Products Market Segmentation: By Product Category
- 7.5 Asia Pacific Plant Based Dairy Products Market: Market Size and CAGR, 2019-2029 (USD Million & CAGR)
- 7.6 Asia Pacific Plant Based Dairy Products Market: Key Factors
- 7.7 Asia Pacific Plant Based Dairy Products Market Segmentation: By Product Category
- 7.7.1 Europe Plant Based Dairy Products Market, By Product Category Overview
- 7.7.2 Europe Plant Based Dairy Products Market Size, By Milk, By Value, 2019H-2029F (USD Million & CAGR)
- 7.7.3 Europe Plant Based Dairy Products Market Size, By Desserts, By Value, 2019H-2029F (USD Million & CAGR)
- 7.7.4 Europe Plant Based Dairy Products Market Size, By Cream, By Value, 2019H-2029F (USD Million & CAGR)
- 7.7.5 Europe Plant Based Dairy Products Market Size, By Cheese, By Value, 2019H-2029F (USD Million & CAGR)
- 7.7.6 Europe Plant Based Dairy Products Market Size, By Others, By Value, 2019H-2029F (USD Million & CAGR)
- 7.8 Asia Pacific Plant Based Dairy Products Market Segmentation: By Distribution Channel
- 7.8.1 Asia Pacific Plant Based Dairy Products Market, By Distribution Channel Overview
- 7.8.2 Asia Pacific Plant Based Dairy Products Market Size, By Online/E-commerce, By Value, 2019H-2029F (USD Million & CAGR)
- 7.8.3 Asia Pacific Plant Based Dairy Products Market Size, By Offline, By Value, 2019H-2029F (USD Million & CAGR)
- 7.9 Asia Pacific Plant Based Dairy Products Market: Market Size and CAGR, 2019-2029 (USD Million & CAGR)
- 7.9.1 China Plant Based Dairy Products Market: Market Size and CAGR, 2019-2029 (USD Million & CAGR)
- 7.9.1.1 China Plant Based Dairy Products Market, By Product Category
- 7.9.1.2 China Plant Based Dairy Products Market, By Distribution Channel
- 7.9.2 Japan Plant Based Dairy Products Market: Market Size and CAGR, 2019-2029 (USD Million & CAGR)
- 7.9.2.1 Japan Plant Based Dairy Products Market, By Product Category
- 7.9.2.2 Japan Plant Based Dairy Products Market, By Distribution Channel
- 7.9.3 India Plant Based Dairy Products Market: Market Size and CAGR, 2019-2029 (USD Million & CAGR)
- 7.9.3.1 India Plant Based Dairy Products Market, By Product Category
- 7.9.3.2 India Plant Based Dairy Products Market, By Distribution Channel
- 7.9.4 South Korea Plant Based Dairy Products Market: Market Size and CAGR, 2019-2029 (USD Million & CAGR)
- 7.9.4.1 South Korea Plant Based Dairy Products Market, By Product Category
- 7.9.4.2 South Korea Plant Based Dairy Products Market, By Distribution Channel
- 7.9.5 Rest of Asia Pacific Plant Based Dairy Products Market: Market Size and CAGR, 2019-2029 (USD Million & CAGR)
- 7.9.5.1 Rest of Asia Pacific Plant Based Dairy Products Market, By Product Category
- 7.9.5.2 Rest of Asia Pacific Plant Based Dairy Products Market, By Distribution Channel
- 7.9.1 China Plant Based Dairy Products Market: Market Size and CAGR, 2019-2029 (USD Million & CAGR)
8. Rest of the World Plant Based Dairy Products Market: Historic and Forecast
- 8.1 Rest of the World Plant Based Dairy Products Market: Snapshot
- 8.2 Rest of the World Plant Based Dairy Products Market: Market Size and CAGR, 2019-2029 (USD Million & CAGR)
- 8.3 Rest of the World Plant Based Dairy Products Market Segmentation: By Product Category
- 8.3.1 Rest of the World Plant Based Dairy Products Market, By Product Category Overview
- 8.3.2 Rest of the World Hostel OTA Market Size, By Milk, By Value, 2019H-2029F (USD Million & CAGR)
- 8.3.3 Rest of the World Hostel OTA Market Size, By Desserts, By Value, 2019H-2029F (USD Million & CAGR)
- 8.3.4 Rest of the World Hostel OTA Market Size, By Cream, By Value, 2019H-2029F (USD Million & CAGR)
- 8.3.5 Rest of the World Hostel OTA Market Size, By Cheese, By Value, 2019H-2029F (USD Million & CAGR)
- 8.3.6 Rest of the World Hostel OTA Market Size, By Others, By Value, 2019H-2029F (USD Million & CAGR)
- 8.4 Rest of the World Plant Based Dairy Products Market Segmentation: By Distribution Channel
- 8.4.1 Rest of the World Plant Based Dairy Products Market, By Distribution Channel Overview
- 8.4.2 Rest of the World Hostel OTA Market Size, By Online/E-commerce , By Value, 2019H-2029F (USD Million & CAGR)
- 8.4.3 Rest of the World Hostel OTA Market Size, By Offline, By Value, 2019H-2029F (USD Million & CAGR)
9. Market Dynamics
- 9.1 Impact Assessment of Market Dynamics on Global Plant-Based Dairy Products Market
- 9.2 Drivers
- 9.3 Restraints
- 9.4 Trends
10. Industry Ecosystem Analysis
- 10.1 Value Chain Analysis
- 10.2 SWOT Analysis
11. Competitive Landscape
- 11.1 Competitive Positioning
- 11.2 Prominent Companies Market Share
- 11.3 Company Profiles
- 11.3.1 Danone S.A.
- 11.3.2 Nestle S.A.
- 11.3.3 Natura Foods
- 11.3.4 Oatly Group AB
- 11.3.5 Unilever PLC
- 11.3.6 Epigamia
- 11.3.7 Earth's Own Food Company, Inc.
- 11.3.8 Koninklijke DSM N.V.
- 11.3.9 Plamil Foods Ltd.
- 11.3.10 Sunrise Soya Foods
