|
|
市場調査レポート
商品コード
1283958
ヤギ乳製品の世界市場(2023年版)、金額と数量と価格の分析:製品タイプ別、製品形態別、最終用途産業別、市場の考察と予測(2018年~2028年)Goat Milk Products Market (2023 Edition): Analysis By Value, Volume and Pricing, By Product Type (Cheese, Butter, Yogurt, Others), Product Form, End Use Industry: Market Insights and Forecast (2018-2028) |
||||||
|
|
|||||||
|
|||||||


| ヤギ乳製品の世界市場(2023年版)、金額と数量と価格の分析:製品タイプ別、製品形態別、最終用途産業別、市場の考察と予測(2018年~2028年) |
|
出版日: 2023年06月01日
発行: Azoth Analytics
ページ情報: 英文 250 Pages
納期: 即納可能
|

- 全表示
- 概要
- 図表
- 目次
世界のヤギ乳製品の市場規模は、2022年の117億8,000万米ドルから2028年末までに175億米ドルに達し、2024年~2028年にCAGRで7.09%の成長が予測されています。ヘルスケアに対する意識の高まりや、都市化の進行が、市場を牽引しています。
当レポートでは、世界のヤギ乳製品市場について調査分析し、市場規模と予測、地域とセグメントの分析、業界の動向などを提供しています。
目次
第1章 市場の背景
- 範囲と製品の見通し
- エグゼクティブサマリー
- 調査手法
第2章 戦略的推奨事項
第3章 世界のヤギ乳製品市場:実績と予測(2018年~2028年)
- ヤギ乳製品市場に対するマクロ経済要因の影響の分析
- ヤギ乳製品の輸入量:国別(2021年)
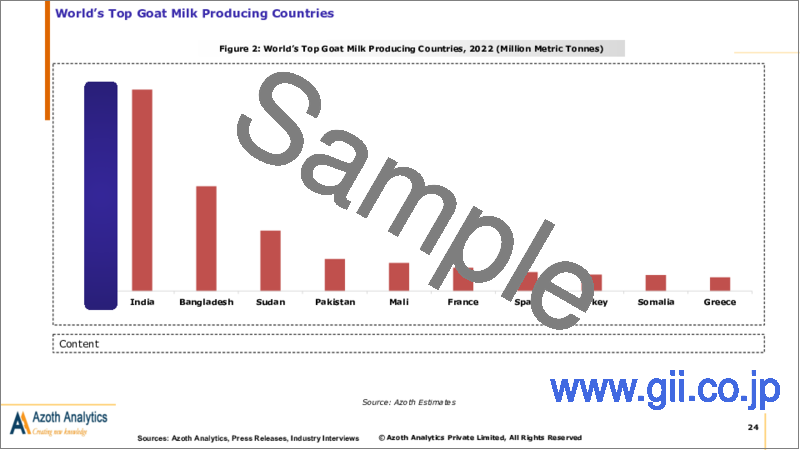
- 世界の上位ヤギ乳生産国(2022年)
- 世界のヤギ乳製品市場:ダッシュボード
- 世界のヤギ乳製品市場:市場規模とCAGR(2018年~2028年)
- 世界のヤギ乳製品市場:市場規模とCAGR(2018年~2028年)
- ヤギ乳製品の平均販売価格の評価
- ヤギ乳製品市場に対するCOVID-19の影響
- 世界のヤギ乳製品市場セグメンテーション:製品タイプ別
- 世界のヤギ乳製品市場:製品タイプ別の概要
- 世界のヤギ乳製品の市場規模:チーズ別(金額)(2018年~2028年)
- 世界のヤギ乳製品の市場規模:バター別(金額)(2018年~2028年)
- 世界のヤギ乳製品の市場規模:ヨーグルト別(金額)(2018年~2028年)
- 世界のヤギ乳製品の市場規模:その他の製品別(金額)(2018年~2028年)
- 世界のヤギ乳製品市場セグメンテーション:製品形態別
- 世界のヤギ乳製品市場:製品形態別の概要
- 世界のヤギ乳製品の市場規模:液体製品別(金額)(2018年~2028年)
- 世界のヤギ乳製品の市場規模:発酵製品別(金額)(2018年~2028年)
- 世界のヤギ乳製品の市場規模:冷凍製品別(金額)(2018年~2028年)
- 世界のヤギ乳製品市場セグメンテーション:最終用途産業別
- 世界のヤギ乳製品市場:最終用途産業別の概要
- 世界のヤギ乳製品の市場規模:商業別(金額)(2018年~2028年)
- 世界のヤギ乳製品の市場規模:個人別(金額)(2018年~2028年)
第4章 世界のヤギ乳製品市場、地域分析
- 研究の地域の範囲
- 地域のスナップショット
第5章 南北アメリカのヤギ乳製品市場:実績と予測(2018年~2028年)
- 南北アメリカのヤギ乳製品市場:スナップショット
- 南北アメリカのヤギ乳製品市場:市場規模とCAGR(2018年~2028年)
- 南北アメリカのヤギ乳製品市場:市場規模とCAGR(2018年~2028年)
- ヤギ乳製品の平均販売価格の評価
- 南北アメリカのヤギ乳製品市場:主な要因
- 南北アメリカのヤギ乳製品市場セグメンテーション:製品タイプ別
- 南北アメリカのヤギ乳製品市場:製品タイプ別の概要
- 南北アメリカのヤギ乳製品の市場規模:チーズ別(金額)(2018年~2028年)
- 南北アメリカのヤギ乳製品の市場規模:バター別(金額)(2018年~2028年)
- 南北アメリカのヤギ乳製品の市場規模:ヨーグルト別(金額)(2018年~2028年)
- 南北アメリカのヤギ乳製品の市場規模:その他の製品別(金額)(2018年~2028年)
- 南北アメリカのヤギ乳製品市場セグメンテーション:製品形態別
- 南北アメリカのヤギ乳製品市場:製品形態別の概要
- 南北アメリカのヤギ乳製品の市場規模:液体製品別(金額)(2018年~2028年)
- 南北アメリカのヤギ乳製品の市場規模:発酵製品別(金額)(2018年~2028年)
- 南北アメリカのヤギ乳製品の市場規模:冷凍製品別(金額)(2018年~2028年)
- 南北アメリカのヤギ乳製品市場セグメンテーション:最終用途産業別
- 南北アメリカのヤギ乳製品市場:最終用途産業別の概要
- 南北アメリカのヤギ乳製品の市場規模:商業別(金額)(2018年~2028年)
- 南北アメリカのヤギ乳製品の市場規模:個人別(金額)(2018年~2028年)
- 南北アメリカのヤギ乳製品市場セグメンテーション:国別
- 米国のヤギ乳製品市場:市場規模とCAGR(2018年~2028年)
- カナダのヤギ乳製品市場:市場規模とCAGR(2018年~2028年)
- ブラジルのヤギ乳製品市場:市場規模とCAGR(2018年~2028年)
- その他の南北アメリカのヤギ乳製品市場:市場規模とCAGR(2018年~2028年)
第6章 欧州のヤギ乳製品市場:実績と予測(2018年~2028年)
- 欧州のヤギ乳製品市場:スナップショット
- 欧州のヤギ乳製品市場:市場規模とCAGR(2018年~2028年)
- 欧州のヤギ乳製品市場:市場規模とCAGR(2018年~2028年)
- ヤギ乳製品の平均販売価格の評価
- 欧州のヤギ乳製品市場:主な要因
- 欧州のヤギ乳製品市場セグメンテーション:製品タイプ別
- 欧州のヤギ乳製品市場:製品タイプ別の概要
- 欧州のヤギ乳製品の市場規模:チーズ別(金額)(2018年~2028年)
- 欧州のヤギ乳製品の市場規模:バター別(金額)(2018年~2028年)
- 欧州のヤギ乳製品の市場規模:ヨーグルト別(金額)(2018年~2028年)
- 欧州のヤギ乳製品市場セグメンテーション:製品形態別
- 欧州のヤギ乳製品市場:製品形態別の概要
- 欧州のヤギ乳製品の市場規模:液体製品別(金額)(2018年~2028年)
- 欧州のヤギ乳製品の市場規模:発酵製品別(金額)(2018年~2028年)
- 欧州のヤギ乳製品の市場規模:冷凍製品別(金額)(2018年~2028年)
- 欧州のヤギ乳製品市場セグメンテーション:最終用途産業別
- 欧州のヤギ乳製品市場:最終用途産業別の概要
- 欧州のヤギ乳製品の市場規模:商業別(金額)(2018年~2028年)
- 欧州のヤギ乳製品の市場規模:個人別(金額)(2018年~2028年)
- 欧州のヤギ乳製品市場セグメンテーション:国別
- 英国のヤギ乳製品市場:市場規模とCAGR(2018年~2028年)
- ドイツのヤギ乳製品市場:市場規模とCAGR(2018年~2028年)
- フランスのヤギ乳製品市場:市場規模とCAGR(2018年~2028年)
- その他の欧州のヤギ乳製品市場:市場規模とCAGR(2018年~2028年)
第7章 アジア太平洋のヤギ乳製品市場:実績と予測(2018年~2028年)
- アジア太平洋のヤギ乳製品市場:スナップショット
- アジア太平洋のヤギ乳製品市場:市場規模とCAGR(2018年~2028年)
- アジア太平洋のヤギ乳製品市場:市場規模とCAGR(2018年~2028年)
- ヤギ乳製品の平均販売価格の評価
- アジア太平洋のヤギ乳製品市場:主な要因
- アジア太平洋のヤギ乳製品市場セグメンテーション:製品タイプ別
- アジア太平洋のヤギ乳製品市場:製品タイプ別の概要
- アジア太平洋のヤギ乳製品の市場規模:チーズ別(金額)(2018年~2028年)
- アジア太平洋のヤギ乳製品の市場規模:バター別(金額)(2018年~2028年)
- アジア太平洋のヤギ乳製品の市場規模:ヨーグルト別(金額)(2018年~2028年)
- アジア太平洋のヤギ乳製品の市場規模:その他の製品別(金額)(2018年~2028年)
- アジア太平洋のヤギ乳製品市場セグメンテーション:製品形態別
- アジア太平洋のヤギ乳製品市場:製品形態別の概要
- アジア太平洋のヤギ乳製品の市場規模:液体製品別(金額)(2018年~2028年)
- アジア太平洋のヤギ乳製品の市場規模:発酵製品別(金額)(2018年~2028年)
- アジア太平洋のヤギ乳製品の市場規模:冷凍製品別(金額)(2018年~2028年)
- アジア太平洋のヤギ乳製品市場セグメンテーション:最終用途産業別
- アジア太平洋のヤギ乳製品市場:最終用途産業別の概要
- アジア太平洋のヤギ乳製品の市場規模:商業別(金額)(2018年~2028年)
- アジア太平洋のヤギ乳製品の市場規模:個人別(金額)(2018年~2028年)
- アジア太平洋のヤギ乳製品市場セグメンテーション:国別
- 中国のヤギ乳製品市場:市場規模とCAGR(2018年~2028年)
- インドのヤギ乳製品市場:市場規模とCAGR(2018年~2028年)
- 日本のヤギ乳製品市場:市場規模とCAGR(2018年~2028年)
- 韓国のヤギ乳製品市場:市場規模とCAGR(2018年~2028年)
- その他のアジア太平洋のヤギ乳製品市場:市場規模とCAGR(2018年~2028年)
第8章 中東・アフリカのヤギ乳製品市場:実績と予測(2018年~2028年)
- 中東・アフリカのヤギ乳製品市場:スナップショット
- 中東・アフリカのヤギ乳製品市場:市場規模とCAGR(2018年~2028年)
- 中東・アフリカのヤギ乳製品市場:市場規模とCAGR(2018年~2028年)
- ヤギ乳製品の平均販売価格の評価
- 中東・アフリカのヤギ乳製品市場:主な要因
- 中東・アフリカのヤギ乳製品市場セグメンテーション:製品タイプ別
- 中東・アフリカのヤギ乳製品市場:製品タイプ別の概要
- 中東・アフリカのヤギ乳製品の市場規模:チーズ別(金額)(2018年~2028年)
- 中東・アフリカのヤギ乳製品の市場規模:バター別(金額)(2018年~2028年)
- 中東・アフリカのヤギ乳製品の市場規模:ヨーグルト別(金額)(2018年~2028年)
- 中東・アフリカのヤギ乳製品の市場規模:その他の製品別(金額)(2018年~2028年)
- 中東・アフリカのヤギ乳製品市場セグメンテーション:製品形態別
- 中東・アフリカのヤギ乳製品市場:製品形態別の概要
- 中東・アフリカのヤギ乳製品の市場規模:液体製品別(金額)(2018年~2028年)
- 中東・アフリカのヤギ乳製品の市場規模:発酵製品別(金額)(2018年~2028年)
- 中東・アフリカのヤギ乳製品の市場規模:冷凍製品別(金額)(2018年~2028年)
- 中東・アフリカのヤギ乳製品市場セグメンテーション:最終用途産業別
- 中東・アフリカのヤギ乳製品市場:最終用途産業別の概要
- 中東・アフリカのヤギ乳製品の市場規模:商業別(金額)(2018年~2028年)
- 中東・アフリカのヤギ乳製品の市場規模:個人別(金額)(2018年~2028年)
第9章 市場力学
- 世界のヤギ乳製品市場に対する市場力学の影響の評価
- 促進要因
- 抑制要因
- 動向
第10章 業界エコシステム分析
- マクロ経済要因の評価
- バリューチェーン分析
- ポーターのファイブフォース分析
第11章 競合ポジショニング
- 企業の製品ポジショニング
- 市場ポジションマトリックス
- ヤギ乳製品市場の市場シェア分析
- 企業プロファイル
- Ausnutria Dairy Corp. Ltd.
- Goat Partners International Inc.
- Emmi AG
- Holle Baby Food AG
- St. Helen's Farm
- Hewitt's Dairy
- Woolwich Dairy Inc.
- Granarolo S.P.A.
- Meyenberg Goat Milk
- Redwood Hill Farm & Creamery
List of Figures
List of Figures
- Figure 1: Goat Milk Product Imports by Country, 2021
- Figure 2: World's Top Goat Milk Producing Countries, 2022 (Million Metric Tonnes)
- Figure 3: Global Goat Milk Products Market Size, By Value, 2018-2022 (USD Million)
- Figure 4: Global Goat Milk Products Market Size, By Value, 2024-2028 (USD Million)
- Figure 5: Global Goat Milk Products Market Share, By Product Type, 2022 (%)
- Figure 6: Global Goat Milk Products Market Size, By Volume, 2018-2022 (000' Tonnes)
- Figure 7: Global Goat Milk Products Market Size, By Volume, 2023-2028 (000' Tonnes)
- Figure 8: Global Goat Milk Products Market Share, By Product Type, 2022 (%)
- Figure 9: Price of Goat Milk Products Globally, 2018H-2028F (Per KG)
- Figure 10: Price of Goat Milk Products Globally, By Type, 2018H-2028F (Per KG)
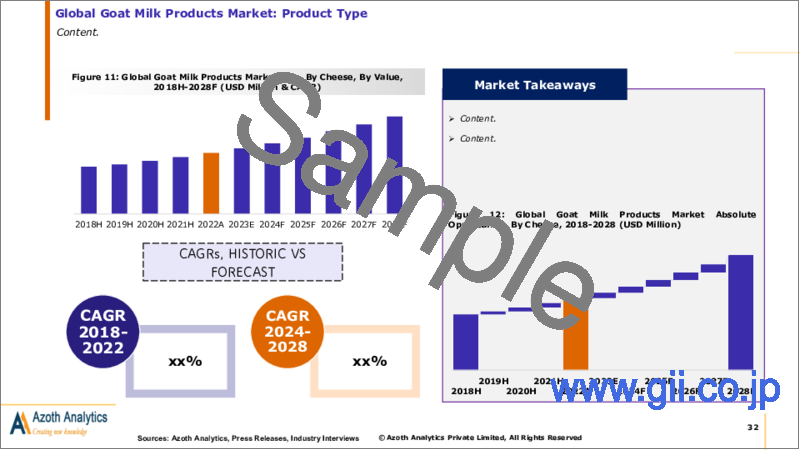
- Figure 11: Global Goat Milk Products Market Size, By Cheese, By Value, 2018H-2028F (USD Million & CAGR)
- Figure 12: Global Goat Milk Products Market Absolute Opportunity, By Cheese, 2018-2028 (USD Million)
- Figure 13: Global Goat Milk Products Market Size, By Butter, By Value, 2018H-2028F (USD Million & CAGR)
- Figure 14: Global Goat Milk Products Market Absolute Opportunity, By Butter, 2018-2028 (USD Million)
- Figure 15: Global Goat Milk Products Market Size, By Yoghurt, By Value, 2018H-2028F (USD Million & CAGR)
- Figure 16: Global Goat Milk Products Market Absolute Opportunity, By Yoghurt, 2018-2028 (USD Million)
- Figure 17: Global Goat Milk Products Market Size, By Other Products, By Value, 2018H-2028F (USD Million & CAGR)
- Figure 18: Global Goat Milk Products Market Absolute Opportunity, By Other Products, 2018-2028 (USD Million)
- Figure 19: Global Goat Milk Products Market Size, By Fluid Products, By Value, 2018H-2028F (USD Million & CAGR)
- Figure 20: Global Goat Milk Products Market Absolute Opportunity, By Fluid Products, 2018-2028 (USD Million)
- Figure 21: Global Goat Milk Products Market Size, By Fermented Products, By Value, 2018H-2028F (USD Million & CAGR)
- Figure 22: Global Goat Milk Products Market Absolute Opportunity, By Fermented Products, 2018-2028 (USD Million)
- Figure 23: Global Goat Milk Products Market Size, By Frozen Products, By Value, 2018H-2028F (USD Million & CAGR)
- Figure 24: Global Goat Milk Products Market Absolute Opportunity, By Frozen Products, 2018-2028 (USD Million)
- Figure 25: Global Goat Milk Products Market Size, By Commercial, By Value, 2018H-2028F (USD Million & CAGR)
- Figure 26: Global Goat Milk Products Market Absolute Opportunity, By Commercial, 2018-2028 (USD Million)
- Figure 27: Global Goat Milk Products Market Size, By Individual, By Value, 2018H-2028F (USD Million & CAGR)
- Figure 28: Global Goat Milk Products Market Absolute Opportunity, By Individual, 2018-2028 (USD Million)
- Figure 29: Americas Goat Milk Products Market Size, By Value, 2018H-2028F (USD Million)
- Figure 30: Americas Goat Milk Products Market Share, By Product Type, 2022 (%)
- Figure 31: Americas Goat Milk Products Market Size, By Volume, 2018H-2028F (000' Tonnes)
- Figure 32: Americas Goat Milk Products Market Share, By Product Type, 2022 (%)
- Figure 33: Price of Goat Milk Products in Americas, 2018H-2028F (Per KG)
- Figure 34: Price of Goat Milk Products in Americas, By Type, 2018H-2028F (Per KG)
- Figure 35: Americas Goat Milk Products Market, By Cheese, By Value, 2018H-2028F (USD Million & CAGR)
- Figure 36: Americas Goat Milk Products Market, By Butter, By Value, 2018H-2028F (USD Million & CAGR)
- Figure 37: Americas Goat Milk Products Market, By Yoghurt, By Value, 2018H-2028F (USD Million & CAGR)
- Figure 38: Americas Goat Milk Products Market, By Others Products, By Value, 2018H-2028F (USD Million & CAGR)
- Figure 39: Americas Goat Milk Products Market, By Fluid Products, By Value, 2018H-2028F (USD Million & CAGR)
- Figure 40: Americas Goat Milk Products Market, By Fermented Products, By Value, 2018H-2028F (USD Million & CAGR)
- Figure 41: Americas Goat Milk Products Market, By Frozen Products, By Value, 2018H-2028F (USD Million & CAGR)
- Figure 42: Americas Goat Milk Products Market, By Commercial, By Value, 2018H-2028F (USD Million & CAGR)
- Figure 43: Americas Goat Milk Products Market, By Individual, By Value, 2018H-2028F (USD Million & CAGR)
- Figure 44: United States Goat Milk Products Market, By Value, 2018-2028 (USD Million & CAGR)
- Figure 45: United States Goat Milk Products Market Value, By Product Form, 2022 (USD Million)
- Figure 46: United States Goat Milk Products Market Share, By Product Type, By Value, 2022 (%)
- Figure 47: United States Goat Milk Products Market Share, By Product Form, By Value, 2022 (%)
- Figure 48: United States Goat Milk Products Market Share, By End Use Industry, 2022 (%)
- Figure 49: Canada Goat Milk Products Market, By Value, 2018-2028 (USD Million & CAGR)
- Figure 50: Canada Goat Milk Products Market Value, By Product Form, 2022 (USD Million)
- Figure 51: Canada Goat Milk Products Market Share, By Product Type, By Value, 2022 (%)
- Figure 52: Canada Goat Milk Products Market Share, By Product Form, By Value, 2022 (%)
- Figure 53: Canada Goat Milk Products Market Share, By End Use Industry, 2022 (%)
- Figure 54: Brazil Goat Milk Products Market, By Value, 2018-2028 (USD Million & CAGR)
- Figure 55: Brazil Goat Milk Products Market Value, By Product Form, 2022 (USD Million)
- Figure 56: Brazil Goat Milk Products Market Share, By Product Type, By Value, 2022 (%)
- Figure 57: Brazil Goat Milk Products Market Share, By Product Form, By Value, 2022 (%)
- Figure 58: Brazil Goat Milk Products Market Share, By End Use Industry, 2022 (%)
- Figure 59: Rest of Americas Goat Milk Products Market, By Value, 2018-2028 (USD Million & CAGR)
- Figure 60: Rest of Americas Goat Milk Products Market Value, By Product Form, 2022 (USD Million)
- Figure 61: Rest of Americas Goat Milk Products Market Share, By Product Type, By Value, 2022 (%)
- Figure 62: Rest of Americas Goat Milk Products Market Share, By Product Form, By Value, 2022 (%)
- Figure 63: Rest of Americas Goat Milk Products Market Share, By End Use Industry, 2022 (%)
- Figure 64: Europe Goat Milk Products Market Size, By Value, 2018H-2028F (USD Million)
- Figure 65: Europe Goat Milk Products Market Share, By Product Type, 2022 (%)
- Figure 66: Europe Goat Milk Products Market Size, By Volume, 2018H-2028F (000' Tonnes)
- Figure 67: Europe Goat Milk Products Market Share, By Product Type, 2022 (%)
- Figure 68: Price of Goat Milk Products in Europe, 2018H-2028F (Per KG)
- Figure 69: Price of Goat Milk Products in Europe, By Product Type, 2018H-2028F (Per KG)
- Figure 70: Europe Goat Milk Products Market, By Cheese, By Value, 2018H-2028F (USD Million & CAGR)
- Figure 71: Europe Goat Milk Products Market, By Butter, By Value, 2018H-2028F (USD Million & CAGR)
- Figure 72: Europe Goat Milk Products Market, By Yoghurt, By Value, 2018H-2028F (USD Million & CAGR)
- Figure 73: Europe Goat Milk Products Market, By Others, By Value, 2018H-2028F (USD Million & CAGR)
- Figure 74: Europe Goat Milk Products Market, By Fluid Products, By Value, 2018H-2028F (USD Million & CAGR)
- Figure 75: Europe Goat Milk Products Market, By Fermented Products, By Value, 2018H-2028F (USD Million & CAGR)
- Figure 76: Europe Goat Milk Products Market, By Frozen Products, By Value, 2018H-2028F (USD Million & CAGR)
- Figure 77: Europe Goat Milk Products Market, By Commercial, By Value, 2018H-2028F (USD Million & CAGR)
- Figure 78: Europe Goat Milk Products Market, By Individual, By Value, 2018H-2028F (USD Million & CAGR)
- Figure 79: United Kingdom Goat Milk Products Market, By Value, 2018-2028 (USD Million & CAGR)
- Figure 80: United Kingdom Goat Milk Products Market Value, By Product Form, 2022 (USD Million)
- Figure 81: United Kingdom Goat Milk Products Market Share, By Product Type, By Value, 2022 (%)
- Figure 82: United Kingdom Goat Milk Products Market Share, By Product Form, By Value, 2022 (%)
- Figure 83: United Kingdom Goat Milk Products Market Share, By End Use Industry, 2022 (%)
- Figure 84: Germany Goat Milk Products Market, By Value, 2018-2028 (USD Million & CAGR)
- Figure 85: Germany Goat Milk Products Market Value, By Product Form, 2022 (USD Million)
- Figure 86: Germany Goat Milk Products Market Share, By Product Type, By Value, 2022 (%)
- Figure 87: Germany Goat Milk Products Market Share, By Product Form, By Value, 2022 (%)
- Figure 88: Germany Goat Milk Products Market Share, By End Use Industry, 2022 (%)
- Figure 89: France Goat Milk Products Market, By Value, 2018-2028 (USD Million & CAGR)
- Figure 90: France Goat Milk Products Market Value, By Product Form, 2022 (USD Million)
- Figure 91: France Goat Milk Products Market Share, By Product Type, By Value, 2022 (%)
- Figure 92: France Goat Milk Products Market Share, By Product Form, By Value, 2022 (%)
- Figure 93: France Goat Milk Products Market Share, By End Use Industry, 2022 (%)
- Figure 94: Rest of Europe Goat Milk Products Market, By Value, 2018-2028 (USD Million & CAGR)
- Figure 95: Rest of Europe Goat Milk Products Market Value, By Product Form, 209122 (USD Million)
- Figure 96: Rest of Europe Goat Milk Products Market Share, By Product Type, By Value, 2022 (%)
- Figure 97: Rest of Europe Goat Milk Products Market Share, By Product Form, By Value, 2022 (%)
- Figure 98: Rest of Europe Goat Milk Products Market Share, By End Use Industry, 2022 (%)
- Figure 99: Asia Pacific Goat Milk Products Market Size, By Value, 2018H-2028F (USD Million)
- Figure 100: Asia Pacific Goat Milk Products Market Share, By Product Type, 2022 (%)
- Figure 101: Asia Pacific Goat Milk Products Market Size, By Volume, 2018H-2028F (000' Tonnes)
- Figure 102: Asia Pacific Goat Milk Products Market Share, By Product Type, 2022 (%)
- Figure 103: Price of Goat Milk Products in Asia Pacific, 2018H-2028F (Per KG)
- Figure 104: Price of Goat Milk Products in Asia Pacific, By Product Type, 2018H-2028F (Per KG)
- Figure 105: Asia Pacific Goat Milk Products Market, By Cheese, By Value, 2018H-2028F (USD Million & CAGR)
- Figure 106: Asia Pacific Goat Milk Products Market, By Butter, By Value, 2018H-2028F (USD Million & CAGR)
- Figure 107: Asia Pacific Goat Milk Products Market, By Yoghurt, By Value, 2018H-2028F (USD Million & CAGR)
- Figure 108: Asia Pacific Goat Milk Products Market, By Others, By Value, 2018H-2028F (USD Million & CAGR)
- Figure 109: Asia Pacific Goat Milk Products Market, By Fluid Products, By Value, 2018H-2028F (USD Million & CAGR)
- Figure 110: Asia Pacific Goat Milk Products Market, By Fermented Products, By Value, 2018H-2028F (USD Million & CAGR)
- Figure 111: Asia Pacific Goat Milk Products Market, By Frozen Products, By Value, 2018H-2028F (USD Million & CAGR)
- Figure 112: Asia Pacific Goat Milk Products Market, By Commercial, By Value, 2018H-2028F (USD Million & CAGR)
- Figure 113: Asia Pacific Goat Milk Products Market, By Individual, By Value, 2018H-2028F (USD Million & CAGR)
- Figure 114: China Goat Milk Products Market, By Value, 2018-2028 (USD Million & CAGR)
- Figure 115: China Goat Milk Products Market Value, By Product Form, 2022 (USD Million)
- Figure 116: China Goat Milk Products Market Share, By Product Type, By Value, 2022 (%)
- Figure 117: China Goat Milk Products Market Share, By Product Form, By Value, 2022 (%)
- Figure 118: China Goat Milk Products Market Share, By End Use Industry, 2022 (%)
- Figure 119: India Goat Milk Products Market, By Value, 2018-2028 (USD Million & CAGR)
- Figure 120: India Goat Milk Products Market Value, By Product Form, 2022 (USD Million)
- Figure 121: India Goat Milk Products Market Share, By Product Type, By Value, 2022 (%)
- Figure 122: India Goat Milk Products Market Share, By Product Form, By Value, 2022 (%)
- Figure 123: India Goat Milk Products Market Share, By End Use Industry, 2022 (%)
- Figure 124: Japan Goat Milk Products Market, By Value, 2018-2028 (USD Million & CAGR)
- Figure 125: Japan Goat Milk Products Market Value, By Product Form, 2022 (USD Million)
- Figure 126: Japan Goat Milk Products Market Share, By Product Type, By Value, 2022 (%)
- Figure 127: Japan Goat Milk Products Market Share, By Product Form, By Value, 2022 (%)
- Figure 128: Japan Goat Milk Products Market Share, By End Use Industry, 2022 (%)
- Figure 129: South Korea Pacific Goat Milk Products Market, By Value, 2018-2028 (USD Million & CAGR)
- Figure 130: South Korea Pacific Goat Milk Products Market Value, By Product Form, 2022 (USD Million)
- Figure 131: South Korea Pacific Goat Milk Products Market Share, By Product Type, By Value, 2022 (%)
- Figure 132: South Korea Pacific Goat Milk Products Market Share, By Product Form, By Value, 2022 (%)
- Figure 133: South Korea Pacific Goat Milk Products Market Share, By End Use Industry, 2022 (%)
- Figure 134: Rest of Asia Pacific Goat Milk Products Market, By Value, 2018-2028 (USD Million & CAGR)
- Figure 135: Rest of Asia Pacific Goat Milk Products Market Value, By Product Form, 2022 (USD Million)
- Figure 136: Rest of Asia Pacific Goat Milk Products Market Share, By Product Type, By Value, 2022 (%)
- Figure 137: Rest of Asia Pacific Goat Milk Products Market Share, By Product Form, By Value, 2022 (%)
- Figure 138: Rest of Asia Pacific Goat Milk Products Market Share, By End Use Industry, 2022 (%)
- Figure 139: Middle East & Africa Goat Milk Products Market Size, By Value, 2018H-2028F (USD Million)
- Figure 140: Middle East & Africa Goat Milk Products Market Share, By Product Type, 2022 (%)
- Figure 141: Middle East & Africa Goat Milk Products Market Size, By Volume, 2018H-2028F (000' Tonnes)
- Figure 142: Middle East & Africa Goat Milk Products Market Share, By Product Type, 2022 (%)
- Figure 143: Price of Goat Milk Products in Middle East & Africa, 2018H-2028F (Per KG)
- Figure 144: Price of Goat Milk Products in Middle East & Africa, By Product Type, 2018H-2028F (Per KG)
- Figure 145: Middle East & Africa Goat Milk Products Market, By Cheese, By Value, 2018H-2028F (USD Million & CAGR)
- Figure 146: Middle East & Africa Goat Milk Products Market, By Butter, By Value, 2018H-2028F (USD Million & CAGR)
- Figure 147: Middle East & Africa Goat Milk Products Market, By Yoghurt, By Value, 2018H-2028F (USD Million & CAGR)
- Figure 148: Middle East & Africa Goat Milk Products Market, By Others Products, By Value, 2018H-2028F (USD Million & CAGR)
- Figure 149: Middle East & Africa Goat Milk Products Market, By Fluid Products, By Value, 2018H-2028F (USD Million & CAGR)
- Figure 150: Middle East & Africa Goat Milk Products Market, By Fermented Products, By Value, 2018H-2028F (USD Million & CAGR)
- Figure 151: Middle East & Africa Goat Milk Products Market, By Frozen Products, By Value, 2018H-2028F (USD Million & CAGR)
- Figure 152: Middle East & Africa Goat Milk Products Market, By Commercial, By Value, 2018H-2028F (USD Million & CAGR)
- Figure 153: Middle East & Africa Goat Milk Products Market, By Individual, By Value, 2018H-2028F (USD Million & CAGR)
- Figure 154: Global Impact of Drivers and Restraints
- Figure 155: Market Share of Prominent Companies of Goat Milk Products, 2021 (%)
- Figure 156: Ausnutria Dairy Corp. Ltd. Revenues, 2020-2022 (USD Million)
- Figure 157: Ausnutria Dairy Corp. Ltd. Revenues, By Geographic Segments, 2022 (%)
- Figure 158: Ausnutria Dairy Corp. Ltd. Revenues , By Business Segments, 2022 (%)
- Figure 159: Emmi AG Revenues, 2020-2022 (USD Million)
- Figure 160: Emmi AG Revenues, By Geographic Segments, 2022 (%)
- Figure 161: Emmi AG Revenues , By Geographic Segments, 2021 (%)
List of Tables
Table A1: Global Impact of Macro Economic Factors, By Region
Table A2: United States Goat Milk Products Market, By Product Type, By Value, 2018-2022 (USD Million)
Table A3: United States Goat Milk Products Market, By Product Type, By Value, 2023-2028 (USD Million)
Table A4: United States Goat Milk Products Market, By Product Form, By Value, 2018-2022 (USD Million)
Table A5: United States Goat Milk Products Market, By Product Form, By Value, 2023-2028 (USD Million)
Table A6: United States Goat Milk Products Market, By End Use Industry, By Value, 2018-2022 (USD Million)
Table A7: United States Goat Milk Products Market, By End Use Industry, By Value, 2023-2028 (USD Million)
Table A8: Canada Goat Milk Products Market, By Product Type, By Value, 2018-2022 (USD Million)
Table A9: Canada Goat Milk Products Market, By Product Type, By Value, 2023-2028 (USD Million)
Table A10: Canada Goat Milk Products Market, By Product Form, By Value, 2018-2022 (USD Million)
Table A11: Canada Goat Milk Products Market, By Product Form, By Value, 2023-2028 (USD Million)
Table A12: Canada Goat Milk Products Market, By End Use Industry, By Value, 2018-2022 (USD Million)
Table A13: Canada Goat Milk Products Market, By End Use Industry, By Value, 2023-2028 (USD Million)
Table A14: Brazil Goat Milk Products Market, By Product Type, By Value, 2018-2022 (USD Million)
Table A15: Brazil Goat Milk Products Market, By Product Type, By Value, 2023-2028 (USD Million)
Table A16: Brazil Goat Milk Products Market, By Product Form, By Value, 2018-2022 (USD Million)
Table A17: Brazil Goat Milk Products Market, By Product Form, By Value, 2023-2028 (USD Million)
Table A18: Brazil Goat Milk Products Market, By End Use Industry, By Value, 2018-2022 (USD Million)
Table A19: Brazil Goat Milk Products Market, By End Use Industry, By Value, 2023-2028 (USD Million)
Table A20: Rest of Americas Goat Milk Products Market, By Product Type, By Value, 2018-2022 (USD Million)
Table A21: Rest of Americas Goat Milk Products Market, By Product Type, By Value, 2023-2028 (USD Million)
Table A22: Rest of Americas Goat Milk Products Market, By Product Form, By Value, 2018-2022 (USD Million)
Table A23: Rest of Americas Goat Milk Products Market, By Product Form, By Value, 2023-2028 (USD Million)
Table A24: Rest of Americas Goat Milk Products Market, By End Use Industry, By Value, 2018-2022 (USD Million)
Table A25: Rest of Americas Goat Milk Products Market, By End Use Industry, By Value, 2023-2028 (USD Million)
Table A26: United Kingdom Goat Milk Products Market, By Product Type, By Value, 2018-2022 (USD Million)
Table A27: United Kingdom Goat Milk Products Market, By Product Type, By Value, 2023-2028 (USD Million)
Table A28: United Kingdom Goat Milk Products Market, By Product Form, By Value, 2018-2022 (USD Million)
Table A29: United Kingdom Goat Milk Products Market, By Product Form, By Value, 2023-2028 (USD Million)
Table A30: United Kingdom Goat Milk Products Market, By End Use Industry, By Value, 2018-2022 (USD Million)
Table A31: United Kingdom Goat Milk Products Market, By End Use Industry, By Value, 2023-2028 (USD Million)
Table A32: Germany Goat Milk Products Market, By Product Type, By Value, 2018-2022 (USD Million)
Table A33: Germany Goat Milk Products Market, By Product Type, By Value, 2023-2028 (USD Million)
Table A34: Germany Goat Milk Products Market, By Product Form, By Value, 2018-2022 (USD Million)
Table A35: Germany Goat Milk Products Market, By Product Form, By Value, 2023-2028 (USD Million)
Table A36: Germany Goat Milk Products Market, By End Use Industry, By Value, 2018-2022 (USD Million)
Table A37: Germany Goat Milk Products Market, By End Use Industry, By Value, 2023-2028 (USD Million)
Table A38: France Goat Milk Products Market, By Product Type, By Value, 2018-2022 (USD Million)
Table A39: France Goat Milk Products Market, By Product Type, By Value, 2023-2028 (USD Million)
Table A40: France Goat Milk Products Market, By Product Form, By Value, 2018-2022 (USD Million)
Table A41: France Goat Milk Products Market, By Product Form, By Value, 2023-2028 (USD Million)
Table A42: France Goat Milk Products Market, By End Use Industry, By Value, 2018-2022 (USD Million)
Table A43: France Goat Milk Products Market, By End Use Industry, By Value, 2023-2028 (USD Million)
Table A44: Rest of Europe Goat Milk Products Market, By Product Type, By Value, 2018-2022 (USD Million)
Table A45: Rest of Europe Goat Milk Products Market, By Product Type, By Value, 2023-2028 (USD Million)
Table A46: Rest of Europe Goat Milk Products Market, By Product Form, By Value, 2018-2022 (USD Million)
Table A47: Rest of Europe Goat Milk Products Market, By Product Form, By Value, 2023-2028 (USD Million)
Table A48: Rest of Europe Goat Milk Products Market, By End Use Industry, By Value, 2018-2022 (USD Million)
Table A49: Rest of Europe Goat Milk Products Market, By End Use Industry, By Value, 2023-2028 (USD Million)
Table A50: China Goat Milk Products Market, By Product Type, By Value, 2018-2022 (USD Million)
Table A51: China Goat Milk Products Market, By Product Type, By Value, 2023-2028 (USD Million)
Table A52: China Goat Milk Products Market, By Product Form, By Value, 2018-2022 (USD Million)
Table A53: China Goat Milk Products Market, By Product Form, By Value, 2023-2028 (USD Million)
Table A54: China Goat Milk Products Market, By End Use Industry, By Value, 2018-2022 (USD Million)
Table A55: China Goat Milk Products Market, By End Use Industry, By Value, 2023-2028 (USD Million)
Table A56: India Goat Milk Products Market, By Product Type, By Value, 2018-2022 (USD Million)
Table A57: India Goat Milk Products Market, By Product Type, By Value, 2023-2028 (USD Million)
Table A58: India Goat Milk Products Market, By Product Form, By Value, 2018-2022 (USD Million)
Table A59: India Goat Milk Products Market, By Product Form, By Value, 2023-2028 (USD Million)
Table A60: India Goat Milk Products Market, By End Use Industry, By Value, 2018-2022 (USD Million)
Table A61: India Goat Milk Products Market, By End Use Industry, By Value, 2023-2028 (USD Million)
Table A62: Japan Goat Milk Products Market, By Product Type, By Value, 2018-2022 (USD Million)
Table A63: Japan Goat Milk Products Market, By Product Type, By Value, 2023-2028 (USD Million)
Table A64: Japan Goat Milk Products Market, By Product Form, By Value, 2018-2022 (USD Million)
Table A65: Japan Goat Milk Products Market, By Product Form, By Value, 2023-2028 (USD Million)
Table A66: Japan Goat Milk Products Market, By End Use Industry, By Value, 2018-2022 (USD Million)
Table A67: Japan Goat Milk Products Market, By End Use Industry, By Value, 2023-2028 (USD Million)
Table A68: South Korea Goat Milk Products Market, By Product Type, By Value, 2018-2022 (USD Million)
Table A69: South Korea Goat Milk Products Market, By Product Type, By Value, 2023-2028 (USD Million)
Table A70: South Korea Goat Milk Products Market, By Product Form, By Value, 2018-2022 (USD Million)
Table A71: South Korea Goat Milk Products Market, By Product Form, By Value, 2023-2028 (USD Million)
Table A72: South Korea Goat Milk Products Market, By End Use Industry, By Value, 2018-2022 (USD Million)
Table A73: South Korea Goat Milk Products Market, By End Use Industry, By Value, 2023-2028 (USD Million)
Table A74: Rest of Asia Pacific Goat Milk Products Market Market, By Product Type, By Value, 2018-2022 (USD Million)
Table A75: Rest of Asia Pacific Goat Milk Products Market Market, By Product Type, By Value, 2023-2028 (USD Million)
Table A76: Rest of Asia Pacific Goat Milk Products Market Market, By Product Form, By Value, 2018-2022 (USD Million)
Table A77: Rest of Asia Pacific Goat Milk Products Market Market, By Product Form, By Value, 2023-2028 (USD Million)
Table A78: Rest of Asia Pacific Goat Milk Products Market Market, By End Use Industry, By Value, 2018-2022 (USD Million)
Table A79: Rest of Asia Pacific Goat Milk Products Market Market, By End Use Industry, By Value, 2023-2028 (USD Million)
Table A80: Ausnutria Dairy Corp. Ltd. Key Financials, 2020-2022
Table A81: Emmi AG Key Financials, 2020-2022
Executive Summary
Azoth Analytics has released a research report titled "Goat Milk Products Market (2023 Edition)" which provides a complete analysis of the global Goat Milk Products industry in terms of market segmentation by Product Type (Cheese, Butter, Yogurt, Others), Product Form (Fluid Products, Fermented Products, Frozen Products) and by End Use Industry (Commercial, Individual). The report has been analyzed by region and by country for the historical period of 2018-2022, the estimated year 2023 and the forecast period of 2024-2028.
The goat milk products market has been assessed by value (USD Million) and volume (Thousand Tonnes). Also, the pricing analysis of goat milk has been done at the global and regional levels with pricing by Product Type (Cheese, Butter, Yogurt, Others). The research study also looks at the market growth indicators, restraints, supply and demand risk, and other important statistics, as well as a full assessment of current and future market trends that are relevant to the market evolution. During the forecast period, 2024-2028, the global Goat Milk Product is expected to expand at a CAGR of 7.09%. The increasing awareness about healthcare, as well as the growing urbanization, are driving up the Goat Milk Product market.
The Goat Milk Product market is expected to generate USD 17.5 billion by the end of 2028, up from USD 11.78 billion in 2022. Dairy industries, and other industries that use goat milk as their raw material had been expanding significantly, and the pandemic has made the expansion of the Dairy industry even faster. There is a significant rise in demand for the goat dairy products such as cheese, butter and milk powder as a result of an increase in population and awareness about goat milk. Increasing awareness, government support by providing subsidies, an increase in demand for additional nutritional products, the expansion of product offerings, and the demand for organic products are key drivers behind the market growth.
In the Asia Pacific region, customers are ready to pay for advanced products such as goat cheese, goat milk powder, yoghurt, skin care products, and other products. The growing concern for health has increased demand for goat milk and a variety of products, including goat milk soap. Additionally, with the growth in infections, allergies, bacterial diseases, and other skin disorders, the need for using organic, healthy, and nutritious products have been increased.
The research covers a detailed analysis of the market in Europe, the Middle East & Africa, the Americas, and Asia Pacific. Additionally, the research report presents data including market size, yearly growth & potential analysis, the competitive study of market players, investment opportunities and demand forecast. The major factor driving the growth of the goat milk product market is the increasing demand for infant milk formula. Furthermore, the rising demand for specialty products is the governing factor for infant milk formula.
The infant milk formula acts as the main source of minerals, calories and vitamins for babies. North America is one of the biggest markets for baby food and infant formula products in the region. Increasing disposable incomes, new product innovations and high birth rates are some of the main drivers for the infant milk formula in the region. Additionally, the increasing working women population, easy availability, and inability to breastfeed have also increased the demand for infant formula products. Rising awareness of the health benefits as well as expanding globalization will continue to boost the demand for goat infant milk formula in the region.
Currently, consumers have become more health conscious and prefer less processed food and natural drinks for their babies. Therefore, baby infant formula free from ingredients such as added sugar, sodium, and preservatives could bring new opportunities for manufacturers in the U.S. baby infant milk formula market. Moreover, manufacturers are focused on organic contents by removing genetically modified ingredients (GMOs), synthetic pesticides, and fertilizers in the feeds of cows, goats, and other dairy animals. Thus, the milk used in the baby infant formula is certified as organic and a shift in preference toward organic food & drink is anticipated to offer remunerative opportunities for the expansion of the goat milk formula during the forecast period.
Scope of the Report
- The report analyses the Goat Milk Products Market by Value (USD Million), Volume (Thousand Tonnes) and Pricing (USD/Kg).
- The report presents the analysis of Goat Milk Products Market for the historical period of 2018-2022, the estimated year 2023 and the forecast period of 2024-2028.
- The countries analyzed in the report include the United States, Canada, Brazil, Germany, UK, France, Italy, China, Japan and India.
- The report analyses the Goat Milk Products Market by Product Type (Cheese, Butter, Yogurt, Others).
- The report analyses the Goat Milk Products Market by product form (Fluid Products, Fermented Products, Frozen Products).
- The report analyses the Goat Milk Products Market by End Use Industry (Commercial, Individual).
- The key insights of the report have been presented through the frameworks of SWOT and Porter's Five Forces Analysis. Also, the attractiveness of the market has been presented by region, by product type, by product form, by end-use industry.
- Also, the major opportunities, trends, drivers and challenges of the industry have been analysed in the report.
- The report tracks competitive developments, strategies, mergers and acquisitions and new product development. The companies analysed in the report include Ausnutria Dairy Corp. Ltd., Goat Partners International Inc., Emmi AG, Holle Baby Food AG, St. Helen's Farm, Hewitt's Dairy, Woolwich Dairy Inc., Granarolo S.P.A., Meyenberg Goat Milk, and Redwood Hill Farm & Creamery.
Table of Contents
1. Market Background
- 1.1 Scope and Product Outlook
- 1.2 Executive Summary
- 1.3 Research Methodology
2. Strategic Recommendations
3. Global Goat Milk Products Market: Historic and Forecast (2018-2028)
- 3.1 Impact Analysis of Macro Economic Factors on the Goat Milk Products Market
- 3.2 Goat Milk Product Imports by Country, 2021
- 3.3 World's Top Goat Milk Producing Countries, 2022 (Million Metric Tonnes)
- 3.4 Global Goat Milk Products Market: Dashboard
- 3.5 Global Goat Milk Products Market: Market Size and CAGR, 2018-2028 (USD Million & CAGR)
- 3.6 Global Goat Milk Products Market: Market Volume and CAGR, 2018-2028 (000' Tonnes)
- 3.7 Average Selling Price Assessment of Goat Milk Products
- 3.8 Impact of COVID-19 on Goat Milk Products MarketFX
- 3.9 Global Goat Milk Products Market Segmentation: By Product Type
- 3.9.1 Global Goat Milk Products Market, By Product Type Overview
- 3.9.2 Global Goat Milk Products Market Size, By Cheese, By Value, 2018H-2028F (USD Million & CAGR)
- 3.9.3 Global Goat Milk Products Market Size, By Butter, By Value, 2018H-2028F (USD Million & CAGR)
- 3.9.4 Global Goat Milk Products Market Size, By Yoghurt, By Value, 2018H-2028F (USD Million & CAGR)
- 3.9.5 Global Goat Milk Products Market Size, By Other Products, By Value, 2018H-2028F (USD Million & CAGR)
- 3.10 Global Goat Milk Products Market Segmentation: By Product Form
- 3.10.1 Global Goat Milk Products Market, By Product Form Overview
- 3.10.2 Global Goat Milk Products Market Size, By Fluid Products, By Value, 2018H-2028F (USD Million & CAGR)
- 3.10.3 Global Goat Milk Products Market Size, By Fermented Products, By Value, 2018H-2028F (USD Million & CAGR)
- 3.10.4 Global Goat Milk Products Market Size, By Frozen Products, By Value, 2018H-2028F (USD Million & CAGR)
- 3.11 Global Goat Milk Products Market Segmentation: By End Use Industry
- 3.11.1 Global Goat Milk Products Market, By End Use Industry Overview
- 3.11.2 Global Goat Milk Products Market Size, By Commercial, By Value, 2018H-2028F (USD Million & CAGR)
- 3.11.3 Global Goat Milk Products Market Size, By Individual, By Value, 2018H-2028F (USD Million & CAGR)
4. Global Goat Milk Products Market, Regional Analysis
- 4.1 Regional Coverage of the Study
- 4.2 Regional Snapshot
5. Americas Goat Milk Products Market: Historic and Forecast (2018-2028)
- 5.1 Americas Goat Milk Products Market: Snapshot
- 5.2 Americas Goat Milk Products Market: Market Size and CAGR, 2018-2028 (USD Million & CAGR)
- 5.3 Americas Goat Milk Products Market: Market Size and CAGR, 2018-2028 (000' Tonnes)
- 5.4 Average Selling Price Assessment of Goat Milk Products
- 5.5 Americas Goat Milk Products Market: Key Factors
- 5.6 Americas Goat Milk Products Market Segmentation: By Product Type
- 5.6.1 Americas Goat Milk Products Market, By Product Type Overview
- 5.6.2 Americas Goat Milk Products Market Size, By Cheese, By Value, 2018H-2028F (USD Million & CAGR)
- 5.6.3 Americas Goat Milk Products Market Size, By Butter, By Value, 2018H-2028F (USD Million & CAGR)
- 5.6.4 Americas Goat Milk Products Market Size, By Yoghurt, By Value, 2018H-2028F (USD Million & CAGR)
- 5.6.5 Americas Goat Milk Products Market Size, By Other Products, By Value, 2018H-2028F (USD Million & CAGR)
- 5.7 Americas Goat Milk Products Market Segmentation: By Product Form
- 5.7.1 Americas Goat Milk Products Market, By Product Form Overview
- 5.7.2 Americas Goat Milk Products Market Size, By Fluid Products, By Value, 2018H-2028F (USD Million & CAGR)
- 5.7.3 Americas Goat Milk Products Market Size, By Fermented Products, By Value, 2018H-2028F (USD Million & CAGR)
- 5.7.4 Americas Goat Milk Products Market Size, By Frozen Products, By Value, 2018H-2028F (USD Million & CAGR)
- 5.8 Americas Goat Milk Products Market Segmentation: By End Use Industry
- 5.8.1 Americas Goat Milk Products Market, By End Use Industry Overview
- 5.8.2 Americas Goat Milk Products Market Size, By Commercial, By Value, 2018H-2028F (USD Million & CAGR)
- 5.8.3 Americas Goat Milk Products Market Size, By Individual, By Value, 2018H-2028F (USD Million & CAGR)
- 5.9 Americas Goat Milk Products Market Segmentation: By Country
- 5.9.1 United States Goat Milk Products Market: Market Size and CAGR, 2018-2028 (USD Million & CAGR)
- 5.9.1.1 United States Goat Milk Products Market, By Product Type
- 5.9.1.2 United States Goat Milk Products Market, By Product Form
- 5.9.1.3 United States Goat Milk Products Market, By End Use Industry
- 5.9.2 Canada Goat Milk Products Market: Market Size and CAGR, 2018-2028 (USD Million & CAGR)
- 5.8.2.1 Canada Goat Milk Products Market, By Product Type
- 5.9.2.2 Canada Goat Milk Products Market, By Product Form
- 5.9.2.3 Canada Goat Milk Products Market, By End Use Industry
- 5.9.3 Brazil Goat Milk Products Market: Market Size and CAGR, 2018-2028 (USD Million & CAGR)
- 5.9.3.1 Brazil Goat Milk Products Market, By Product Type
- 5.9.3.2 Brazil Goat Milk Products Market, By Product Form
- 5.9.3.3 Brazil Goat Milk Products Market, By End Use Industry
- 5.9.4 Rest of Americas Goat Milk Products Market: Market Size and CAGR, 2018-2028 (USD Million & CAGR)
- 5.9.4.1 Rest of Americas Goat Milk Products Market, By Product Type
- 5.9.4.2 Rest of Americas Goat Milk Products Market, By Product Form
- 5.9.4.3 Rest of Americas Goat Milk Products Market, By End Use Industry
- 5.9.1 United States Goat Milk Products Market: Market Size and CAGR, 2018-2028 (USD Million & CAGR)
6. Europe Goat Milk Products Market: Historic and Forecast (2018-2028)
- 6.1 Europe Goat Milk Products Market: Snapshot
- 6.2 Europe Goat Milk Products Market: Market Size and CAGR, 2018-2028 (USD Million & CAGR)
- 6.3 Europe Goat Milk Products Market: Market Size and CAGR, 2018-2028 (000' Tonnes)
- 6.4 Average Selling Price Assessment of Goat Milk Products
- 6.5 Europe Goat Milk Products Market: Key Factors
- 6.6 Europe Goat Milk Products Market Segmentation: By Product Type
- 6.6.1 Europe Goat Milk Products Market, By Product Type Overview
- 6.6.2 Europe Goat Milk Products Market Size, By Cheese, By Value, 2018H-2028F (USD Million & CAGR)
- 6.6.3 Europe Goat Milk Products Market Size, By Butter, By Value, 2018H-2028F (USD Million & CAGR)
- 6.6.4 Europe Goat Milk Products Market Size, By Yoghurt, By Value, 2018H-2028F (USD Million & CAGR)
- 6.7 Europe Goat Milk Products Market Segmentation: By Product Form
- 6.7.1 Europe Goat Milk Products Market, By Product Form Overview
- 6.7.2 Europe Goat Milk Products Market Size, By Fluid Products, By Value, 2018H-2028F (USD Million & CAGR)
- 6.7.3 Europe Goat Milk Products Market Size, By Fermented Products, By Value, 2018H-2028F (USD Million & CAGR)
- 6.7.2 Europe Goat Milk Products Market Size, By Frozen Products, By Value, 2018H-2028F (USD Million & CAGR)
- 6.8 Europe Goat Milk Products Market Segmentation: By End Use Industry
- 6.8.1 Europe Goat Milk Products Market, By End Use Industry Overview
- 6.8.2 Europe Goat Milk Products Market Size, By Commercial, By Value, 2018H-2028F (USD Million & CAGR)
- 6.8.3 Europe Goat Milk Products Market Size, By Individual, By Value, 2018H-2028F (USD Million & CAGR)
- 6.9 Europe Goat Milk Products Market Segmentation: By Country
- 6.9.1 United Kingdom Goat Milk Products Market: Market Size and CAGR, 2018-2028 (USD Million & CAGR)
- 6.9.1.1 United Kingdom Goat Milk Products Market, By Product Type
- 6.9.1.2 United Kingdom Goat Milk Products Market, By Product Form
- 6.9.1.3 United Kingdom Goat Milk Products Market, By End Use Industry
- 6.9.2 Germany Goat Milk Products Market: Market Size and CAGR, 2018-2028 (USD Million & CAGR)
- 6.9.2.1 Germany Goat Milk Products Market, By Product Type
- 6.9.2.3 Germany Goat Milk Products Market, By Product Form
- 6.9.2.4 Germany Goat Milk Products Market, By End Use Industry
- 6.9.3 France Goat Milk Products Market: Market Size and CAGR, 2018-2028 (USD Million & CAGR)
- 6.7.3.1 France Goat Milk Products Market, By Product Type
- 6.7.3.2 France Goat Milk Products Market, By Product Form
- 6.7.3.3 France Goat Milk Products Market, By End Use Industry
- 6.9.4 Rest of Europe Goat Milk Products Market: Market Size and CAGR, 2018-2028 (USD Million & CAGR)
- 6.9.4.1 Rest of Europe Goat Milk Products Market, By Product Type
- 6.9.4.2 Rest of Europe Goat Milk Products Market, By Product Form
- 6.9.4.3 Rest of Europe Goat Milk Products Market, By End Use Industry
- 6.9.1 United Kingdom Goat Milk Products Market: Market Size and CAGR, 2018-2028 (USD Million & CAGR)
7. Asia Pacific Goat Milk Products Market: Historic and Forecast (2018-2028)
- 7.1 Asia Pacific Goat Milk Products Market: Snapshot
- 7.2 Asia Pacific Goat Milk Products Market: Market Size and CAGR, 2018-2028 (USD Million & CAGR)
- 7.3 Asia Pacific Goat Milk Products Market: Market Size and CAGR, 2018-2028 (000' Tonnes)
- 7.4 Average Selling Price Assessment of Goat Milk Products
- 7.5 Asia Pacific Goat Milk Products Market: Key Factors
- 7.6 Asia Pacific Goat Milk Products Market Segmentation: By Product Type
- 7.6.1 Asia Pacific Goat Milk Products Market, By Product Type Overview
- 7.6.2 Asia Pacific Goat Milk Products Market Size, By Cheese, By Value, 2018H-2028F (USD Million & CAGR)
- 7.6.3 Asia Pacific Goat Milk Products Market Size, By Butter, By Value, 2018H-2028F (USD Million & CAGR)
- 7.6.4 Asia Pacific Goat Milk Products Market Size, By Yoghurt, By Value, 2018H-2028F (USD Million & CAGR)
- 7.6.5 Asia Pacific Goat Milk Products Market Size, By Other Products, By Value, 2018H-2028F (USD Million & CAGR)
- 7.7 Asia Pacific Goat Milk Products Market Segmentation: By Product Form
- 7.7.1 Asia Pacific Goat Milk Products Market, By Product Form Overview
- 7.7.2 Asia Pacific Goat Milk Products Market Size, By Fluid Products, By Value, 2018H-2028F (USD Million & CAGR)
- 7.7.3 Asia Pacific Goat Milk Products Market Size, By Fermented Products, By Value, 2018H-2028F (USD Million & CAGR)
- 7.7.4 Asia Pacific Goat Milk Products Market Size, By Frozen Products, By Value, 2018H-2028F (USD Million & CAGR)
- 7.8 Asia Pacific Goat Milk Products Market Segmentation: By End Use Industry
- 7.8.1 Asia Pacific Goat Milk Products Market, By End Use Industry Overview
- 7.8.2 Asia Pacific Goat Milk Products Market Size, By Commercial, By Value, 2018H-2028F (USD Million & CAGR)
- 7.8.3 Asia Pacific Goat Milk Products Market Size, By Individual, By Value, 2018H-2028F (USD Million & CAGR)
- 7.9 Asia Pacific Goat Milk Products Market Segmentation: By Country
- 7.9.1 China Goat Milk Products Market Market: Market Size and CAGR, 2018-2028 (USD Million & CAGR)
- 7.9.1.1 China Goat Milk Products Market Market, By Product Type
- 7.9.1.2 China Goat Milk Products Market, By Product Form
- 7.9.1.3 China Goat Milk Products Market, By End Use Industry
- 7.9.2 India Goat Milk Products Market: Market Size and CAGR, 2018-2028 (USD Million & CAGR)
- 7.9.2.1 India Goat Milk Products Market, By Product Type
- 7.9.2.2 India Goat Milk Products Market, By Product Form
- 7.9.2.3 India Goat Milk Products Market, By End Use Industry
- 7.9.3 Japan Goat Milk Products Market: Market Size and CAGR, 2018-2028 (USD Million & CAGR)
- 7.9.3.1 Japan Goat Milk Products Market, By Product Type
- 7.9.3.2 Japan Goat Milk Products Market, By Product Form
- 7.9.3.3 Japan Goat Milk Products Market, By End Use Industry
- 7.9.4 South Korea Goat Milk Products Market: Market Size and CAGR, 2018-2028 (USD Million & CAGR)
- 7.9.4.1 South Korea Goat Milk Products Market, By Product Type
- 7.9.4.2 South Korea Goat Milk Products Market, By Product Form
- 7.9.4.3 South Korea Goat Milk Products Market, By End Use Industry
- 7.9.5 Rest of APAC Goat Milk Products Market: Market Size and CAGR, 2018-2028 (USD Million & CAGR)
- 7.9.5.1 Rest of APAC Goat Milk Products Market, By Product Type
- 7.9.5.2 Rest of APAC Goat Milk Products Market, By Product Form
- 7.9.5.3 Rest of APAC Goat Milk Products Market, By End Use Industry
- 7.9.1 China Goat Milk Products Market Market: Market Size and CAGR, 2018-2028 (USD Million & CAGR)
8. Middle East & Africa Goat Milk Products Market: Historic and Forecast (2018-2028)
- 8.1 Middle East & Africa Goat Milk Products Market: Snapshot
- 8.2 Middle East & Africa Goat Milk Products Market: Market Size and CAGR, 2018-2028 (USD Million & CAGR)
- 8.3 Middle East & Africa Goat Milk Products Market: Market Size and CAGR, 2018-2028 (000' Tonnes)
- 8.4 Average Selling Price Assessment of Goat Milk Products
- 8.5 Middle East & Africa Goat Milk Products Market: Key Factors
- 8.6 Middle East & Africa Goat Milk Products Market Segmentation: By Product Type
- 8.6.1 Middle East & Africa Goat Milk Products Market, By Product Type Overview
- 8.6.2 Middle East & Africa Goat Milk Products Market Size, By Cheese, By Value, 2018H-2028F (USD Million & CAGR)
- 8.6.3 Middle East & Africa Goat Milk Products Market Size, By Butter, By Value, 2018H-2028F (USD Million & CAGR)
- 8.6.5 Middle East & Africa Goat Milk Products Market Size, By Yoghurt, By Value, 2018H-2028F (USD Million & CAGR)
- 8.6.6 Middle East & Africa Goat Milk Products Market Size, By Other Products, By Value, 2018H-2028F (USD Million & CAGR)
- 8.7 Middle East & Africa Goat Milk Products Market Segmentation: By Product Form
- 8.7.1 Middle East & Africa Goat Milk Products Market, By Product Form Overview
- 8.7.2 Middle East & Africa Goat Milk Products Market Size, By Fluid Products, By Value, 2018H-2028F (USD Million & CAGR)
- 8.7.3 Middle East & Africa Goat Milk Products Market Size, By Fermented Products, By Value, 2018H-2028F (USD Million & CAGR)
- 8.7.4 Middle East & Africa Goat Milk Products Market Size, By Frozen Products, By Value, 2018H-2028F (USD Million & CAGR)
- 8.8 Middle East & Africa Goat Milk Products Market Segmentation: By End Use Industry
- 8.8.1 Middle East & Africa Goat Milk Products Market, By End Use Industry Overview
- 8.8.2 Middle East & Africa Goat Milk Products Market Size, By Commercial, By Value, 2018H-2028F (USD Million & CAGR)
- 8.8.3 Middle East & Africa Goat Milk Products Market Size, By Individual, By Value, 2018H-2028F (USD Million & CAGR)
9. Market Dynamics
- 9.1 Impact Assessment of Market Dynamics on the Global Goat Milk Products Market
- 9.2 Drivers
- 9.3 Restraints
- 9.4 Trends
10. Industry Ecosystem Analysis
- 10.1 Macro-Economic Factor Assessment
- 10.2 Value Chain Analysis
- 10.3 Porter Analysis
11. Competitive Positioning
- 11.1 Companies' Product Positioning
- 11.2 Market Position Matrix
- 11.3 Market Share Analysis of Goat Milk Products Market
- 11.4 Company Profiles
- 11.4.1 Ausnutria Dairy Corp. Ltd.
- 11.4.2 Goat Partners International Inc.
- 11.4.3 Emmi AG
- 11.4.4 Holle Baby Food AG
- 11.4.5 St. Helen's Farm
- 11.4.6 Hewitt's Dairy
- 11.4.7 Woolwich Dairy Inc.
- 11.4.8 Granarolo S.P.A.
- 11.4.9 Meyenberg Goat Milk
- 11.4.10 Redwood Hill Farm & Creamery