|
|
市場調査レポート
商品コード
1756389
細胞・遺伝子治療バイオ分析検査サービス市場:製品タイプ別、検査タイプ別、技術別、適応症範囲別、エンドユーザー別、国別、地域別-2025年~2032年の産業分析、市場規模、市場シェア、予測Cell & Gene Therapy Bioanalytical Testing Services Market, By Product Type, By Test Type, By Technology, By Indication Coverage, By End User, By Country, and By Region - Global Industry Analysis, Market Size, Market Share & Forecast from 2025-2032 |
||||||

|
|||||||
カスタマイズ可能
|
|||||||

| 細胞・遺伝子治療バイオ分析検査サービス市場:製品タイプ別、検査タイプ別、技術別、適応症範囲別、エンドユーザー別、国別、地域別-2025年~2032年の産業分析、市場規模、市場シェア、予測 |
|
出版日: 2025年05月04日
発行: AnalystView Market Insights
ページ情報: 英文 316 Pages
納期: 2~3営業日
|

全表示
- 概要
- 目次
レポートハイライト
細胞・遺伝子治療バイオ分析検査サービス市場規模は2024年に5億6,090万米ドルとなり、2025年から2032年にかけてCAGR 7.90%で拡大
細胞・遺伝子治療バイオ分析検査サービス市場-市場力学
臨床試験件数の増加と規制強化が市場拡大を加速
臨床試験活動の急増と先進治療に対する規制当局の注目の高まりにより、細胞・遺伝子治療バイオ分析検査サービスの需要が大幅に高まっています。2023年、米国FDAは遺伝子治療のための25以上の治験新薬(IND)申請を承認したが、これは評価中の治療法の強固なパイプラインを反映しています。さらに、欧州医薬品庁(EMA)や日本の医薬品医療機器総合機構(PMDA)のような規制機関は、安全性と有効性を保証するための包括的な生物分析バリデーションをますます義務付けるようになっています。NIHやCIRM(カリフォルニア再生医療研究所)のような組織は、遺伝子や細胞をベースとした臨床試験への資金提供を増やしており、間接的に専門的な試験サービスへの需要を煽っています。これらの動向は、特に規制が強化され、技術革新が主導する状況において、治療の成功と市場認可に不可欠なデータの完全性を確保する上で、高精度の分析プラットフォームが果たす重要な役割を強調しています。
細胞・遺伝子治療バイオ分析検査サービス市場-主な洞察
当社のリサーチアナリストの分析によると、世界市場は予測期間(2025-2032年)に約7.90%のCAGRで毎年成長すると予測されています。
製品タイプ別では、細胞治療が2024年に最大の市場シェアを示すと予測されています。
検査タイプ別では、バイオアベイラビリティと生物学的同等性が2024年の主要検査タイプです。
技術別では、次世代シーケンシング(NGS)が2024年の主要技術でした。
適応症別では、がんが2024年の主要適応症でした。
エンドユーザー別では、2024年の主要エンドユーザーはバイオテクノロジーおよび製薬企業でした。
地域別では、北米が2024年の主要収益源です。
細胞・遺伝子治療バイオ分析検査サービス市場-セグメンテーション分析:
細胞・遺伝子治療バイオ分析検査サービスの世界市場は、製品タイプ、検査タイプ、技術、適応症、エンドユーザー、地域に基づいて区分されます。
市場は製品タイプに基づいて3つのカテゴリーに分けられる:細胞療法、遺伝子療法(生体外、生体内)、遺伝子改変細胞療法(CAR T細胞療法、CAR-NK細胞療法、TCR-T細胞療法)です。細胞治療サービスは、幹細胞や免疫細胞の力価、同一性、安全性試験に重点を置いています。遺伝子治療は、生体外および生体内の様式に区分され、ウイルスベクターおよび導入効率アッセイが必要となります。CAR T、CAR-NK、TCR-Tのような遺伝子改変細胞療法は、操作された免疫応答の生物学的分析バリデーションに重点を置いています。
市場は検査タイプに基づいて8つのカテゴリーに分けられる:バイオアベイラビリティ&生物学的同等性試験、薬物動態試験、薬力学試験、バイオマーカー試験、非臨床試験、組織バイオアナリシス、その他、その他です。バイオアベイラビリティ試験と生物学的同等性試験は治療の一貫性を確保し、薬物動態学的試験と薬力学的試験は吸収と薬物作用を評価します。バイオマーカー試験は有効性の追跡をサポートし、非臨床試験と組織バイオアナリシスは前臨床試験における洞察を助ける。その他の検査は、症例特異的な分析データを提供します。
細胞・遺伝子治療バイオ分析検査サービス市場-地理的洞察
細胞・遺伝子治療バイオ分析検査サービス市場は、地域間の治療開発のペース、規制の枠組み、研究開発資金に牽引され、大きな地理的変動を示しています。北米は先進バイオテクノロジー拠点の存在、政府の強力な支援、革新的な治療法の早期導入により市場シェアをリードしています。特に米国は、遺伝子・細胞治療開発企業のネットワークが密であり、FDAのアクセラレーテッド・パスウェイなどの規制的枠組みが臨床拡大を後押ししています。欧州もこれに続き、ドイツ、英国、オランダなどの国々がGMP認定ラボや国家的な細胞療法イニシアチブに投資しています。アジア太平洋は、特に中国、韓国、日本で急速に有力な競争相手として台頭してきており、政府が支援するバイオパークや拡大する臨床インフラが成長を支えています。インドとシンガポールにおけるアウトソーシング動向の高まりも、この地域のサービス展望を再構築しており、アジアをコスト効率の高いバイオ分析試験サービスの戦略的拠点としています。
細胞・遺伝子治療バイオ分析検査サービス市場-競合情勢:
細胞・遺伝子治療バイオ分析検査サービス市場の競合情勢は、複雑な生物製剤の分析能力の向上に注力する世界の医薬品開発業務受託機関(CRO)、専門試験ラボ、新興バイオテクノロジーサービスプロバイダーの存在によって特徴付けられます。主要企業は、高まる規制や科学的要求に応えるため、最先端の施設、GLP/GMP認定ラボ、独自のアッセイプラットフォームに投資しています。前臨床段階から臨床開発までのタイムラインを合理化し、薬事コンプライアンスを確保することを目的とした、治療開発企業とCROのコラボレーションが増加しています。各社は、カスタマイズされた力価測定、生物学的分布研究、ベクターの特性解析、次世代シーケンサーに基づく分析など、サービスポートフォリオを拡大しています。さらに、学術機関や病院関連の研究所は、初期段階のメソッド開発と標準化に貢献しています。アジア太平洋のような地域でも競合情勢は激化しており、現地企業は国際共同治験のためのサービスを拡大しており、柔軟性、規制に関する専門知識、納期がこの進化する情勢における重要な差別化要因となっています。
目次
第1章 細胞・遺伝子治療バイオ分析検査サービス市場概要
- 調査範囲
- 市場推定年数
第2章 エグゼクティブサマリー
- 市場内訳
- 競合考察
第3章 細胞・遺伝子治療バイオ分析検査サービスの主な市場動向
- 市場促進要因
- 市場抑制要因
- 市場機会
- 市場の将来動向
第4章 細胞・遺伝子治療バイオ分析検査サービス産業調査
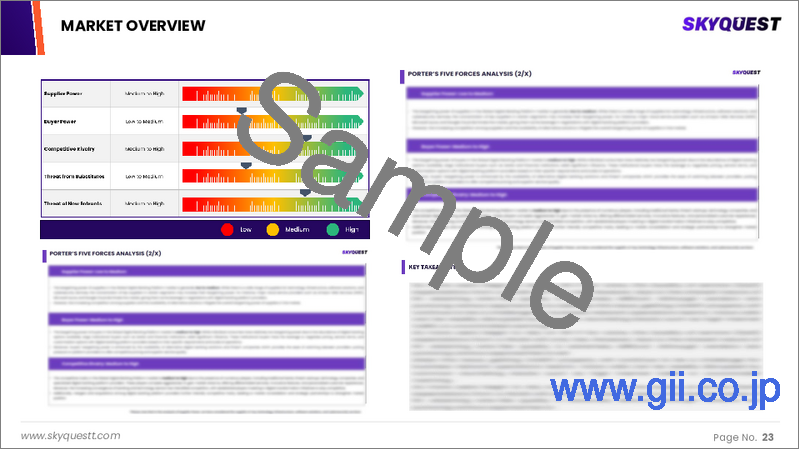
- PEST分析
- ポーターのファイブフォース分析
- 成長見通しマッピング
- 規制枠組み分析
第5章 細胞・遺伝子治療バイオ分析検査サービス市場:高まる地政学的緊張の影響
- COVID-19パンデミックの影響
- ロシア・ウクライナ戦争の影響
- 中東紛争の影響
第6章 細胞・遺伝子治療バイオ分析検査サービス市場情勢
- 細胞・遺伝子治療バイオ分析検査サービス市場シェア分析(2024年)
- 主要メーカー別内訳データ
- ベテラン選手の分析
- 新興企業の分析
第7章 細胞・遺伝子治療バイオ分析検査サービス市場-製品タイプ別
- 概要
- セグメントシェア分析:製品タイプ別
- 細胞療法
- 遺伝子治療
- 生体外
- 生体内
- 遺伝子組み換え細胞療法
- CAR T細胞療法
- CAR-NK細胞療法
- TCR-T細胞療法
第8章 細胞・遺伝子治療バイオ分析検査サービス市場- 検査タイプ別
- 概要
- セグメントシェア分析:検査タイプ別
- バイオアベイラビリティと生物学的同等性試験
- 薬物動態試験
- 薬力学的試験
- バイオマーカー検査
- 非臨床
- 組織バイオ分析
- その他
第9章 細胞・遺伝子治療バイオ分析検査サービス市場- 技術別
- 概要
- セグメントシェア分析:技術別
- PCR
- ELISA
- 次世代シーケンシング(NGS)
- フローサイトメトリー
- その他
第10章 細胞・遺伝子治療バイオ分析検査サービス市場- 適応症別
- 概要
- セグメントシェア分析:適応症別
- 腫瘍学がん
- 感染症
- 神経疾患
- 心血管疾患
- 消化器疾患
- 自己免疫疾患
- 希少疾患
- その他
第11章 細胞・遺伝子治療バイオ分析検査サービス市場- エンドユーザー別
- 概要
- セグメントシェア分析:エンドユーザー別
- バイオテクノロジーおよび製薬会社
- 学術調査機関
- 契約調査機関(CRO)
第12章 細胞・遺伝子治療バイオ分析検査サービス市場-地域別
- イントロダクション
- 北米
- 概要
- 北米の主要メーカー
- 米国
- カナダ
- 欧州
- 概要
- 欧州の主要メーカー
- ドイツ
- 英国
- フランス
- イタリア
- スペイン
- オランダ
- スウェーデン
- ロシア
- ポーランド
- その他
- アジア太平洋(APAC)
- 概要
- アジア太平洋地域の主要メーカー
- 中国
- インド
- 日本
- 韓国
- オーストラリア
- インドネシア
- タイ
- フィリピン
- その他
- ラテンアメリカ(LATAM)
- 概要
- ラテンアメリカの主要メーカー
- ブラジル
- メキシコ
- アルゼンチン
- コロンビア
- その他
- 中東およびアフリカ
- 概要
- 中東およびアフリカの主要メーカー
- サウジアラビア
- アラブ首長国連邦
- イスラエル
- トルコ
- アルジェリア
- エジプト
- その他
第13章 主要ベンダー分析- 細胞・遺伝子治療バイオ分析検査サービス業界
- 競合ダッシュボード
- Competitive Benchmarking
- Competitive Positioning
- 企業プロファイル
- Alliance Pharma
- BioAgilytix Labs
- Charles River Laboratories
- Clean Cells
- Covance Inc.
- Eurofins Scientific
- ICON plc
- Intertek Group Plc
- IQVIA, Inc.
- KCAS Bioanalytical Services
- Laboratory Corporation of America Holdings
- Pharmaceutical Product Development, Inc.(Thermo Fisher Scientific Inc.)
- Pharmaron
- Prolytix
- SGS SA
- Syneos Health
- Others
第14章 アナリストの全方位展望
REPORT HIGHLIGHT
Cell & Gene Therapy Bioanalytical Testing Services Market size was valued at US$ 560.90 Million in 2024, expanding at a CAGR of 7.90% from 2025 to 2032.
The Cell & Gene Therapy Bioanalytical Testing Services Market encompasses specialized analytical services that support the development, characterization, and regulatory approval of cell and gene therapy products. Growth in this market is propelled by the rising number of clinical trials in regenerative medicine and personalized therapeutics. For instance, as of early 2024, the FDA had over 2,000 active Investigational New Drug applications for gene and cell therapy products. Increasing investments from public health bodies, like the NIH's \$500 million commitment to advance gene therapy for rare diseases, further bolster demand. However, the complexity of assay development and high operational costs remain key restraints. Opportunities lie in expanding testing capabilities for viral vectors, potency assays, and biodistribution studies, especially as global regulatory agencies tighten guidelines for cell-based therapies. Additionally, partnerships between biopharma and CROs are streamlining bioanalytical workflows to enhance speed-to-market for next-gen therapies.
Cell & Gene Therapy Bioanalytical Testing Services Market- Market Dynamics
Rising Clinical Trial Volume and Regulatory Scrutiny to Accelerate Market Expansion
The surge in clinical trial activity and growing regulatory focus on advanced therapies have significantly intensified the demand for cell and gene therapy bioanalytical testing services. In 2023, the U.S. FDA approved over 25 Investigational New Drug (IND) applications for gene therapies, reflecting the robust pipeline of therapies under evaluation. Furthermore, regulatory bodies like the European Medicines Agency (EMA) and the Pharmaceuticals and Medical Devices Agency (PMDA) in Japan are increasingly mandating comprehensive bioanalytical validation for safety and efficacy assurance. Organizations such as the NIH and CIRM (California Institute for Regenerative Medicine) have increased funding for gene and cell-based trials, indirectly fueling demand for specialized testing services. These trends emphasize the critical role of high-precision analytical platforms in ensuring data integrity, which is vital for therapeutic success and market authorization, particularly in a landscape that is becoming more regulated and innovation-driven.
Cell & Gene Therapy Bioanalytical Testing Services Market- Key Insights
As per the analysis shared by our research analyst, the global market is estimated to grow annually at a CAGR of around 7.90% over the forecast period (2025-2032)
Based on product type segmentation, Cell therapy was predicted to show maximum market share in the year 2024
Based on Test Type segmentation, Bioavailability & bioequivalence was the leading Test Type in 2024
Based on Technology segmentation, Next-Generation Sequencing (NGS) was the leading Technology in 2024
Based on Indication Coverage segmentation, Oncology Cancer was the leading Indication Coverage in 2024
Based on end user segmentation, Biotechnology & Pharmaceutical Companies were the leading end user in 2024
On the basis of region, North America was the leading revenue generator in 2024
Cell & Gene Therapy Bioanalytical Testing Services Market- Segmentation Analysis:
The Global Cell & Gene Therapy Bioanalytical Testing Services Market is segmented on the basis of Product Type, Test Type, Technology, Indication Coverage, End User, and Region.
The market is divided into three categories based on product type: Cell Therapy, Gene Therapy (Ex-vivo, and In-vivo), and Gene-Modified Cell Therapy (CAR T-cell therapies, CAR-NK cell therapy, TCR-T cell therapy). Cell therapy services focus on potency, identity, and safety testing for stem and immune cells. Gene therapy is segmented into ex-vivo and in-vivo modalities, requiring viral vector and transduction efficiency assays. Gene-modified cell therapies like CAR T, CAR-NK, and TCR-T emphasize bioanalytical validation for engineered immune responses.
The market is divided into eight categories based on Test Type: Bioavailability & Bioequivalence Studies, Pharmacokinetic Testing, Pharmacodynamic Testing, Biomarker Testing, Non-clinical, Tissue Bioanalysis, Miscellaneous, and Others. Bioavailability & bioequivalence studies ensure therapeutic consistency, while pharmacokinetic and pharmacodynamic testing assess absorption and drug action. Biomarker testing supports efficacy tracking, and non-clinical and tissue bioanalysis aid preclinical insights. Miscellaneous and other tests provide supportive, case-specific analytical data.
Cell & Gene Therapy Bioanalytical Testing Services Market- Geographical Insights
The Cell & Gene Therapy Bioanalytical Testing Services Market shows significant geographical variation, driven by the pace of therapy development, regulatory frameworks, and R&D funding across regions. North America leads in market share due to the presence of advanced biotechnology hubs, strong government support, and early adoption of innovative therapies. The U.S., in particular, has a dense network of gene and cell therapy developers and regulatory frameworks such as the FDA's accelerated pathways, encouraging clinical expansion. Europe follows closely, with countries like Germany, the UK, and the Netherlands investing in GMP-certified labs and national cell therapy initiatives. Asia-Pacific is rapidly emerging as a strong contender, especially in China, South Korea, and Japan, where government-backed biotech parks and expanding clinical infrastructure support growth. Increasing outsourcing trends in India and Singapore are also reshaping the regional service landscape, making Asia a strategic hub for cost-effective bioanalytical testing services.
Cell & Gene Therapy Bioanalytical Testing Services Market- Competitive Landscape:
The competitive landscape of the Cell & Gene Therapy Bioanalytical Testing Services Market is marked by the presence of global contract research organizations (CROs), specialized testing labs, and emerging biotech service providers focused on advancing analytical capabilities for complex biologics. Key players are investing in state-of-the-art facilities, GLP/GMP-certified labs, and proprietary assay platforms to meet growing regulatory and scientific demands. Collaborations between therapy developers and CROs are increasing, aiming to streamline timelines and ensure regulatory compliance from preclinical stages through clinical development. Companies are expanding service portfolios to include customized potency assays, biodistribution studies, vector characterization, and next-generation sequencing-based analytics. Moreover, academic and hospital-affiliated labs are contributing to early-stage method development and standardization. Competition is also intensifying in regions like Asia-Pacific, where local firms are scaling up offerings for global trials, making flexibility, regulatory expertise, and turnaround time key differentiators in this evolving landscape.
Recent Developments:
In August 2024, SGS launched specialized bioanalytical testing services for cell and gene therapy in North America, offering comprehensive solutions from discovery to phase 3 clinical trials at its Hudson, New Hampshire lab, expanding global capabilities for advanced therapeutic development and regulatory compliance.
In March 2025, Bharat Biotech launched its first cell and gene therapy facility in Telangana, investing $75 million. The company aims to introduce novel cell and gene therapies for oncology and rare diseases by 2028, focusing on affordability and expanding beyond vaccines.
In April 2025, Cell Therapies and Xellera Therapeutics partnered to accelerate cell and gene therapy access across Asia-Pacific, focusing on GMP manufacturing, regulatory solutions, and collaborative innovation in Australia and Hong Kong, aiming to enhance patient care and streamline market access.
SCOPE OF THE REPORT
The scope of this report covers the market by its major segments, which include as follows:
GLOBAL CELL & GENE THERAPY BIOANALYTICAL TESTING SERVICES MARKET KEY PLAYERS- DETAILED COMPETITIVE INSIGHTS
- Alliance Pharma
- BioAgilytix Labs
- Charles River Laboratories
- Clean Cells
- Covance Inc.
- Eurofins Scientific
- ICON plc
- Intertek Group Plc
- IQVIA, Inc.
- KCAS Bioanalytical Services
- Laboratory Corporation of America Holdings
- Pharmaceutical Product Development, Inc. (Thermo Fisher Scientific Inc.)
- Pharmaron
- Prolytix
- SGS SA
- Syneos Health
- Others
GLOBAL CELL & GENE THERAPY BIOANALYTICAL TESTING SERVICES MARKET, BY PRODUCT TYPE- MARKET ANALYSIS, 2019 - 2032
- Cell Therapy
- Gene Therapy
- Ex-vivo
- In-vivo
- Gene-Modified Cell Therapy
- CAR T-cell therapies
- CAR-NK cell therapy
- TCR-T cell therapy
GLOBAL CELL & GENE THERAPY BIOANALYTICAL TESTING SERVICES MARKET, BY TEST TYPE- MARKET ANALYSIS, 2019 - 2032
- Bioavailability & Bioequivalence Studies
- Pharmacokinetic Testing
- Pharmacodynamic Testing
- Biomarker Testing
- Non-clinical
- Tissue Bioanalysis
- Miscellaneous
- Others
GLOBAL CELL & GENE THERAPY BIOANALYTICAL TESTING SERVICES MARKET, BY TECHNOLOGY- MARKET ANALYSIS, 2019 - 2032
- PCR
- ELISA
- Next-Generation Sequencing (NGS)
- Flow Cytometry
- Others
GLOBAL CELL & GENE THERAPY BIOANALYTICAL TESTING SERVICES MARKET, BY INDICATION COVERAGE- MARKET ANALYSIS, 2019 - 2032
- Oncology Cancer
- Infectious Diseases
- Neurological disorders
- Cardiovascular Disorders
- Gastrointestinal Diseases
- Autoimmune Diseases
- Rare Diseases
- Others
GLOBAL CELL & GENE THERAPY BIOANALYTICAL TESTING SERVICES MARKET, BY END USER- MARKET ANALYSIS, 2019 - 2032
- Biotechnology & Pharmaceutical Companies
- Academic & Research Institutes
- Contract Research Organizations (CROs)
GLOBAL CELL & GENE THERAPY BIOANALYTICAL TESTING SERVICES MARKET, BY REGION- MARKET ANALYSIS, 2019 - 2032
- North America
- U.S.
- Canada
- Europe
- Germany
- UK
- France
- Italy
- Spain
- The Netherlands
- Sweden
- Russia
- Poland
- Rest of Europe
- Asia Pacific
- China
- India
- Japan
- South Korea
- Australia
- Indonesia
- Thailand
- Philippines
- Rest of APAC
- Latin America
- Brazil
- Mexico
- Argentina
- Colombia
- Rest of LATAM
- The Middle East and Africa
- Saudi Arabia
- UAE
- Israel
- Turkey
- Algeria
- Egypt
- Rest of MEA
Table of Contents
1. Cell & Gene Therapy Bioanalytical Testing Services Market Overview
- 1.1. Study Scope
- 1.2. Market Estimation Years
2. Executive Summary
- 2.1. Market Snippet
- 2.1.1. Cell & Gene Therapy Bioanalytical Testing Services Market Snippet by Product Type
- 2.1.2. Cell & Gene Therapy Bioanalytical Testing Services Market Snippet by Test Type
- 2.1.3. Cell & Gene Therapy Bioanalytical Testing Services Market Snippet by Technology
- 2.1.4. Cell & Gene Therapy Bioanalytical Testing Services Market Snippet by Indication Coverage
- 2.1.5. Cell & Gene Therapy Bioanalytical Testing Services Market Snippet by End User
- 2.1.6. Cell & Gene Therapy Bioanalytical Testing Services Market Snippet by Country
- 2.1.7. Cell & Gene Therapy Bioanalytical Testing Services Market Snippet by Region
- 2.2. Competitive Insights
3. Cell & Gene Therapy Bioanalytical Testing Services Key Market Trends
- 3.1. Cell & Gene Therapy Bioanalytical Testing Services Market Drivers
- 3.1.1. Impact Analysis of Market Drivers
- 3.2. Cell & Gene Therapy Bioanalytical Testing Services Market Restraints
- 3.2.1. Impact Analysis of Market Restraints
- 3.3. Cell & Gene Therapy Bioanalytical Testing Services Market Opportunities
- 3.4. Cell & Gene Therapy Bioanalytical Testing Services Market Future Trends
4. Cell & Gene Therapy Bioanalytical Testing Services Industry Study
- 4.1. PEST Analysis
- 4.2. Porter's Five Forces Analysis
- 4.3. Growth Prospect Mapping
- 4.4. Regulatory Framework Analysis
5. Cell & Gene Therapy Bioanalytical Testing Services Market: Impact of Escalating Geopolitical Tensions
- 5.1. Impact of COVID-19 Pandemic
- 5.2. Impact of Russia-Ukraine War
- 5.3. Impact of Middle East Conflicts
6. Cell & Gene Therapy Bioanalytical Testing Services Market Landscape
- 6.1. Cell & Gene Therapy Bioanalytical Testing Services Market Share Analysis, 2024
- 6.2. Breakdown Data, by Key Manufacturer
- 6.2.1. Established Players' Analysis
- 6.2.2. Emerging Players' Analysis
7. Cell & Gene Therapy Bioanalytical Testing Services Market - By Product Type
- 7.1. Overview
- 7.1.1. Segment Share Analysis, By Product Type, 2024 & 2032 (%)
- 7.1.2. Cell Therapy
- 7.1.3. Gene Therapy
- 7.1.3.1. Ex-vivo
- 7.1.3.2. In-vivo
- 7.1.4. Gene-Modified Cell Therapy
- 7.1.4.1. CAR T-cell therapies
- 7.1.4.2. CAR-NK cell therapy
- 7.1.4.3. TCR-T cell therapy
8. Cell & Gene Therapy Bioanalytical Testing Services Market - By Test Type
- 8.1. Overview
- 8.1.1. Segment Share Analysis, By Test Type, 2024 & 2032 (%)
- 8.1.2. Bioavailability & Bioequivalence Studies
- 8.1.3. Pharmacokinetic Testing
- 8.1.4. Pharmacodynamic Testing
- 8.1.5. Biomarker Testing
- 8.1.6. Non-clinical
- 8.1.7. Tissue Bioanalysis
- 8.1.8. Miscellaneous
- 8.1.9. Others
9. Cell & Gene Therapy Bioanalytical Testing Services Market - By Technology
- 9.1. Overview
- 9.1.1. Segment Share Analysis, By Technology, 2024 & 2032 (%)
- 9.1.2. PCR
- 9.1.3. ELISA
- 9.1.4. Next-Generation Sequencing (NGS)
- 9.1.5. Flow Cytometry
- 9.1.6. Others
10. Cell & Gene Therapy Bioanalytical Testing Services Market - By Indication Coverage
- 10.1. Overview
- 10.1.1. Segment Share Analysis, By Indication Coverage, 2024 & 2032 (%)
- 10.1.2. Oncology Cancer
- 10.1.3. Infectious Diseases
- 10.1.4. Neurological disorders
- 10.1.5. Cardiovascular Disorders
- 10.1.6. Gastrointestinal Diseases
- 10.1.7. Autoimmune Diseases
- 10.1.8. Rare Diseases
- 10.1.9. Others
11. Cell & Gene Therapy Bioanalytical Testing Services Market - By End User
- 11.1. Overview
- 11.1.1. Segment Share Analysis, By End User, 2024 & 2032 (%)
- 11.1.2. Biotechnology & Pharmaceutical Companies
- 11.1.3. Academic & Research Institutes
- 11.1.4. Contract Research Organizations (CROs)
12. Cell & Gene Therapy Bioanalytical Testing Services Market- By Geography
- 12.1. Introduction
- 12.1.1. Segment Share Analysis, By Geography, 2024 & 2032 (%)
- 12.2. North America
- 12.2.1. Overview
- 12.2.2. Cell & Gene Therapy Bioanalytical Testing Services Key Manufacturers in North America
- 12.2.3. North America Market Size and Forecast, By Country, 2019 - 2032 (US$ Million)
- 12.2.4. North America Market Size and Forecast, By Product Type, 2019 - 2032 (US$ Million)
- 12.2.5. North America Market Size and Forecast, By Test Type, 2019 - 2032 (US$ Million)
- 12.2.6. North America Market Size and Forecast, By Technology, 2019 - 2032 (US$ Million)
- 12.2.7. North America Market Size and Forecast, By Indication Coverage, 2019 - 2032 (US$ Million)
- 12.2.8. North America Market Size and Forecast, By End User, 2019 - 2032 (US$ Million)
- 12.2.9. U.S.
- 12.2.9.1. Overview
- 12.2.9.2. Market Analysis, Forecast, and Y-O-Y Growth Rate, 2019 - 2032, (US$ Million)
- 12.2.9.3. U.S. Market Size and Forecast, By Product Type, 2019 - 2032 (US$ Million)
- 12.2.9.4. U.S. Market Size and Forecast, By Test Type, 2019 - 2032 (US$ Million)
- 12.2.9.5. U.S. Market Size and Forecast, By Technology, 2019 - 2032 (US$ Million)
- 12.2.9.6. U.S. Market Size and Forecast, By Indication Coverage, 2019 - 2032 (US$ Million)
- 12.2.9.7. U.S. Market Size and Forecast, By End User, 2019 - 2032 (US$ Million)
- 12.2.10. Canada
- 12.2.10.1. Overview
- 12.2.10.2. Market Analysis, Forecast, and Y-O-Y Growth Rate, 2019 - 2032, (US$ Million)
- 12.2.10.3. Canada Market Size and Forecast, By Product Type, 2019 - 2032 (US$ Million)
- 12.2.10.4. Canada Market Size and Forecast, By Test Type, 2019 - 2032 (US$ Million)
- 12.2.10.5. Canada Market Size and Forecast, By Technology, 2019 - 2032 (US$ Million)
- 12.2.10.6. Canada Market Size and Forecast, By Indication Coverage, 2019 - 2032 (US$ Million)
- 12.2.10.7. Canada Market Size and Forecast, By End User, 2019 - 2032 (US$ Million)
- 12.3. Europe
- 12.3.1. Overview
- 12.3.2. Cell & Gene Therapy Bioanalytical Testing Services Key Manufacturers in Europe
- 12.3.3. Europe Market Size and Forecast, By Country, 2019 - 2032 (US$ Million)
- 12.3.4. Europe Market Size and Forecast, By Product Type, 2019 - 2032 (US$ Million)
- 12.3.5. Europe Market Size and Forecast, By Test Type, 2019 - 2032 (US$ Million)
- 12.3.6. Europe Market Size and Forecast, By Technology, 2019 - 2032 (US$ Million)
- 12.3.7. Europe Market Size and Forecast, By Indication Coverage, 2019 - 2032 (US$ Million)
- 12.3.8. Europe Market Size and Forecast, By End User, 2019 - 2032 (US$ Million)
- 12.3.9. Germany
- 12.3.9.1. Overview
- 12.3.9.2. Market Analysis, Forecast, and Y-O-Y Growth Rate, 2019 - 2032, (US$ Million)
- 12.3.9.3. Germany Market Size and Forecast, By Product Type, 2019 - 2032 (US$ Million)
- 12.3.9.4. Germany Market Size and Forecast, By Test Type, 2019 - 2032 (US$ Million)
- 12.3.9.5. Germany Market Size and Forecast, By Technology, 2019 - 2032 (US$ Million)
- 12.3.9.6. Germany Market Size and Forecast, By Indication Coverage, 2019 - 2032 (US$ Million)
- 12.3.9.7. Germany Market Size and Forecast, By End User, 2019 - 2032 (US$ Million)
- 12.3.10. UK
- 12.3.10.1. Overview
- 12.3.10.2. Market Analysis, Forecast, and Y-O-Y Growth Rate, 2019 - 2032, (US$ Million)
- 12.3.10.3. UK Market Size and Forecast, By Product Type, 2019 - 2032 (US$ Million)
- 12.3.10.4. UK Market Size and Forecast, By Test Type, 2019 - 2032 (US$ Million)
- 12.3.10.5. UK Market Size and Forecast, By Technology, 2019 - 2032 (US$ Million)
- 12.3.10.6. UK Market Size and Forecast, By Indication Coverage, 2019 - 2032 (US$ Million)
- 12.3.10.7. UK Market Size and Forecast, By End User, 2019 - 2032 (US$ Million)
- 12.3.11. France
- 12.3.11.1. Overview
- 12.3.11.2. Market Analysis, Forecast, and Y-O-Y Growth Rate, 2019 - 2032, (US$ Million)
- 12.3.11.3. France Market Size and Forecast, By Product Type, 2019 - 2032 (US$ Million)
- 12.3.11.4. France Market Size and Forecast, By Test Type, 2019 - 2032 (US$ Million)
- 12.3.11.5. France Market Size and Forecast, By Technology, 2019 - 2032 (US$ Million)
- 12.3.11.6. France Market Size and Forecast, By Indication Coverage, 2019 - 2032 (US$ Million)
- 12.3.11.7. France Market Size and Forecast, By End User, 2019 - 2032 (US$ Million)
- 12.3.12. Italy
- 12.3.12.1. Overview
- 12.3.12.2. Market Analysis, Forecast, and Y-O-Y Growth Rate, 2019 - 2032, (US$ Million)
- 12.3.12.3. Italy Market Size and Forecast, By Product Type, 2019 - 2032 (US$ Million)
- 12.3.12.4. Italy Market Size and Forecast, By Test Type, 2019 - 2032 (US$ Million)
- 12.3.12.5. Italy Market Size and Forecast, By Technology, 2019 - 2032 (US$ Million)
- 12.3.12.6. Italy Market Size and Forecast, By Indication Coverage, 2019 - 2032 (US$ Million)
- 12.3.12.7. Italy Market Size and Forecast, By End User, 2019 - 2032 (US$ Million)
- 12.3.13. Spain
- 12.3.13.1. Overview
- 12.3.13.2. Market Analysis, Forecast, and Y-O-Y Growth Rate, 2019 - 2032, (US$ Million)
- 12.3.13.3. Spain Market Size and Forecast, By Product Type, 2019 - 2032 (US$ Million)
- 12.3.13.4. Spain Market Size and Forecast, By Test Type, 2019 - 2032 (US$ Million)
- 12.3.13.5. Spain Market Size and Forecast, By Technology, 2019 - 2032 (US$ Million)
- 12.3.13.6. Spain Market Size and Forecast, By Indication Coverage, 2019 - 2032 (US$ Million)
- 12.3.13.7. Spain Market Size and Forecast, By End User, 2019 - 2032 (US$ Million)
- 12.3.14. The Netherlands
- 12.3.14.1. Overview
- 12.3.14.2. Market Analysis, Forecast, and Y-O-Y Growth Rate, 2019 - 2032, (US$ Million)
- 12.3.14.3. The Netherlands Market Size and Forecast, By Product Type, 2019 - 2032 (US$ Million)
- 12.3.14.4. The Netherlands Market Size and Forecast, By Test Type, 2019 - 2032 (US$ Million)
- 12.3.14.5. The Netherlands Market Size and Forecast, By Technology, 2019 - 2032 (US$ Million)
- 12.3.14.6. The Netherlands Market Size and Forecast, By Indication Coverage, 2019 - 2032 (US$ Million)
- 12.3.14.7. The Netherlands Market Size and Forecast, By End User, 2019 - 2032 (US$ Million)
- 12.3.15. Sweden
- 12.3.15.1. Overview
- 12.3.15.2. Market Analysis, Forecast, and Y-O-Y Growth Rate, 2019 - 2032, (US$ Million)
- 12.3.15.3. Sweden Market Size and Forecast, By Product Type, 2019 - 2032 (US$ Million)
- 12.3.15.4. Sweden Market Size and Forecast, By Test Type, 2019 - 2032 (US$ Million)
- 12.3.15.5. Sweden Market Size and Forecast, By Technology, 2019 - 2032 (US$ Million)
- 12.3.15.6. Sweden Market Size and Forecast, By Indication Coverage, 2019 - 2032 (US$ Million)
- 12.3.15.7. Sweden Market Size and Forecast, By End User, 2019 - 2032 (US$ Million)
- 12.3.16. Russia
- 12.3.16.1. Overview
- 12.3.16.2. Market Analysis, Forecast, and Y-O-Y Growth Rate, 2019 - 2032, (US$ Million)
- 12.3.16.3. Russia Market Size and Forecast, By Product Type, 2019 - 2032 (US$ Million)
- 12.3.16.4. Russia Market Size and Forecast, By Test Type, 2019 - 2032 (US$ Million)
- 12.3.16.5. Russia Market Size and Forecast, By Technology, 2019 - 2032 (US$ Million)
- 12.3.16.6. Russia Market Size and Forecast, By Indication Coverage, 2019 - 2032 (US$ Million)
- 12.3.16.7. Russia Market Size and Forecast, By End User, 2019 - 2032 (US$ Million)
- 12.3.17. Poland
- 12.3.17.1. Overview
- 12.3.17.2. Market Analysis, Forecast, and Y-O-Y Growth Rate, 2019 - 2032, (US$ Million)
- 12.3.17.3. Poland Market Size and Forecast, By Product Type, 2019 - 2032 (US$ Million)
- 12.3.17.4. Poland Market Size and Forecast, By Test Type, 2019 - 2032 (US$ Million)
- 12.3.17.5. Poland Market Size and Forecast, By Technology, 2019 - 2032 (US$ Million)
- 12.3.17.6. Poland Market Size and Forecast, By Indication Coverage, 2019 - 2032 (US$ Million)
- 12.3.17.7. Poland Market Size and Forecast, By End User, 2019 - 2032 (US$ Million)
- 12.3.18. Rest of Europe
- 12.3.18.1. Overview
- 12.3.18.2. Market Analysis, Forecast, and Y-O-Y Growth Rate, 2019 - 2032, (US$ Million)
- 12.3.18.3. Rest of the Europe Market Size and Forecast, By Product Type, 2019 - 2032 (US$ Million)
- 12.3.18.4. Rest of the Europe Market Size and Forecast, By Test Type, 2019 - 2032 (US$ Million)
- 12.3.18.5. Rest of the Europe Market Size and Forecast, By Technology, 2019 - 2032 (US$ Million)
- 12.3.18.6. Rest of the Europe Market Size and Forecast, By Indication Coverage, 2019 - 2032 (US$ Million)
- 12.3.18.7. Rest of the Europe Market Size and Forecast, By End User, 2019 - 2032 (US$ Million)
- 12.4. Asia Pacific (APAC)
- 12.4.1. Overview
- 12.4.2. Cell & Gene Therapy Bioanalytical Testing Services Key Manufacturers in Asia Pacific
- 12.4.3. APAC Market Size and Forecast, By Country, 2019 - 2032 (US$ Million)
- 12.4.4. APAC Market Size and Forecast, By Product Type, 2019 - 2032 (US$ Million)
- 12.4.5. APAC Market Size and Forecast, By Test Type, 2019 - 2032 (US$ Million)
- 12.4.6. APAC Market Size and Forecast, By Technology, 2019 - 2032 (US$ Million)
- 12.4.7. APAC Market Size and Forecast, By Indication Coverage, 2019 - 2032 (US$ Million)
- 12.4.8. APAC Market Size and Forecast, By End User, 2019 - 2032 (US$ Million)
- 12.4.9. China
- 12.4.9.1. Overview
- 12.4.9.2. Market Analysis, Forecast, and Y-O-Y Growth Rate, 2019 - 2032, (US$ Million)
- 12.4.9.3. China Market Size and Forecast, By Product Type, 2019 - 2032 (US$ Million)
- 12.4.9.4. China Market Size and Forecast, By Test Type, 2019 - 2032 (US$ Million)
- 12.4.9.5. China Market Size and Forecast, By Technology, 2019 - 2032 (US$ Million)
- 12.4.9.6. China Market Size and Forecast, By Indication Coverage, 2019 - 2032 (US$ Million)
- 12.4.9.7. China Market Size and Forecast, By End User, 2019 - 2032 (US$ Million)
- 12.4.10. India
- 12.4.10.1. Overview
- 12.4.10.2. Market Analysis, Forecast, and Y-O-Y Growth Rate, 2019 - 2032, (US$ Million)
- 12.4.10.3. India Market Size and Forecast, By Product Type, 2019 - 2032 (US$ Million)
- 12.4.10.4. India Market Size and Forecast, By Test Type, 2019 - 2032 (US$ Million)
- 12.4.10.5. India Market Size and Forecast, By Technology, 2019 - 2032 (US$ Million)
- 12.4.10.6. India Market Size and Forecast, By Indication Coverage, 2019 - 2032 (US$ Million)
- 12.4.10.7. India Market Size and Forecast, By End User, 2019 - 2032 (US$ Million)
- 12.4.11. Japan
- 12.4.11.1. Overview
- 12.4.11.2. Market Analysis, Forecast, and Y-O-Y Growth Rate, 2019 - 2032, (US$ Million)
- 12.4.11.3. Japan Market Size and Forecast, By Product Type, 2019 - 2032 (US$ Million)
- 12.4.11.4. Japan Market Size and Forecast, By Test Type, 2019 - 2032 (US$ Million)
- 12.4.11.5. Japan Market Size and Forecast, By Technology, 2019 - 2032 (US$ Million)
- 12.4.11.6. Japan Market Size and Forecast, By Indication Coverage, 2019 - 2032 (US$ Million)
- 12.4.11.7. Japan Market Size and Forecast, By End User, 2019 - 2032 (US$ Million)
- 12.4.12. South Korea
- 12.4.12.1. Overview
- 12.4.12.2. Market Analysis, Forecast, and Y-O-Y Growth Rate, 2019 - 2032, (US$ Million)
- 12.4.12.3. South Korea Market Size and Forecast, By Product Type, 2019 - 2032 (US$ Million)
- 12.4.12.4. South Korea Market Size and Forecast, By Test Type, 2019 - 2032 (US$ Million)
- 12.4.12.5. South Korea Market Size and Forecast, By Technology, 2019 - 2032 (US$ Million)
- 12.4.12.6. South Korea Market Size and Forecast, By Indication Coverage, 2019 - 2032 (US$ Million)
- 12.4.12.7. South Korea Market Size and Forecast, By End User, 2019 - 2032 (US$ Million)
- 12.4.13. Australia
- 12.4.13.1. Overview
- 12.4.13.2. Market Analysis, Forecast, and Y-O-Y Growth Rate, 2019 - 2032, (US$ Million)
- 12.4.13.3. Australia Market Size and Forecast, By Product Type, 2019 - 2032 (US$ Million)
- 12.4.13.4. Australia Market Size and Forecast, By Test Type, 2019 - 2032 (US$ Million)
- 12.4.13.5. Australia Market Size and Forecast, By Technology, 2019 - 2032 (US$ Million)
- 12.4.13.6. Australia Market Size and Forecast, By Indication Coverage, 2019 - 2032 (US$ Million)
- 12.4.13.7. Australia Market Size and Forecast, By End User, 2019 - 2032 (US$ Million)
- 12.4.14. Indonesia
- 12.4.14.1. Overview
- 12.4.14.2. Market Analysis, Forecast, and Y-O-Y Growth Rate, 2019 - 2032, (US$ Million)
- 12.4.14.3. Indonesia Market Size and Forecast, By Product Type, 2019 - 2032 (US$ Million)
- 12.4.14.4. Indonesia Market Size and Forecast, By Test Type, 2019 - 2032 (US$ Million)
- 12.4.14.5. Indonesia Market Size and Forecast, By Technology, 2019 - 2032 (US$ Million)
- 12.4.14.6. Indonesia Market Size and Forecast, By Indication Coverage, 2019 - 2032 (US$ Million)
- 12.4.14.7. Indonesia Market Size and Forecast, By End User, 2019 - 2032 (US$ Million)
- 12.4.15. Thailand
- 12.4.15.1. Overview
- 12.4.15.2. Market Analysis, Forecast, and Y-O-Y Growth Rate, 2019 - 2032, (US$ Million)
- 12.4.15.3. Thailand Market Size and Forecast, By Product Type, 2019 - 2032 (US$ Million)
- 12.4.15.4. Thailand Market Size and Forecast, By Test Type, 2019 - 2032 (US$ Million)
- 12.4.15.5. Thailand Market Size and Forecast, By Technology, 2019 - 2032 (US$ Million)
- 12.4.15.6. Thailand Market Size and Forecast, By Indication Coverage, 2019 - 2032 (US$ Million)
- 12.4.15.7. Thailand Market Size and Forecast, By End User, 2019 - 2032 (US$ Million)
- 12.4.16. Philippines
- 12.4.16.1. Overview
- 12.4.16.2. Market Analysis, Forecast, and Y-O-Y Growth Rate, 2019 - 2032, (US$ Million)
- 12.4.16.3. Philippines Market Size and Forecast, By Product Type, 2019 - 2032 (US$ Million)
- 12.4.16.4. Philippines Market Size and Forecast, By Test Type, 2019 - 2032 (US$ Million)
- 12.4.16.5. Philippines Market Size and Forecast, By Technology, 2019 - 2032 (US$ Million)
- 12.4.16.6. Philippines Market Size and Forecast, By Indication Coverage, 2019 - 2032 (US$ Million)
- 12.4.16.7. Philippines Market Size and Forecast, By End User, 2019 - 2032 (US$ Million)
- 12.4.17. Rest of APAC
- 12.4.17.1. Overview
- 12.4.17.2. Market Analysis, Forecast, and Y-O-Y Growth Rate, 2019 - 2032, (US$ Million)
- 12.4.17.3. Rest of APAC Market Size and Forecast, By Product Type, 2019 - 2032 (US$ Million)
- 12.4.17.4. Rest of APAC Market Size and Forecast, By Test Type, 2019 - 2032 (US$ Million)
- 12.4.17.5. Rest of APAC Market Size and Forecast, By Technology, 2019 - 2032 (US$ Million)
- 12.4.17.6. Rest of APAC Market Size and Forecast, By Indication Coverage, 2019 - 2032 (US$ Million)
- 12.4.17.7. Rest of APAC Market Size and Forecast, By End User, 2019 - 2032 (US$ Million)
- 12.5. Latin America (LATAM)
- 12.5.1. Overview
- 12.5.2. Cell & Gene Therapy Bioanalytical Testing Services Key Manufacturers in Latin America
- 12.5.3. LATAM Market Size and Forecast, By Country, 2019 - 2032 (US$ Million)
- 12.5.4. LATAM Market Size and Forecast, By Product Type, 2019 - 2032 (US$ Million)
- 12.5.5. LATAM Market Size and Forecast, By Test Type, 2019 - 2032 (US$ Million)
- 12.5.6. LATAM Market Size and Forecast, By Technology, 2019 - 2032 (US$ Million)
- 12.5.7. LATAM Market Size and Forecast, By Indication Coverage, 2019 - 2032 (US$ Million)
- 12.5.8. LATAM Size and Forecast, By End User, 2019 - 2032 (US$ Million)
- 12.5.9. Brazil
- 12.5.9.1. Overview
- 12.5.9.2. Market Analysis, Forecast, and Y-O-Y Growth Rate, 2019 - 2032, (US$ Million)
- 12.5.9.3. Brazil Market Size and Forecast, By Product Type, 2019 - 2032 (US$ Million)
- 12.5.9.4. Brazil Market Size and Forecast, By Test Type, 2019 - 2032 (US$ Million)
- 12.5.9.5. Brazil Market Size and Forecast, By Technology, 2019 - 2032 (US$ Million)
- 12.5.9.6. Brazil Market Size and Forecast, By Indication Coverage, 2019 - 2032 (US$ Million)
- 12.5.9.7. Brazil Market Size and Forecast, By End User, 2019 - 2032 (US$ Million)
- 12.5.10. Mexico
- 12.5.10.1. Overview
- 12.5.10.2. Market Analysis, Forecast, and Y-O-Y Growth Rate, 2019 - 2032, (US$ Million)
- 12.5.10.3. Mexico Market Size and Forecast, By Product Type, 2019 - 2032 (US$ Million)
- 12.5.10.4. Mexico Market Size and Forecast, By Test Type, 2019 - 2032 (US$ Million)
- 12.5.10.5. Mexico Market Size and Forecast, By Technology, 2019 - 2032 (US$ Million)
- 12.5.10.6. Mexico Market Size and Forecast, By Indication Coverage, 2019 - 2032 (US$ Million)
- 12.5.10.7. Mexico Market Size and Forecast, By End User, 2019 - 2032 (US$ Million)
- 12.5.11. Argentina
- 12.5.11.1. Overview
- 12.5.11.2. Market Analysis, Forecast, and Y-O-Y Growth Rate, 2019 - 2032, (US$ Million)
- 12.5.11.3. Argentina Market Size and Forecast, By Product Type, 2019 - 2032 (US$ Million)
- 12.5.11.4. Argentina Market Size and Forecast, By Test Type, 2019 - 2032 (US$ Million)
- 12.5.11.5. Argentina Market Size and Forecast, By Technology, 2019 - 2032 (US$ Million)
- 12.5.11.6. Argentina Market Size and Forecast, By Indication Coverage, 2019 - 2032 (US$ Million)
- 12.5.11.7. Argentina Market Size and Forecast, By End User, 2019 - 2032 (US$ Million)
- 12.5.12. Colombia
- 12.5.12.1. Overview
- 12.5.12.2. Market Analysis, Forecast, and Y-O-Y Growth Rate, 2019 - 2032, (US$ Million)
- 12.5.12.3. Colombia Market Size and Forecast, By Product Type, 2019 - 2032 (US$ Million)
- 12.5.12.4. Colombia Market Size and Forecast, By Test Type, 2019 - 2032 (US$ Million)
- 12.5.12.5. Colombia Market Size and Forecast, By Technology, 2019 - 2032 (US$ Million)
- 12.5.12.6. Colombia Market Size and Forecast, By Indication Coverage, 2019 - 2032 (US$ Million)
- 12.5.12.7. Colombia Market Size and Forecast, By End User, 2019 - 2032 (US$ Million)
- 12.5.13. Rest of LATAM
- 12.5.13.1. Overview
- 12.5.13.2. Market Analysis, Forecast, and Y-O-Y Growth Rate, 2019 - 2032, (US$ Million)
- 12.5.13.3. Rest of LATAM Market Size and Forecast, By Product Type, 2019 - 2032 (US$ Million)
- 12.5.13.4. Rest of LATAM Market Size and Forecast, By Test Type, 2019 - 2032 (US$ Million)
- 12.5.13.5. Rest of LATAM Market Size and Forecast, By Technology, 2019 - 2032 (US$ Million)
- 12.5.13.6. Rest of LATAM Market Size and Forecast, By Indication Coverage, 2019 - 2032 (US$ Million)
- 12.5.13.7. Rest of LATAM Market Size and Forecast, By End User, 2019 - 2032 (US$ Million)
- 12.6. Middle East and Africa
- 12.6.1. Overview
- 12.6.2. Cell & Gene Therapy Bioanalytical Testing Services Key Manufacturers in Middle East and Africa
- 12.6.3. Middle East and Africa Market Size and Forecast, By Country, 2019 - 2032 (US$ Million)
- 12.6.4. Middle East and Africa Market Size and Forecast, By Product Type, 2019 - 2032 (US$ Million)
- 12.6.5. Middle East and Africa Market Size and Forecast, By Test Type, 2019 - 2032 (US$ Million)
- 12.6.6. Middle East and Africa Market Size and Forecast, By Technology, 2019 - 2032 (US$ Million)
- 12.6.7. Middle East and Africa Market Size and Forecast, By Indication Coverage, 2019 - 2032 (US$ Million)
- 12.6.8. Middle East and Africa Market Size and Forecast, By End User, 2019 - 2032 (US$ Million)
- 12.6.9. Saudi Arabia
- 12.6.9.1. Overview
- 12.6.9.2. Market Analysis, Forecast, and Y-O-Y Growth Rate, 2019 - 2032, (US$ Million)
- 12.6.9.3. Saudi Arabia Market Size and Forecast, By Product Type, 2019 - 2032 (US$ Million)
- 12.6.9.4. Saudi Arabia Market Size and Forecast, By Test Type, 2019 - 2032 (US$ Million)
- 12.6.9.5. Saudi Arabia Market Size and Forecast, By Technology, 2019 - 2032 (US$ Million)
- 12.6.9.6. Saudi Arabia Market Size and Forecast, By Indication Coverage, 2019 - 2032 (US$ Million)
- 12.6.9.7. Saudi Arabia Market Size and Forecast, By End User, 2019 - 2032 (US$ Million)
- 12.6.10. United Arab Emirates
- 12.6.10.1. Overview
- 12.6.10.2. Market Analysis, Forecast, and Y-O-Y Growth Rate, 2019 - 2032, (US$ Million)
- 12.6.10.3. United Arab Emirates Market Size and Forecast, By Product Type, 2019 - 2032 (US$ Million)
- 12.6.10.4. United Arab Emirates Market Size and Forecast, By Test Type, 2019 - 2032 (US$ Million)
- 12.6.10.5. United Arab Emirates Market Size and Forecast, By Technology, 2019 - 2032 (US$ Million)
- 12.6.10.6. United Arab Emirates Market Size and Forecast, By Indication Coverage, 2019 - 2032 (US$ Million)
- 12.6.10.7. United Arab Emirates Market Size and Forecast, By End User, 2019 - 2032 (US$ Million)
- 12.6.11. Israel
- 12.6.11.1. Overview
- 12.6.11.2. Market Analysis, Forecast, and Y-O-Y Growth Rate, 2019 - 2032, (US$ Million)
- 12.6.11.3. Israel Market Size and Forecast, By Product Type, 2019 - 2032 (US$ Million)
- 12.6.11.4. Israel Market Size and Forecast, By Test Type, 2019 - 2032 (US$ Million)
- 12.6.11.5. Israel Market Size and Forecast, By Technology, 2019 - 2032 (US$ Million)
- 12.6.11.6. Israel Market Size and Forecast, By Indication Coverage, 2019 - 2032 (US$ Million)
- 12.6.11.7. Israel Market Size and Forecast, By End User, 2019 - 2032 (US$ Million)
- 12.6.12. Turkey
- 12.6.12.1. Overview
- 12.6.12.2. Market Analysis, Forecast, and Y-O-Y Growth Rate, 2019 - 2032, (US$ Million)
- 12.6.12.3. Turkey Market Size and Forecast, By Product Type, 2019 - 2032 (US$ Million)
- 12.6.12.4. Turkey Market Size and Forecast, By Test Type, 2019 - 2032 (US$ Million)
- 12.6.12.5. Turkey Market Size and Forecast, By Technology, 2019 - 2032 (US$ Million)
- 12.6.12.6. Turkey Market Size and Forecast, By Indication Coverage, 2019 - 2032 (US$ Million)
- 12.6.12.7. Turkey Market Size and Forecast, By End User, 2019 - 2032 (US$ Million)
- 12.6.13. Algeria
- 12.6.13.1. Overview
- 12.6.13.2. Market Analysis, Forecast, and Y-O-Y Growth Rate, 2019 - 2032, (US$ Million)
- 12.6.13.3. Algeria Market Size and Forecast, By Product Type, 2019 - 2032 (US$ Million)
- 12.6.13.4. Algeria Market Size and Forecast, By Test Type, 2019 - 2032 (US$ Million)
- 12.6.13.5. Algeria Market Size and Forecast, By Technology, 2019 - 2032 (US$ Million)
- 12.6.13.6. Algeria Market Size and Forecast, By Indication Coverage, 2019 - 2032 (US$ Million)
- 12.6.13.7. Algeria Market Size and Forecast, By End User, 2019 - 2032 (US$ Million)
- 12.6.14. Egypt
- 12.6.14.1. Overview
- 12.6.14.2. Market Analysis, Forecast, and Y-O-Y Growth Rate, 2019 - 2032, (US$ Million)
- 12.6.14.3. Egypt Market Size and Forecast, By Product Type, 2019 - 2032 (US$ Million)
- 12.6.14.4. Egypt Market Size and Forecast, By Test Type, 2019 - 2032 (US$ Million)
- 12.6.14.5. Egypt Market Size and Forecast, By Technology, 2019 - 2032 (US$ Million)
- 12.6.14.6. Egypt Market Size and Forecast, By Indication Coverage, 2019 - 2032 (US$ Million)
- 12.6.14.7. Egypt Market Size and Forecast, By End User, 2019 - 2032 (US$ Million)
- 12.6.15. Rest of MEA
- 12.6.15.1. Overview
- 12.6.15.2. Market Analysis, Forecast, and Y-O-Y Growth Rate, 2019 - 2032, (US$ Million)
- 12.6.15.3. Rest of MEA Market Size and Forecast, By Product Type, 2019 - 2032 (US$ Million)
- 12.6.15.4. Rest of MEA Market Size and Forecast, By Test Type, 2019 - 2032 (US$ Million)
- 12.6.15.5. Rest of MEA Market Size and Forecast, By Technology, 2019 - 2032 (US$ Million)
- 12.6.15.6. Rest of MEA Market Size and Forecast, By Indication Coverage, 2019 - 2032 (US$ Million)
- 12.6.15.7. Rest of MEA Market Size and Forecast, By End User, 2019 - 2032 (US$ Million)
13. Key Vendor Analysis- Cell & Gene Therapy Bioanalytical Testing Services Industry
- 13.1. Competitive Dashboard
- 13.1.1. Competitive Benchmarking
- 13.1.2. Competitive Positioning
- 13.2. Company Profiles
- 13.2.1. Alliance Pharma
- 13.2.2. BioAgilytix Labs
- 13.2.3. Charles River Laboratories
- 13.2.4. Clean Cells
- 13.2.5. Covance Inc.
- 13.2.6. Eurofins Scientific
- 13.2.7. ICON plc
- 13.2.8. Intertek Group Plc
- 13.2.9. IQVIA, Inc.
- 13.2.10. KCAS Bioanalytical Services
- 13.2.11. Laboratory Corporation of America Holdings
- 13.2.12. Pharmaceutical Product Development, Inc. (Thermo Fisher Scientific Inc.)
- 13.2.13. Pharmaron
- 13.2.14. Prolytix
- 13.2.15. SGS SA
- 13.2.16. Syneos Health
- 13.2.17. Others
14. 360 Degree Analyst View
15. Appendix
- 15.1. Research Methodology
- 15.2. References
- 15.3. Abbreviations
- 15.4. Disclaimer
- 15.5. Contact Us

