|
|
市場調査レポート
商品コード
1455695
MI(マテリアルズインフォマティクス)市場:材料タイプ別、技術別、用途別、国別、地域別 - 産業分析、市場規模、市場シェア、予測、2024-2032年Material Informatics Market, By Material Type, By Technique, By Application, By Country, and By Region - Industry Analysis, Market Size, Market Share & Forecast from 2024-2032 |
||||||
|
|||||||
カスタマイズ可能
|
|||||||

| MI(マテリアルズインフォマティクス)市場:材料タイプ別、技術別、用途別、国別、地域別 - 産業分析、市場規模、市場シェア、予測、2024-2032年 |
|
出版日: 2024年03月04日
発行: AnalystView Market Insights
ページ情報: 英文 269 Pages
納期: 2~3営業日
|

全表示
- 概要
- 図表
- 目次
レポートハイライト
MI(マテリアルズインフォマティクス)市場規模は2023年に2億143万米ドルとなり、2024年から2032年にかけて28.45%のCAGRで拡大
MI市場-市場力学
MIと人工知能(AI)の統合が進み、市場の成長を支配すると予想されます。
MIをAIと組み合わせることで、幅広い用途で特定の要件を満たすように材料をカスタマイズし、改良することが可能になります。このパーソナライズされたアプローチは、エレクトロニクス、ヘルスケア、エネルギー、航空宇宙などの分野で、より効率的で高性能な材料を生み出す可能性を秘めています。AIの統計によると、企業の54%がAIを費用対効果の高いソリューションと考えており、2024年までにAIをビジネス戦略に組み込むことの重要性が浮き彫りになっています。MIは、材料の発見、開発、最適化のプロセスを加速するために、計算技術、データ分析、AI手法を採用しています。さまざまな用途に合わせて特性を調整した材料を製造できるようになることで、さまざまな業界に多くの機会がもたらされます。しかし、透明性の欠如が市場の拡大を妨げる可能性があります。
MI市場-主な洞察
当社のリサーチアナリストが共有した分析によると、世界市場は予測期間(2024-2032年)に約28.45%のCAGRで毎年成長すると推定されます。
材料タイプセグメンテーションに基づくと、エレメントが2023年に最大市場シェアを示すと予測されました。
技術のセグメンテーションに基づくと、2023年には統計分析が主要タイプでした。
用途別では、2023年にはマテリアルサイエンスが主要タイプでした。
地域別では、北米が2023年の主要収益源でした。
MI市場-セグメンテーション分析:
世界のMI市場は、材料タイプ、技術、用途、地域に基づいてセグメント化されます。
市場は材料タイプによって3つのセクションに分類される:エレメント、化学、その他です。エレメントは市場の大半のシェアを占めています。MI市場でこれらの要素を活用することで、様々な産業、用途、地域の明確なニーズと需要に応える、より正確で集中的なアプローチが可能になります。
市場は技術によって4つのグループに区分される:Deep Tensor、デジタルアニーラ、遺伝的アルゴリズム、統計分析です。統計分析が最大の市場シェアを占めています。統計分析はデータ可視化手法と組み合わされることが多いです。プロット、チャート、グラフを活用してデータを可視化することで、複雑なデータセット内の動向、パターン、相関関係を理解するのに役立ちます。
市場は用途によって5つのカテゴリーに区分される:化学・製薬、マテリアルサイエンス、製造、食品科学、エネルギー、その他です。マテリアルサイエンスが最大の市場シェアを占めています。MIは、規制に適合した特定の特性を持つ環境に優しい材料を開発する上で重要な役割を果たし、市場拡大を牽引しています。
MI市場-地理的洞察
地理的には、この市場は北米、ラテンアメリカ、欧州、アジア太平洋、中東アフリカにまたがっています。これらの地域は、事業活動に関与する国に基づいてさらに分類されます。市場の成長は北米が牽引すると予想されるが、これは主に材料情報学の分野でデータマイニングと機械学習の採用が増加しているためです。北米は、材料情報学に不可欠なデータマイニング、機械学習、人工知能(AI)の進歩の最前線にあります。機械学習統計によると、米国は2023年に567億5,000万米ドルと予測され、機械学習の最大の市場規模を保持しています。欧州は、エレクトロニクス、化学など様々な分野で研究開発活動が活発化していることから、市場成長において2番目に大きな地域となっています。
MI市場-競合情勢:
MIソフトウェアの専門企業は、データ分析、モデリング、シミュレーション、予測分析のための包括的ソリューションを提供するために競合しています。これらのソフトウェアプラットフォームは、研究者やエンジニアが特定の特性を持つ材料を効果的に探索、分析、設計できるようにします。自動車、航空宇宙、エレクトロニクス、エネルギー、ヘルスケアなどの業界は、新素材の発見、製造プロセスの最適化、製品性能の向上を迅速に行うためにMIを活用しています。これらの業界のプレーヤーは、社内の研究開発に投資し、ソフトウェアプロバイダーや研究機関と協力し、競争上の優位性を得るためにMI・ソリューションを導入しています。
目次
第1章 MI市場概要
- 調査範囲
- 市場推定年数
第2章 エグゼクティブサマリー
- 市場内訳
- 競合考察
第3章 MIの主要な市場動向
- 市場促進要因
- 市場抑制要因
- 市場機会
- 今後の市場動向
第4章 MI産業の調査
- PEST分析
- ポーターのファイブフォース分析
- 成長見通しのマッピング
- 規制枠組みの分析
第5章 MI市場:COVID-19の影響分析
- COVID-19以前の影響分析
- COVID-19後の影響分析
第6章 MI市場情勢
- MI市場シェア分析、2023年
- 主要メーカー別の内訳データ
- 既存企業の分析
- 新興企業の分析
第7章 MI市場-材料タイプ別
- 概要
- 材料タイプ別のセグメントシェア分析
- エレメント
- 化学
- その他
第8章 MI市場-技術別
- 概要
- 技術別のセグメントシェア分析
- Deep Tensor
- デジタルアニーラ
- 遺伝的アルゴリズム
- 統計分析
第9章 MI市場-用途別
- 概要
- 用途別のセグメントシェア分析
- 化学・医薬品
- マテリアルサイエンス
- 製造
- 食品科学
- エネルギー
- その他
第10章 MI市場-地域別
- イントロダクション
- 北米
- 概要
- 北米の主要メーカー
- 米国
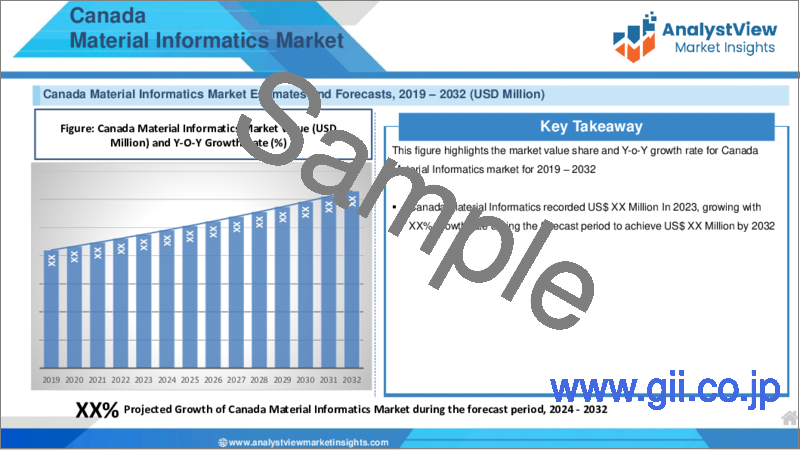
- カナダ
- 欧州
- 概要
- 欧州の主要メーカー
- ドイツ
- イタリア
- 英国
- フランス
- ロシア
- オランダ
- スウェーデン
- ポーランド
- その他
- アジア太平洋(APAC)
- 概要
- アジア太平洋地域の主要メーカー
- インド
- 中国
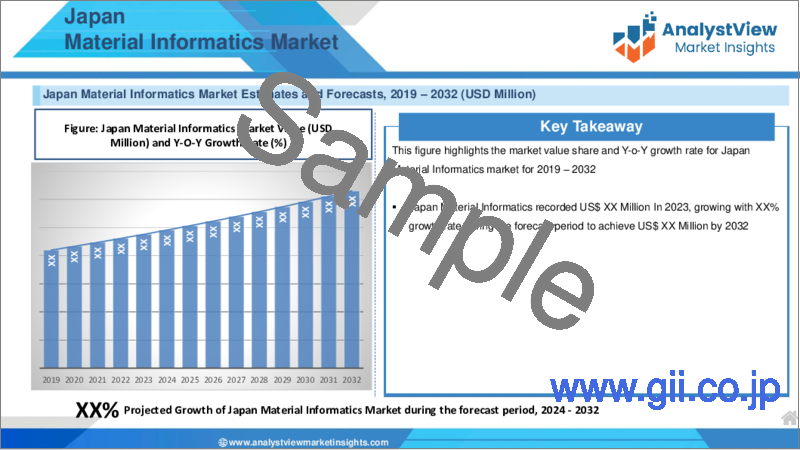
- 日本
- 韓国
- オーストラリア
- タイ
- インドネシア
- フィリピン
- その他
- ラテンアメリカ
- 概要
- ラテンアメリカの主要メーカー
- ブラジル
- メキシコ
- アルゼンチン
- コロンビア
- その他
- 中東とアフリカ
- 概要
- 中東とアフリカの主要メーカー
- サウジアラビア
- アラブ首長国連邦
- イスラエル
- トルコ
- アルジェリア
- エジプト
- その他
第11章 主要ベンダー分析-MI産業
- 競合ダッシュボード
- 企業プロファイル
- AI Materia
- Exabyte.io
- Alpine Electronics Inc.
- Citrine Informatics
- Dassault Systems
- Kebotix
- Hitachi High-Tech
- Schrodinger
- Materials Zone Ltd.
- MaterialsDesign
- MAT3RA
- Nutonian Inc.
- Noble.AI
- Phaseshift Technologies
- Tilde Materials Informatics
- Others
第12章 アナリストの全方位展望
List of Tables
- TABLE List of data sources
- TABLE Market drivers; Impact Analysis
- TABLE Market restraints; Impact Analysis
- TABLE Material Informatics Market: Material Type Snapshot (2023)
- TABLE Segment Dashboard; Definition and Scope, by Material Type
- TABLE Global Material Informatics Market, by Material Type 2019-2032 (USD Million)
- TABLE Material Informatics Market: Technique Snapshot (2023)
- TABLE Segment Dashboard; Definition and Scope, by Technique
- TABLE Global Material Informatics Market, by Technique 2019-2032 (USD Million)
- TABLE Material Informatics Market: Application Snapshot (2023)
- TABLE Segment Dashboard; Definition and Scope, by Application
- TABLE Global Material Informatics Market, by Application 2019-2032 (USD Million)
- TABLE Material Informatics Market: Regional snapshot (2023)
- TABLE Segment Dashboard; Definition and Scope, by Region
- TABLE Global Material Informatics Market, by Region 2019-2032 (USD Million)
- TABLE North America Material Informatics Market, by Country, 2019-2032 (USD Million)
- TABLE North America Material Informatics Market, by Material Type, 2019-2032 (USD Million)
- TABLE North America Material Informatics Market, by Technique, 2019-2032 (USD Million)
- TABLE North America Material Informatics Market, by Application, 2019-2032 (USD Million)
- TABLE Europe Material Informatics Market, by Country, 2019-2032 (USD Million)
- TABLE Europe Material Informatics Market, by Material Type, 2019-2032 (USD Million)
- TABLE Europe Material Informatics Market, by Technique, 2019-2032 (USD Million)
- TABLE Europe Material Informatics Market, by Application, 2019-2032 (USD Million)
- TABLE Asia Pacific Material Informatics Market, by Country, 2019-2032 (USD Million)
- TABLE Asia Pacific Material Informatics Market, by Material Type, 2019-2032 (USD Million)
- TABLE Asia Pacific Material Informatics Market, by Technique, 2019-2032 (USD Million)
- TABLE Asia Pacific Material Informatics Market, by Application, 2019-2032 (USD Million)
- TABLE Latin America Material Informatics Market, by Country, 2019-2032 (USD Million)
- TABLE Latin America Material Informatics Market, by Material Type, 2019-2032 (USD Million)
- TABLE Latin America Material Informatics Market, by Technique, 2019-2032 (USD Million)
- TABLE Latin America Material Informatics Market, by Application, 2019-2032 (USD Million)
- TABLE Middle East and Africa Material Informatics Market, by Country, 2019-2032 (USD Million)
- TABLE Middle East and Africa Material Informatics Market, by Material Type, 2019-2032 (USD Million)
- TABLE Middle East and Africa Material Informatics Market, by Technique, 2019-2032 (USD Million)
- TABLE Middle East and Africa Material Informatics Market, by Application, 2019-2032 (USD Million)
REPORT HIGHLIGHT
Material Informatics Market size was valued at USD 201.43 Million in 2023, expanding at a CAGR of 28.45% from 2024 to 2032.
Materials Informatics is an effort that aims to enhance the efficiency of materials development through the utilization of informatics methods, such as statistical analysis. In recent times, there has been a widespread application of these methods in the field of materials, due to the digitization of data and the availability of powerful computing equipment like supercomputers. These advancements have enabled researchers to analyze experiments and papers, thereby predicting the molecular structure and manufacturing techniques of materials. Materials Informatics encompasses a range of technologies from various fields, including properties theory, experiments, simulations, databases, cloud computing, security, and machine learning. It is considered a fusion of materials science and information science, and its application has been greatly accelerated by technological advancements in both domains. Governments around the world are actively investing in materials informatics, with the Obama administration in the U.S. allocating approximately 200 million dollars to promote its development.
Material Informatics Market- Market Dynamics
Increasing integration of material informatics and Artificial Intelligence (AI) is expected to dominate the growth of market.
Material informatics, when combined with AI, allows for the customization and improvement of materials to meet specific requirements in a wide range of applications. This personalized approach has the potential to create more efficient and high-performing materials in sectors such as electronics, healthcare, energy, and aerospace. According to AI statistics, 54% of companies consider AI to be a cost-effective solution, highlighting the significance of integrating AI into business strategies by 2024. Material informatics employs computational techniques, data analysis, and AI methods to accelerate the process of discovering, developing, and optimizing materials. The ability to produce materials with tailored properties for various uses presents numerous opportunities across different industries. However, a lack of transparency could hinder the expansion of the market.
Material Informatics Market- Key Insights
As per the analysis shared by our research analyst, the global market is estimated to grow annually at a CAGR of around 28.45% over the forecast period (2024-2032)
Based on Material Type segmentation, Elements was predicted to show maximum market share in the year 2023
Based on Technique segmentation, Statistical Analysis was the leading type in 2023
Based on Application segmentation, Material Types Science was the leading type in 2023
On the basis of region, North America was the leading revenue generator in 2023
Material Informatics Market- Segmentation Analysis:
The Global Material Informatics Market is segmented on the basis of Material Type, Technique, Application, and Region.
The market is categorized into three sections according to the Material Type: Elements, Chemical, and Others. Elements hold the majority share in the market. The utilization of these elements in the material informatics market enables a more precise and focused approach to cater to the distinct needs and demands of various industries, applications, and regions.
The market is segmented into four groups according to Technique: Deep Tensor, Digital Annealer, Genetic Algorithm, and Statistical Analysis. Statistical Analysis holds the largest market share. Statistical analysis is frequently paired with data visualization methods. Utilizing plots, charts, and graphs to visualize data can aid in comprehending trends, patterns, and correlations within complex datasets.
The market is segmented into five categories according to Application: Chemical & Pharmaceutical, Material Types Science, Manufacturing, Food Science, Energy, and Others. Material Types Science holds the largest market share. Material informatics plays a key role in developing eco-friendly materials with specific properties that comply with regulations, thus driving market expansion.
Material Informatics Market- Geographical Insights
Geographically, this market spans across North America, Latin America, Europe, Asia Pacific, and the Middle East and Africa. These regions are further categorized based on the countries involved in business activities. The growth of the market is expected to be driven by North America, primarily due to the increasing adoption of data mining and machine learning in the field of material informatics. North America has been at the forefront of advancements in data mining, machine learning, and artificial intelligence (AI), which are integral to material informatics. The United States holds the largest market size for machine learning, with the projected value of USD56.75 billion in 2023, according to Machine Learning Statistics. Europe holds the second largest region for market growth, attributed to the growing research and development activities across various sectors such as electronics, chemicals, and others.
Material Informatics Market- Competitive Landscape:
Specialized companies in material informatics software are in competition to provide comprehensive solutions for data analysis, modeling, simulation, and predictive analytics. These software platforms empower researchers and engineers to effectively explore, analyze, and design materials with specific properties. Industries such as automotive, aerospace, electronics, energy, and healthcare utilize material informatics to expedite the discovery of new materials, optimize manufacturing processes, and improve product performance. These industrial players invest in internal research and development, collaborate with software providers and research institutions, and implement material informatics solutions to gain a competitive advantage.
Recent Developments:
Materials Informatics (MI) is an emerging area of research that involves the utilization of artificial intelligence and deep learning to analyze large volumes of materials data. While traditional materials research has relied heavily on experimentation and researchers' expertise, the potential applications of MI are continuously growing.
In the past few years, companies in the chemical and materials industry have been challenged to create advanced materials that support the concept of a circular economy. Unlike the traditional approach to materials development, which involves time-consuming trial and error processes, there is a growing interest in materials informatics, which integrates materials science with information science.
SCOPE OF THE REPORT
The scope of this report covers the market by its major segments, which include as follows:
GLOBAL MATERIAL INFORMATICS MARKET KEY PLAYERS- DETAILED COMPETITIVE INSIGHTS
AI Materia
Exabyte.io
Alpine Electronics Inc.
Citrine Informatics
Dassault Systems
Kebotix
Hitachi High-Tech
Schrodinger
Materials Zone Ltd.
MaterialsDesign
MAT3RA
Nutonian Inc.
Noble.AI
Phaseshift Technologies
Tilde Materials Informatics
Others
GLOBAL MATERIAL INFORMATICS MARKET, BY MATERIAL TYPE- MARKET ANALYSIS, 2019 - 2032
- Elements
- Chemical
- Others
GLOBAL MATERIAL INFORMATICS MARKET, BY TECHNIQUE- MARKET ANALYSIS, 2019 - 2032
- Deep Tensor
- Digital Annealer
- Genetic Algorithm
- Statistical Analysis
GLOBAL MATERIAL INFORMATICS MARKET, BY APPLICATION- MARKET ANALYSIS, 2019 - \]
- Chemical & Pharmaceutical
- Material Types Science
- Manufacturing
- Food Science
- Energy
- Others
GLOBAL MATERIAL INFORMATICS MARKET, BY REGION- MARKET ANALYSIS, 2019 - 2032
- North America
- The U.S.
- Canada
- Europe
- Germany
- France
- Italy
- Spain
- United Kingdom
- Russia
- Netherlands
- Sweden
- Poland
- Rest of Europe
- Asia Pacific
- India
- China
- South Korea
- Japan
- Australia
- Thailand
- Indonesia
- Philippines
- Rest of APAC
- Latin America
- Brazil
- Mexico
- Argentina
- Colombia
- Rest of LATAM
- The Middle East and Africa
- Saudi Arabia
- United Arab Emirates
- Israel
- Turkey
- Algeria
- Egypt
- Rest of MEA
Table of Contents
1.Material Informatics Market Overview
- 1.1.Study Scope
- 1.2.Market Estimation Years
2.Executive Summary
- 2.1.Market Snippet
- 2.1.1.Material Informatics Market Snippet by Material Type
- 2.1.2.Material Informatics Market Snippet by Technique
- 2.1.3.Material Informatics Market Snippet by Application
- 2.1.4.Material Informatics Market Snippet by Country
- 2.1.5.Material Informatics Market Snippet by Region
- 2.2.Competitive Insights
3.Material Informatics Key Market Trends
- 3.1.Material Informatics Market Drivers
- 3.1.1.Impact Analysis of Market Drivers
- 3.2.Material Informatics Market Restraints
- 3.2.1.Impact Analysis of Market Restraints
- 3.3.Material Informatics Market Opportunities
- 3.4.Material Informatics Market Future Trends
4.Material Informatics Industry Study
- 4.1.PEST Analysis
- 4.2.Porter's Five Forces Analysis
- 4.3.Growth Prospect Mapping
- 4.4.Regulatory Framework Analysis
5.Material Informatics Market: COVID-19 Impact Analysis
- 5.1.Pre-COVID-19 Impact Analysis
- 5.2.Post-COVID-19 Impact Analysis
- 5.2.1.Top Performing Segments
- 5.2.2.Marginal Growth Segments
- 5.2.3.Top Looser Segments
- 5.2.4.Marginal Loss Segments
6.Material Informatics Market Landscape
- 6.1.Material Informatics Market Share Analysis, 2023
- 6.2.Breakdown Data, by Key Manufacturer
- 6.2.1.Established Players' Analysis
- 6.2.2.Emerging Players' Analysis
7.Material Informatics Market - By Material Type
- 7.1.Overview
- 7.1.1.Segment Share Analysis, By Material Type, 2023 & 2032 (%)
- 7.1.2.Elements
- 7.1.3.Chemical
- 7.1.4.Others
8.Material Informatics Market - By Technique
- 8.1.Overview
- 8.1.1.Segment Share Analysis, By Technique, 2023 & 2032 (%)
- 8.1.2.Deep Tensor
- 8.1.3.Digital Annealer
- 8.1.4.Genetic Algorithm
- 8.1.5.Statistical Analysis
9.Material Informatics Market - By Application
- 9.1.Overview
- 9.1.1.Segment Share Analysis, By Application, 2023 & 2032 (%)
- 9.1.2.Chemical & Pharmaceutical
- 9.1.3.Material Types Science
- 9.1.4.Manufacturing
- 9.1.5.Food Science
- 9.1.6.Energy
- 9.1.7.Others
10.Material Informatics Market- By Geography
- 10.1.Introduction
- 10.1.1.Segment Share Analysis, By Geography, 2023 & 2032 (%)
- 10.2.North America
- 10.2.1.Overview
- 10.2.2.Material Informatics Key Manufacturers in North America
- 10.2.3.North America Market Size and Forecast, By Country, 2019 - 2032 (US$ Million)
- 10.2.4.North America Market Size and Forecast, By Material Type, 2019 - 2032 (US$ Million)
- 10.2.5.North America Market Size and Forecast, By Technique, 2019 - 2032 (US$ Million)
- 10.2.6.North America Market Size and Forecast, By Application, 2019 - 2032 (US$ Million)
- 10.2.7.U.S.
- 10.2.7.1.Overview
- 10.2.7.2.Market Analysis, Forecast, and Y-O-Y Growth Rate, 2019 - 2032, (US$ Million)
- 10.2.7.3.U.S. Market Size and Forecast, By Material Type, 2019 - 2032 (US$ Million)
- 10.2.7.4.U.S. Market Size and Forecast, By Technique, 2019 - 2032 (US$ Million)
- 10.2.7.5.U.S. Market Size and Forecast, By Application, 2019 - 2032 (US$ Million)
- 10.2.8.Canada
- 10.2.8.1.Overview
- 10.2.8.2.Market Analysis, Forecast, and Y-O-Y Growth Rate, 2019 - 2032, (US$ Million)
- 10.2.8.3.Canada Market Size and Forecast, By Material Type, 2019 - 2032 (US$ Million)
- 10.2.8.4.Canada Market Size and Forecast, By Technique, 2019 - 2032 (US$ Million)
- 10.2.8.5.Canada Market Size and Forecast, By Application, 2019 - 2032 (US$ Million)
- 10.3.Europe
- 10.3.1.Overview
- 10.3.2.Material Informatics Key Manufacturers in Europe
- 10.3.3.Europe Market Size and Forecast, By Country, 2019 - 2032 (US$ Million)
- 10.3.4.Europe Market Size and Forecast, By Material Type, 2019 - 2032 (US$ Million)
- 10.3.5.Europe Market Size and Forecast, By Technique, 2019 - 2032 (US$ Million)
- 10.3.6.Europe Market Size and Forecast, By Application, 2019 - 2032 (US$ Million)
- 10.3.7.Germany
- 10.3.7.1.Overview
- 10.3.7.2.Market Analysis, Forecast, and Y-O-Y Growth Rate, 2019 - 2032, (US$ Million)
- 10.3.7.3.Germany Market Size and Forecast, By Material Type, 2019 - 2032 (US$ Million)
- 10.3.7.4.Germany Market Size and Forecast, By Technique, 2019 - 2032 (US$ Million)
- 10.3.7.5.Germany Market Size and Forecast, By Application, 2019 - 2032 (US$ Million)
- 10.3.8.Italy
- 10.3.8.1.Overview
- 10.3.8.2.Market Analysis, Forecast, and Y-O-Y Growth Rate, 2019 - 2032, (US$ Million)
- 10.3.8.3.Italy Market Size and Forecast, By Material Type, 2019 - 2032 (US$ Million)
- 10.3.8.4.Italy Market Size and Forecast, By Technique, 2019 - 2032 (US$ Million)
- 10.3.8.5.Italy Market Size and Forecast, By Application, 2019 - 2032 (US$ Million)
- 10.3.9.United Kingdom
- 10.3.9.1.Overview
- 10.3.9.2.Market Analysis, Forecast, and Y-O-Y Growth Rate, 2019 - 2032, (US$ Million)
- 10.3.9.3.United Kingdom Market Size and Forecast, By Material Type, 2019 - 2032 (US$ Million)
- 10.3.9.4.United Kingdom Market Size and Forecast, By Technique, 2019 - 2032 (US$ Million)
- 10.3.9.5.United Kingdom Market Size and Forecast, By Application, 2019 - 2032 (US$ Million)
- 10.3.10.France
- 10.3.10.1.Overview
- 10.3.10.2.Market Analysis, Forecast, and Y-O-Y Growth Rate, 2019 - 2032, (US$ Million)
- 10.3.10.3.France Market Size and Forecast, By Material Type, 2019 - 2032 (US$ Million)
- 10.3.10.4.France Market Size and Forecast, By Technique, 2019 - 2032 (US$ Million)
- 10.3.10.5.France Market Size and Forecast, By Application, 2019 - 2032 (US$ Million)
- 10.3.11.Russia
- 10.3.11.1.Market Analysis, Forecast, and Y-O-Y Growth Rate, 2019 - 2032, (US$ Million)
- 10.3.11.2.Russia Market Size and Forecast, By Material Type, 2019 - 2032 (US$ Million)
- 10.3.11.3.Russia Market Size and Forecast, By Technique, 2019 - 2032 (US$ Million)
- 10.3.11.4.Russia Market Size and Forecast, By Application, 2019 - 2032 (US$ Million)
- 10.3.12.Netherlands
- 10.3.12.1.Market Analysis, Forecast, and Y-O-Y Growth Rate, 2019 - 2032, (US$ Million)
- 10.3.12.2.Netherlands Market Size and Forecast, By Material Type, 2019 - 2032 (US$ Million)
- 10.3.12.3.Netherlands Market Size and Forecast, By Technique, 2019 - 2032 (US$ Million)
- 10.3.12.4.Netherlands Market Size and Forecast, By Application, 2019 - 2032 (US$ Million)
- 10.3.13.Sweden
- 10.3.13.1.Market Analysis, Forecast, and Y-O-Y Growth Rate, 2019 - 2032, (US$ Million)
- 10.3.13.2.Sweden Market Size and Forecast, By Material Type, 2019 - 2032 (US$ Million)
- 10.3.13.3.Sweden Market Size and Forecast, By Technique, 2019 - 2032 (US$ Million)
- 10.3.13.4.Sweden Market Size and Forecast, By Application, 2019 - 2032 (US$ Million)
- 10.3.14.Poland
- 10.3.14.1.Market Analysis, Forecast, and Y-O-Y Growth Rate, 2019 - 2032, (US$ Million)
- 10.3.14.2.Poland Market Size and Forecast, By Material Type, 2019 - 2032 (US$ Million)
- 10.3.14.3.Poland Market Size and Forecast, By Technique, 2019 - 2032 (US$ Million)
- 10.3.14.4.Poland Market Size and Forecast, By Application, 2019 - 2032 (US$ Million)
- 10.3.15.Rest of Europe
- 10.3.15.1.Overview
- 10.3.15.2.Market Analysis, Forecast, and Y-O-Y Growth Rate, 2019 - 2032, (US$ Million)
- 10.3.15.3.Rest of the Europe Market Size and Forecast, By Material Type, 2019 - 2032 (US$ Million)
- 10.3.15.4.Rest of the Europe Market Size and Forecast, By Technique, 2019 - 2032 (US$ Million)
- 10.3.15.5.Rest of the Europe Market Size and Forecast, By Application, 2019 - 2032 (US$ Million)
- 10.4.Asia Pacific (APAC)
- 10.4.1.Overview
- 10.4.2.Material Informatics Key Manufacturers in Asia Pacific
- 10.4.3.Asia Pacific Market Size and Forecast, By Country, 2019 - 2032 (US$ Million)
- 10.4.4.Asia Pacific Market Size and Forecast, By Material Type, 2019 - 2032 (US$ Million)
- 10.4.5.Asia Pacific Market Size and Forecast, By Technique, 2019 - 2032 (US$ Million)
- 10.4.6.Asia Pacific Market Size and Forecast, By Application, 2019 - 2032 (US$ Million)
- 10.4.7.India
- 10.4.7.1.Overview
- 10.4.7.2.Market Analysis, Forecast, and Y-O-Y Growth Rate, 2019 - 2032, (US$ Million)
- 10.4.7.3.India Market Size and Forecast, By Material Type, 2019 - 2032 (US$ Million)
- 10.4.7.4.India Market Size and Forecast, By Technique, 2019 - 2032 (US$ Million)
- 10.4.7.5.India Market Size and Forecast, By Application, 2019 - 2032 (US$ Million)
- 10.4.8.China
- 10.4.8.1.Overview
- 10.4.8.2.Market Analysis, Forecast, and Y-O-Y Growth Rate, 2019 - 2032, (US$ Million)
- 10.4.8.3.China Market Size and Forecast, By Material Type, 2019 - 2032 (US$ Million)
- 10.4.8.4.China Market Size and Forecast, By Technique, 2019 - 2032 (US$ Million)
- 10.4.8.5.China Market Size and Forecast, By Application, 2019 - 2032 (US$ Million)
- 10.4.9.Japan
- 10.4.9.1.Overview
- 10.4.9.2.Market Analysis, Forecast, and Y-O-Y Growth Rate, 2019 - 2032, (US$ Million)
- 10.4.9.3.Japan Market Size and Forecast, By Material Type, 2019 - 2032 (US$ Million)
- 10.4.9.4.Japan Market Size and Forecast, By Technique, 2019 - 2032 (US$ Million)
- 10.4.9.5.Japan Market Size and Forecast, By Application, 2019 - 2032 (US$ Million)
- 10.4.10.South Korea
- 10.4.10.1.Overview
- 10.4.10.2.Market Analysis, Forecast, and Y-O-Y Growth Rate, 2019 - 2032, (US$ Million)
- 10.4.10.3.South Korea Market Size and Forecast, By Material Type, 2019 - 2032 (US$ Million)
- 10.4.10.4.South Korea Market Size and Forecast, By Technique, 2019 - 2032 (US$ Million)
- 10.4.10.5.South Korea Market Size and Forecast, By Application, 2019 - 2032 (US$ Million)
- 10.4.11.Australia
- 10.4.11.1.Overview
- 10.4.11.2.Market Analysis, Forecast, and Y-O-Y Growth Rate, 2019 - 2032, (US$ Million)
- 10.4.11.3.Australia Market Size and Forecast, By Material Type, 2019 - 2032 (US$ Million)
- 10.4.11.4.Australia Market Size and Forecast, By Technique, 2019 - 2032 (US$ Million)
- 10.4.11.5.Australia Market Size and Forecast, By Application, 2019 - 2032 (US$ Million)
- 10.4.12.Thailand
- 10.4.12.1.Overview
- 10.4.12.2.Market Analysis, Forecast, and Y-O-Y Growth Rate, 2019 - 2032, (US$ Million)
- 10.4.12.3.Thailand Market Size and Forecast, By Material Type, 2019 - 2032 (US$ Million)
- 10.4.12.4.Thailand Market Size and Forecast, By Technique, 2019 - 2032 (US$ Million)
- 10.4.12.5.Thailand Market Size and Forecast, By Application, 2019 - 2032 (US$ Million)
- 10.4.13.Indonesia
- 10.4.13.1.Overview
- 10.4.13.2.Market Analysis, Forecast, and Y-O-Y Growth Rate, 2019 - 2032, (US$ Million)
- 10.4.13.3.Indonesia Market Size and Forecast, By Material Type, 2019 - 2032 (US$ Million)
- 10.4.13.4.Indonesia Market Size and Forecast, By Technique, 2019 - 2032 (US$ Million)
- 10.4.13.5.Indonesia Market Size and Forecast, By Application, 2019 - 2032 (US$ Million)
- 10.4.14.Philippines
- 10.4.14.1.Overview
- 10.4.14.2.Market Analysis, Forecast, and Y-O-Y Growth Rate, 2019 - 2032, (US$ Million)
- 10.4.14.3.Philippines Market Size and Forecast, By Material Type, 2019 - 2032 (US$ Million)
- 10.4.14.4.Philippines Market Size and Forecast, By Technique, 2019 - 2032 (US$ Million)
- 10.4.14.5.Philippines Market Size and Forecast, By Application, 2019 - 2032 (US$ Million)
- 10.4.15.Rest of APAC
- 10.4.15.1.Overview
- 10.4.15.2.Market Analysis, Forecast, and Y-O-Y Growth Rate, 2019 - 2032, (US$ Million)
- 10.4.15.3.Rest of APAC Market Size and Forecast, By Material Type, 2019 - 2032 (US$ Million)
- 10.4.15.4.Rest of APAC Market Size and Forecast, By Technique, 2019 - 2032 (US$ Million)
- 10.4.15.5.Rest of APAC Market Size and Forecast, By Application, 2019 - 2032 (US$ Million)
- 10.5.Latin America
- 10.5.1.Overview
- 10.5.2.Material Informatics Key Manufacturers in Latin America
- 10.5.3.Latin America Market Size and Forecast, By Country, 2019 - 2032 (US$ Million)
- 10.5.4.Latin America Market Size and Forecast, By Material Type, 2019 - 2032 (US$ Million)
- 10.5.5.Latin America Market Size and Forecast, By Technique, 2019 - 2032 (US$ Million)
- 10.5.6.Latin America Market Size and Forecast, By Application, 2019 - 2032 (US$ Million)
- 10.5.7.Brazil
- 10.5.7.1.Overview
- 10.5.7.2.Market Analysis, Forecast, and Y-O-Y Growth Rate, 2019 - 2032, (US$ Million)
- 10.5.7.3.Brazil Market Size and Forecast, By Material Type, 2019 - 2032 (US$ Million)
- 10.5.7.4.Brazil Market Size and Forecast, By Technique, 2019 - 2032 (US$ Million)
- 10.5.7.5.Brazil Market Size and Forecast, By Application, 2019 - 2032 (US$ Million)
- 10.5.8.Mexico
- 10.5.8.1.Overview
- 10.5.8.2.Market Analysis, Forecast, and Y-O-Y Growth Rate, 2019 - 2032, (US$ Million)
- 10.5.8.3.Mexico Market Size and Forecast, By Material Type, 2019 - 2032 (US$ Million)
- 10.5.8.4.Mexico Market Size and Forecast, By Technique, 2019 - 2032 (US$ Million)
- 10.5.8.5.Mexico Market Size and Forecast, By Application, 2019 - 2032 (US$ Million)
- 10.5.9.Argentina
- 10.5.9.1.Overview
- 10.5.9.2.Market Analysis, Forecast, and Y-O-Y Growth Rate, 2019 - 2032, (US$ Million)
- 10.5.9.3.Argentina Market Size and Forecast, By Material Type, 2019 - 2032 (US$ Million)
- 10.5.9.4.Argentina Market Size and Forecast, By Technique, 2019 - 2032 (US$ Million)
- 10.5.9.5.Argentina Market Size and Forecast, By Application, 2019 - 2032 (US$ Million)
- 10.5.10.Colombia
- 10.5.10.1.Overview
- 10.5.10.2.Market Analysis, Forecast, and Y-O-Y Growth Rate, 2019 - 2032, (US$ Million)
- 10.5.10.3.Colombia Market Size and Forecast, By Material Type, 2019 - 2032 (US$ Million)
- 10.5.10.4.Colombia Market Size and Forecast, By Technique, 2019 - 2032 (US$ Million)
- 10.5.10.5.Colombia Market Size and Forecast, By Application, 2019 - 2032 (US$ Million)
- 10.5.11.Rest of LATAM
- 10.5.11.1.Overview
- 10.5.11.2.Market Analysis, Forecast, and Y-O-Y Growth Rate, 2019 - 2032, (US$ Million)
- 10.5.11.3.Rest of LATAM Market Size and Forecast, By Material Type, 2019 - 2032 (US$ Million)
- 10.5.11.4.Rest of LATAM Market Size and Forecast, By Technique, 2019 - 2032 (US$ Million)
- 10.5.11.5.Rest of LATAM Market Size and Forecast, By Application, 2019 - 2032 (US$ Million)
- 10.6.Middle East and Africa
- 10.6.1.Overview
- 10.6.2.Material Informatics Key Manufacturers in Middle East and Africa
- 10.6.3.Middle East and Africa Market Size and Forecast, By Country, 2019 - 2032 (US$ Million)
- 10.6.4.Middle East and Africa Market Size and Forecast, By Material Type, 2019 - 2032 (US$ Million)
- 10.6.5.Middle East and Africa Market Size and Forecast, By Technique, 2019 - 2032 (US$ Million)
- 10.6.6.Middle East and Africa Market Size and Forecast, By Application, 2019 - 2032 (US$ Million)
- 10.6.7.Saudi Arabia
- 10.6.7.1.Overview
- 10.6.7.2.Market Analysis, Forecast, and Y-O-Y Growth Rate, 2019 - 2032, (US$ Million)
- 10.6.7.3.Saudi Arabia Market Size and Forecast, By Material Type, 2019 - 2032 (US$ Million)
- 10.6.7.4.Saudi Arabia Market Size and Forecast, By Technique, 2019 - 2032 (US$ Million)
- 10.6.7.5.Saudi Arabia Market Size and Forecast, By Application, 2019 - 2032 (US$ Million)
- 10.6.8.United Arab Emirates
- 10.6.8.1.Overview
- 10.6.8.2.Market Analysis, Forecast, and Y-O-Y Growth Rate, 2019 - 2032, (US$ Million)
- 10.6.8.3.United Arab Emirates Market Size and Forecast, By Material Type, 2019 - 2032 (US$ Million)
- 10.6.8.4.United Arab Emirates Market Size and Forecast, By Technique, 2019 - 2032 (US$ Million)
- 10.6.8.5.United Arab Emirates Market Size and Forecast, By Application, 2019 - 2032 (US$ Million)
- 10.6.9.Israel
- 10.6.9.1.Overview
- 10.6.9.2.Market Analysis, Forecast, and Y-O-Y Growth Rate, 2019 - 2032, (US$ Million)
- 10.6.9.3.Israel Market Size and Forecast, By Material Type, 2019 - 2032 (US$ Million)
- 10.6.9.4.Israel Market Size and Forecast, By Technique, 2019 - 2032 (US$ Million)
- 10.6.9.5.Israel Market Size and Forecast, By Application, 2019 - 2032 (US$ Million)
- 10.6.10.Turkey
- 10.6.10.1.Overview
- 10.6.10.2.Market Analysis, Forecast, and Y-O-Y Growth Rate, 2019 - 2032, (US$ Million)
- 10.6.10.3.Turkey Market Size and Forecast, By Material Type, 2019 - 2032 (US$ Million)
- 10.6.10.4.Turkey Market Size and Forecast, By Technique, 2019 - 2032 (US$ Million)
- 10.6.10.5.Turkey Market Size and Forecast, By Application, 2019 - 2032 (US$ Million)
- 10.6.11.Algeria
- 10.6.11.1.Overview
- 10.6.11.2.Market Analysis, Forecast, and Y-O-Y Growth Rate, 2019 - 2032, (US$ Million)
- 10.6.11.3.Algeria Market Size and Forecast, By Material Type, 2019 - 2032 (US$ Million)
- 10.6.11.4.Algeria Market Size and Forecast, By Technique, 2019 - 2032 (US$ Million)
- 10.6.11.5.Algeria Market Size and Forecast, By Application, 2019 - 2032 (US$ Million)
- 10.6.12.Egypt
- 10.6.12.1.Overview
- 10.6.12.2.Market Analysis, Forecast, and Y-O-Y Growth Rate, 2019 - 2032, (US$ Million)
- 10.6.12.3.Egypt Market Size and Forecast, By Material Type, 2019 - 2032 (US$ Million)
- 10.6.12.4.Egypt Market Size and Forecast, By Technique, 2019 - 2032 (US$ Million)
- 10.6.12.5.Egypt Market Size and Forecast, By Application, 2019 - 2032 (US$ Million)
- 10.6.13.Rest of MEA
- 10.6.13.1.Overview
- 10.6.13.2.Market Analysis, Forecast, and Y-O-Y Growth Rate, 2019 - 2032, (US$ Million)
- 10.6.13.3.Rest of MEA Market Size and Forecast, By Material Type, 2019 - 2032 (US$ Million)
- 10.6.13.4.Rest of MEA Market Size and Forecast, By Technique, 2019 - 2032 (US$ Million)
- 10.6.13.5.Rest of MEA Market Size and Forecast, By Application, 2019 - 2032 (US$ Million)
11.Key Vendor Analysis- Material Informatics Industry
- 11.1.Competitive Dashboard
- 11.2.Company Profiles
- 11.2.1.AI Materia
- 11.2.2.Exabyte.io
- 11.2.3.Alpine Electronics Inc.
- 11.2.4.Citrine Informatics
- 11.2.5.Dassault Systems
- 11.2.6.Kebotix
- 11.2.7.Hitachi High-Tech
- 11.2.8.Schrodinger
- 11.2.9.Materials Zone Ltd.
- 11.2.10.MaterialsDesign
- 11.2.11.MAT3RA
- 11.2.12.Nutonian Inc.
- 11.2.13.Noble.AI
- 11.2.14.Phaseshift Technologies
- 11.2.15.Tilde Materials Informatics
- 11.2.16.Others
12.360 Degree Analyst View
13.Appendix
- 13.1.Research Methodology
- 13.2.References
- 13.3.Abbreviations
- 13.4.Disclaimer
- 13.5.Contact Us

