|
|
市場調査レポート
商品コード
1364702
ドライミックスモルタル市場:タイプ別、用途別、国別、地域別- 産業分析、市場規模、市場シェア、2023-2030年予測Dry Mix Mortar Market, By Type, By Application, By Country, and By Region - Industry Analysis, Market Size, Market Share & Forecast from 2023-2030 |
||||||
|
|
|||||||
カスタマイズ可能
|
|||||||


| ドライミックスモルタル市場:タイプ別、用途別、国別、地域別- 産業分析、市場規模、市場シェア、2023-2030年予測 |
|
出版日: 2023年10月01日
発行: AnalystView Market Insights
ページ情報: 英文 240 Pages
納期: 2~3営業日
|

- 全表示
- 概要
- 図表
- 目次
レポートハイライト
ドライミックスモルタルの市場規模は2022年に354億890万米ドルとなり、2023年から2030年にかけてCAGR 5.3%で拡大
ドライミックスモルタル市場- 市場力学
インフラ開発プロジェクトの増加が市場成長の原動力となる見込み
インフラ整備プロジェクトの増加は、必然的に建設資材、特にドライモルタルの需要を高めます。世界銀行の新しいデータによると、低・中所得国のインフラ投資は2022年に回復しました。インフラへの民間参加(PPI)のコミットメントは、263のプロジェクトで917億米ドルに達し、2021年から23%増加しました。セメントや骨材の生産、輸送など、建設セクターの多くの部分が炭素に大きな影響を及ぼしています。
セメントのカーボンフットプリントは最も高く、世界のCO2排出量の7%を占めています。最大の生産国は中国で、次いでインドが23億5,000万トン近くを生産しています。さらに、特殊な特性を持つドライミックスモルタルの技術革新と市場開拓は、市場に成長機会をもたらすと予想されます。さらに、原材料、特にセメント価格の変動が市場の成長を妨げる可能性があります。
ドライミックスモルタル市場-セグメンテーション分析:
ドライミックスモルタルの世界市場は、タイプ、用途、地域によって区分されます。
製品はタイプ別に3つに分類される:タイル接着剤、防水、プラスター、グラウト、レンダー、その他。しっくい分野は、繊維と添加物の含有量が高いため、収縮のコントロールがしやすく、作業性、硬化性、浸透性が改善されることから、市場の成長を支配すると予想されます。
市場は用途によって2つのカテゴリーに分類される:非住宅用と住宅用です。非住宅分野が市場を独占しており、予測期間中もその優位性を維持するとみられます。商業ビル、施設、産業、その他の公共構造物などの非住宅プロジェクトにおけるドライモルタルの使用は重要です。ドライミックスモルタルは建設セクターの重要な構成要素です。
ドライミックスモルタル市場-地理的洞察
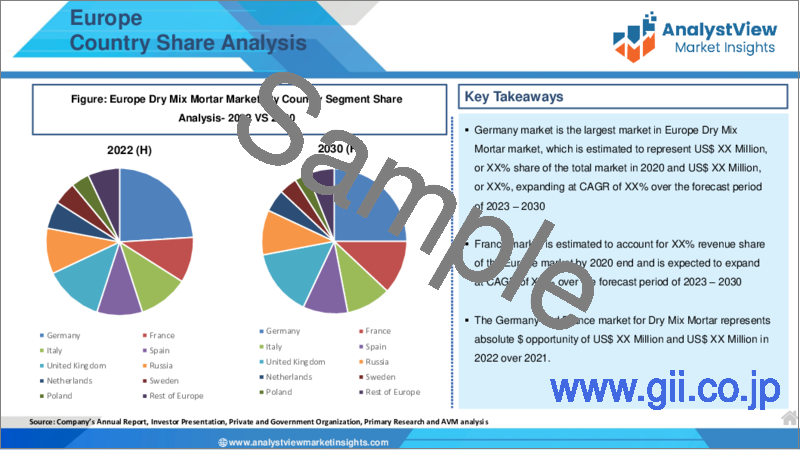
地域的には、この市場は北米、ラテンアメリカ、欧州、アジア太平洋、中東・アフリカの各地域に広がっています。これらの地域は、ビジネスをもたらす国によってさらに分けられます。アジア太平洋地域は、都市化の進展により、市場の成長を支配すると予想されています。都市化と人口増加、経済拡大の結果、建設部門は急速に発展しています。建築業界の成長により、コンクリートやその材料、特に普通ポルトランドセメント(OPC)の需要が高まっています。その結果、建築資材、特に乾式モルタルの需要が大幅に増加しました。何よりも、今後20年間で11億人がこの地域の都市に住むことになります。2030年までに、アジアの人口の55%以上が都市部に住むことになります。アジア開発銀行によれば、アジアの都市は急速に成長しています。北米と欧州は、インフラ整備の増加により、予測期間中にドライミックスモルタル市場の成長を牽引すると予想されます。
ドライミックスモルタル市場-競合情勢:
既存のドライミックスモルタルの競合は、主にコンクリートの強度や硬化コンクリート性能に関連しているが、この競合はセメント系材料の作業性やレオロジー品質に関連しています。メーカーは、最高の流動性と安定性を持つモルタルの組み合わせを設計します。また、新しいドライモルタル・ソリューションを提供することで、ブランドの認知度を高め、小売店の成長にも貢献します。小売チャネルを通じて既存の顧客との関係を活用するという野望を果たすだけでなく、同社の製品は金物店やペンキ店へのリーチを広げています。また、新製品のリリース、流通網開拓、研究開発費、M&Aは、リーチを強化し市場シェアを拡大するために企業が利用する主要な戦術の一部です。例えば、ダウは、建設用ドライミックスの顧客が、この拡大する分野向けの主要添加剤の信頼できる供給を確保できるよう、メチルセルロースの生産能力増強のための一連の投資を発表しました。
目次
第1章 ドライミックスモルタル市場概要
- 調査範囲
- 市場推定年数
第2章 エグゼクティブサマリー
- 市場内訳
- 競合考察
第3章 ドライミックスモルタルの主要な市場動向
- 市場促進要因
- 市場抑制要因
- 市場機会
- 今後の市場動向
第4章 ドライミックスモルタルの応用研究
- PEST分析
- ポーターのファイブフォース分析
- 成長見通しのマッピング
- 規制枠組みの分析
第5章 ドライミックスモルタル市場:COVID-19感染症の影響分析
- 新型コロナウイルス感染症以前の影響分析
- 新型コロナウイルス感染症後の影響分析
第6章 ドライミックスモルタル市場情勢
- ドライミックスモルタル市場シェア分析、2022年
- 主要メーカー別の内訳データ
- 既存企業の分析
- 新興企業の分析
第7章 ドライミックスモルタル市場- タイプ別
- 概要
- タイプ別セグメントシェア分析
- タイル用接着剤
- 防水加工
- 石膏
- グラウト
- 与える
- その他
- タイプ別セグメントシェア分析
第8章 ドライミックスモルタル市場- 用途別
- 概要
- アプリケーション別のセグメントシェア分析
- 非居住
- 住宅
- アプリケーション別のセグメントシェア分析
第9章 ドライミックスモルタル市場-地域別
- イントロダクション
- 北米
- 概要
- 北米の主要メーカー
- 米国
- カナダ
- 欧州
- 概要
- 欧州の主要メーカー
- ドイツ
- イタリア
- 英国
- フランス
- ロシア
- オランダ
- スウェーデン
- ポーランド
- その他
- アジア太平洋(APAC)
- 概要
- アジア太平洋地域の主要メーカー
- インド
- 中国
- 日本
- 韓国
- オーストラリア
- タイ
- インドネシア
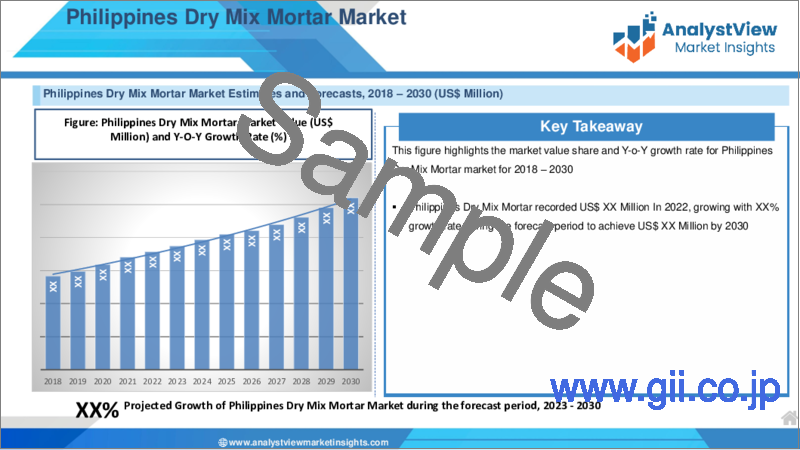
- フィリピン
- その他
- ラテンアメリカ
- 概要
- ラテンアメリカの主要メーカー
- ブラジル
- メキシコ
- アルゼンチン
- コロンビア
- その他
- 中東とアフリカ
- 概要
- 中東およびアフリカの主要メーカー
- サウジアラビア
- アラブ首長国連邦
- イスラエル
- トルコ
- アルジェリア
- エジプト
- その他
第10章 主要ベンダー分析- ドライミックスモルタルの用途
- 競合ダッシュボード
- 企業プロファイル
- Ardex Group
- Saint-Gobain Weber
- Dow
- CEMEX SAB de CV
- Caparol
- LafargeHolcim
- Sika AG
- Dryvit Systems
- Mapei SpA
- Quick-Mix Group
- Knauf
- BASF SE
- Custom Building Products
- Parex Group
- Sakrete
第11章 アナリストの全方位展望
List of Tables
- TABLE List of data sources
- TABLE Market drivers; Impact Analysis
- TABLE Market restraints; Impact Analysis
- TABLE Dry Mix Mortar Market: Type Snapshot (2022)
- TABLE Segment Dashboard; Definition and Scope, by Type
- TABLE Global Dry Mix Mortar Market, by Type 2018-2030 (USD Million)
- TABLE Dry Mix Mortar Market: Application Snapshot (2022)
- TABLE Segment Dashboard; Definition and Scope, by Application
- TABLE Global Dry Mix Mortar Market, by Application 2018-2030 (USD Million)
- TABLE Dry Mix Mortar Market: Regional snapshot (2022)
- TABLE Segment Dashboard; Definition and Scope, by Region
- TABLE Global Dry Mix Mortar Market, by Region 2018-2030 (USD Million)
- TABLE North America Dry Mix Mortar Market, by Country, 2018-2030 (USD Million)
- TABLE North America Dry Mix Mortar Market, by Type, 2018-2030 (USD Million)
- TABLE North America Dry Mix Mortar Market, by Application, 2018-2030 (USD Million)
- TABLE Europe Dry Mix Mortar Market, by Country, 2018-2030 (USD Million)
- TABLE Europe Dry Mix Mortar Market, by Type, 2018-2030 (USD Million)
- TABLE Europe Dry Mix Mortar Market, by Application, 2018-2030 (USD Million)
- TABLE Asia Pacific Dry Mix Mortar Market, by Country, 2018-2030 (USD Million)
- TABLE Asia Pacific Dry Mix Mortar Market, by Type, 2018-2030 (USD Million)
- TABLE Asia Pacific Dry Mix Mortar Market, by Application, 2018-2030 (USD Million)
- TABLE Latin America Dry Mix Mortar Market, by Country, 2018-2030 (USD Million)
- TABLE Latin America Dry Mix Mortar Market, by Type, 2018-2030 (USD Million)
- TABLE Latin America Dry Mix Mortar Market, by Application, 2018-2030 (USD Million)
- TABLE Middle East and Africa Dry Mix Mortar Market, by Country, 2018-2030 (USD Million)
- TABLE Middle East and Africa Dry Mix Mortar Market, by Type, 2018-2030 (USD Million)
- TABLE Middle East and Africa Dry Mix Mortar Market, by Application, 2018-2030 (USD Million)
REPORT HIGHLIGHT
Dry Mix Mortar Market size was valued at USD 35,408.9 Million in 2022, expanding at a CAGR of 5.3% from 2023 to 2030.
Dry Mix Mortar is a dry combination of raw materials such as sand and cement. Additives and polymers may also be included. The raw material the basic building component counts the most in any construction because it is what holds the entire structure together. On building sites, one such raw material is dry mortar. It is typically favored over traditional on-site mixing mortar due to a number of advantages. The main advantage of dry mortar is that it is already prepared with a predetermined formula and packed with the appropriate raw components. All you have to do is mix in the needed amount of water, and the material is ready to use.
Dry Mix Mortar Market- Market Dynamics
Rising infrastructure development projects are expected to drive the growth of the market
Increased infrastructure projects will inevitably raise demand for construction materials, notably dry mortars. New World Bank data finds that infrastructure investments in low- and middle-income countries rebounded in 2022. Private participation in infrastructure (PPI) commitments reached USD91.7 billion across 263 projects, a 23% increase from 2021. Many parts of the construction sector, such as cement and aggregate production and transportation, have a large carbon impact.
Cement has one of the highest carbon footprints, accounting for 7% of global CO2 emissions. China is the greatest producer, followed by India with almost 2350 million metric tons. Furthermore, Innovation and Product Development of Dry Mix Mortar with special properties is expected to provide growth opportunity for the market. Moreover, Fluctuations in the prices of raw materials especially cement may hamper the growth of the market.
Dry Mix Mortar Market- Key Insights
- As per the analysis shared by our research analyst, the global Dry Mix Mortar market is estimated to grow annually at a CAGR of around 5.3% over the forecast period (2023-2030)
- The Dry Mix Mortar market will probably grow due to an increase in eco-friendly and energy-efficient construction projects.
- Based on Type segmentation, the Plaster segment was predicted to show maximum market share in the year 2022
- Based on Application segmentation, Non-Residential sector was the leading type in 2022
- On the basis of region, Asia Pacific was the leading revenue generator in 2022
Dry Mix Mortar Market- Segmentation Analysis:
The Global Dry Mix Mortar Market is segmented on the basis of Type, Application, and Region.
The market is divided into three categories based on product type: Tile Adhesives, Waterproofing, Plaster, Grout, Render, and Others. The plaster segment is expected to dominate the market growth, due to Due to its high content of fibers & additives, which allows better shrinkage control as well as improved workability, curing & permeability.
The market is categorized into two categories based on Application: Non-Residential, and Residential. The non-residential sector dominates the market and is likely to maintain its dominance during the forecast period. The use of dry mortar in non-residential projects, such as commercial buildings, institutions, industries, and other public structures, is significant. Dry Mix Mortar is a crucial component of the construction sector.
Dry Mix Mortar Market- Geographical Insights
Geographically, this market is widespread in the regions of North America, Latin America, Europe, Asia Pacific, and the Middle East and Africa. These regions are further divided as per the nations bringing business. Asia Pacific is expected to dominate the growth of the market, due to Rising Urbanization. The construction sector is quickly developing as a result of increased urbanization and population, as well as economic expansion. The growth of the building industry has raised demand for concrete and its elements, particularly Ordinary Portland Cement (OPC). This has resulted in a huge increase in the demand for building materials, notably dry mortar. Foremost, 1.1 billion people will live in the region's cities in the next 20 years. By 2030, more than 55% of the population of Asia will be urban. Asian cities are growing rapidly, according to the Asian Development Bank. North America and Europe are expected to drive the growth of the Dry Mix Mortar market in the forecast period, owing to increasing infrastructure development.
Dry Mix Mortar Market- Competitive Landscape:
While existing Dry Mix Mortar competitions are primarily concerned with the strength or hardened concrete performance of concrete, this competition will be concerned with the workability and rheological qualities of cement-based materials. Manufacturers design a mortar combination that has the best flowability and stability. Also, they provide new dry-mortar solutions to help increase both brand awareness and retail growth. Apart from fulfilling their ambition to leverage existing customer relationships through retail channels, company products expand their reach to hardware stores and paint shops. Also, New product releases, distribution network development, R&D spending, and mergers and acquisitions are some of the key tactics utilized by corporations to strengthen their reach and expand their market share. For Example, Dow announced a series of incremental methyl cellulose capacity investments to help construction dry mix customers secure a reliable supply of key additives for this expanding area.
Recent Developments:
On 19 August 2022, BASF and Nippon Paint China, a leading coatings manufacturer, collaborated to launch eco-friendly industrial packaging, which was used by the Nippon Paint dry-mixed mortar series products. The innovative packaging material is marketed for Nippon Paint's construction dry mortar products, using BASF's water-based acrylic dispersion Joncryl High-Performance Barrier (HPB). It is the first time in China that BASF's water-based barrier coatings will be employed in industrial packaging.
SCOPE OF THE REPORT
The scope of this report covers the market by its major segments, which include as follows:
GLOBAL DRY MIX MORTAR MARKET KEY PLAYERS
- Ardex Group
- Saint-Gobain Weber
- Dow
- CEMEX S.A.B. de C.V.
- Caparol
- LafargeHolcim
- Sika AG
- Dryvit Systems
- Mapei SpA
- Quick-Mix Group
- Knauf
- BASF SE
- Custom Building Products
- Parex Group
- Sakrete
GLOBAL DRY MIX MORTAR MARKET, BY TYPE
- Tile Adhesives
- Waterproofing
- Plaster
- Grout
- Render
- Others
GLOBAL DRY MIX MORTAR MARKET, BY APPLICATION
- Non-Residential
- Residential
GLOBAL DRY MIX MORTAR MARKET, BY REGION
- North America
- The U.S.
- Canada
- Europe
- Germany
- France
- Italy
- Spain
- United Kingdom
- Russia
- Netherlands
- Sweden
- Poland
- Rest of Europe
- Asia Pacific
- India
- China
- South Korea
- Japan
- Australia
- Thailand
- Indonesia
- Philippines
- Rest of APAC
- Latin America
- Brazil
- Mexico
- Argentina
- Colombia
- Rest of LATAM
- The Middle East and Africa
- Saudi Arabia
- United Arab Emirates
- Israel
- Turkey
- Algeria
- Egypt
- Rest of MEA
Table of Contents
1. Dry Mix Mortar Market Overview
- 1.1. Study Scope
- 1.2. Market Estimation Years
2. Executive Summary
- 2.1. Market Snippet
- 2.1.1. Dry Mix Mortar Market Snippet by Type
- 2.1.2. Dry Mix Mortar Market Snippet by Application
- 2.1.3. Dry Mix Mortar Market Snippet by Country
- 2.1.4. Dry Mix Mortar Market Snippet by Region
- 2.2. Competitive Insights
3. Dry Mix Mortar Key Market Trends
- 3.1. Dry Mix Mortar Market Drivers
- 3.1.1. Impact Analysis of Market Drivers
- 3.2. Dry Mix Mortar Market Restraints
- 3.2.1. Impact Analysis of Market Restraints
- 3.3. Dry Mix Mortar Market Opportunities
- 3.4. Dry Mix Mortar Market Future Trends
4. Dry Mix Mortar Application Study
- 4.1. PEST Analysis
- 4.2. Porter's Five Forces Analysis
- 4.3. Growth Prospect Mapping
- 4.4. Regulatory Framework Analysis
5. Dry Mix Mortar Market: COVID-19 Impact Analysis
- 5.1. Pre-COVID-19 Impact Analysis
- 5.2. Post-COVID-19 Impact Analysis
- 5.2.1. Top Performing Segments
- 5.2.2. Marginal Growth Segments
- 5.2.3. Top Looser Segments
- 5.2.4. Marginal Loss Segments
6. Dry Mix Mortar Market Landscape
- 6.1. Dry Mix Mortar Market Share Analysis, 2022
- 6.2. Breakdown Data, by Key Manufacturer
- 6.2.1. Established Players' Analysis
- 6.2.2. Emerging Players' Analysis
7. Dry Mix Mortar Market - By Type
- 7.1. Overview
- 7.1.1. Segment Share Analysis, By Type, 2022 & 2030 (%)
- 7.1.1.1. Tile Adhesives
- 7.1.1.2. Waterproofing
- 7.1.1.3. Plaster
- 7.1.1.4. Grout
- 7.1.1.5. Render
- 7.1.1.6. Others
- 7.1.1. Segment Share Analysis, By Type, 2022 & 2030 (%)
8. Dry Mix Mortar Market - By Application
- 8.1. Overview
- 8.1.1. Segment Share Analysis, By Application, 2022 & 2030 (%)
- 8.1.1.1. Non-Residential
- 8.1.1.2. Residential
- 8.1.1. Segment Share Analysis, By Application, 2022 & 2030 (%)
9. Dry Mix Mortar Market- By Geography
- 9.1. Introduction
- 9.1.1. Segment Share Analysis, By Geography, 2022 & 2030 (%)
- 9.2. North America
- 9.2.1. Overview
- 9.2.2. Dry Mix Mortar Key Manufacturers in North America
- 9.2.3. North America Market Size and Forecast, By Country, 2018 - 2030 (US$ Million)
- 9.2.4. North America Market Size and Forecast, By Type, 2018 - 2030 (US$ Million)
- 9.2.5. North America Market Size and Forecast, By Application, 2018 - 2030 (US$ Million)
- 9.2.6. U.S.
- 9.2.6.1. Overview
- 9.2.6.2. Market Analysis, Forecast, and Y-O-Y Growth Rate, 2018 - 2030, (US$ Million)
- 9.2.6.3. U.S. Market Size and Forecast, By Type, 2018 - 2030 (US$ Million)
- 9.2.6.4. U.S. Market Size and Forecast, By Application, 2018 - 2030 (US$ Million)
- 9.2.7. Canada
- 9.2.7.1. Overview
- 9.2.7.2. Market Analysis, Forecast, and Y-O-Y Growth Rate, 2018 - 2030, (US$ Million)
- 9.2.7.3. Canada Market Size and Forecast, By Type, 2018 - 2030 (US$ Million)
- 9.2.7.4. Canada Market Size and Forecast, By Application, 2018 - 2030 (US$ Million)
- 9.3. Europe
- 9.3.1. Overview
- 9.3.2. Dry Mix Mortar Key Manufacturers in Europe
- 9.3.3. Europe Market Size and Forecast, By Country, 2018 - 2030 (US$ Million)
- 9.3.4. Europe Market Size and Forecast, By Type, 2018 - 2030 (US$ Million)
- 9.3.5. Europe Market Size and Forecast, By Application, 2018 - 2030 (US$ Million)
- 9.3.6. Germany
- 9.3.6.1. Overview
- 9.3.6.2. Market Analysis, Forecast, and Y-O-Y Growth Rate, 2018 - 2030, (US$ Million)
- 9.3.6.3. Germany Market Size and Forecast, By Type, 2018 - 2030 (US$ Million)
- 9.3.6.4. Germany Market Size and Forecast, By Application, 2018 - 2030 (US$ Million)
- 9.3.7. Italy
- 9.3.7.1. Overview
- 9.3.7.2. Market Analysis, Forecast, and Y-O-Y Growth Rate, 2018 - 2030, (US$ Million)
- 9.3.7.3. Italy Market Size and Forecast, By Type, 2018 - 2030 (US$ Million)
- 9.3.7.4. Italy Market Size and Forecast, By Application, 2018 - 2030 (US$ Million)
- 9.3.8. United Kingdom
- 9.3.8.1. Overview
- 9.3.8.2. Market Analysis, Forecast, and Y-O-Y Growth Rate, 2018 - 2030, (US$ Million)
- 9.3.8.3. United Kingdom Market Size and Forecast, By Type, 2018 - 2030 (US$ Million)
- 9.3.8.4. United Kingdom Market Size and Forecast, By Application, 2018 - 2030 (US$ Million)
- 9.3.9. France
- 9.3.9.1. Overview
- 9.3.9.2. Market Analysis, Forecast, and Y-O-Y Growth Rate, 2018 - 2030, (US$ Million)
- 9.3.9.3. France Market Size and Forecast, By Type, 2018 - 2030 (US$ Million)
- 9.3.9.4. France Market Size and Forecast, By Application, 2018 - 2030 (US$ Million)
- 9.3.10. Russia
- 9.3.10.1. Market Analysis, Forecast, and Y-O-Y Growth Rate, 2018 - 2030, (US$ Million)
- 9.3.10.2. Russia Market Size and Forecast, By Type, 2018 - 2030 (US$ Million)
- 9.3.10.3. Russia Market Size and Forecast, By Application, 2018 - 2030 (US$ Million)
- 9.3.11. Netherlands
- 9.3.11.1. Market Analysis, Forecast, and Y-O-Y Growth Rate, 2018 - 2030, (US$ Million)
- 9.3.11.2. Netherlands Market Size and Forecast, By Type, 2018 - 2030 (US$ Million)
- 9.3.11.3. Netherlands Market Size and Forecast, By Application, 2018 - 2030 (US$ Million)
- 9.3.12. Sweden
- 9.3.12.1. Market Analysis, Forecast, and Y-O-Y Growth Rate, 2018 - 2030, (US$ Million)
- 9.3.12.2. Sweden Market Size and Forecast, By Type, 2018 - 2030 (US$ Million)
- 9.3.12.3. Sweden Market Size and Forecast, By Application, 2018 - 2030 (US$ Million)
- 9.3.13. Poland
- 9.3.13.1. Market Analysis, Forecast, and Y-O-Y Growth Rate, 2018 - 2030, (US$ Million)
- 9.3.13.2. Poland Market Size and Forecast, By Type, 2018 - 2030 (US$ Million)
- 9.3.13.3. Poland Market Size and Forecast, By Application, 2018 - 2030 (US$ Million)
- 9.3.14. Rest of Europe
- 9.3.14.1. Overview
- 9.3.14.2. Market Analysis, Forecast, and Y-O-Y Growth Rate, 2018 - 2030, (US$ Million)
- 9.3.14.3. Rest of the Europe Market Size and Forecast, By Type, 2018 - 2030 (US$ Million)
- 9.3.14.4. Rest of the Europe Market Size and Forecast, By Application, 2018 - 2030 (US$ Million)
- 9.4. Asia Pacific (APAC)
- 9.4.1. Overview
- 9.4.2. Dry Mix Mortar Key Manufacturers in Asia Pacific
- 9.4.3. Asia Pacific Market Size and Forecast, By Country, 2018 - 2030 (US$ Million)
- 9.4.4. Asia Pacific Market Size and Forecast, By Type, 2018 - 2030 (US$ Million)
- 9.4.5. Asia Pacific Market Size and Forecast, By Application, 2018 - 2030 (US$ Million)
- 9.4.6. India
- 9.4.6.1. Overview
- 9.4.6.2. Market Analysis, Forecast, and Y-O-Y Growth Rate, 2018 - 2030, (US$ Million)
- 9.4.6.3. India Market Size and Forecast, By Type, 2018 - 2030 (US$ Million)
- 9.4.6.4. India Market Size and Forecast, By Application, 2018 - 2030 (US$ Million)
- 9.4.7. China
- 9.4.7.1. Overview
- 9.4.7.2. Market Analysis, Forecast, and Y-O-Y Growth Rate, 2018 - 2030, (US$ Million)
- 9.4.7.3. China Market Size and Forecast, By Type, 2018 - 2030 (US$ Million)
- 9.4.7.4. China Market Size and Forecast, By Application, 2018 - 2030 (US$ Million)
- 9.4.8. Japan
- 9.4.8.1. Overview
- 9.4.8.2. Market Analysis, Forecast, and Y-O-Y Growth Rate, 2018 - 2030, (US$ Million)
- 9.4.8.3. Japan Market Size and Forecast, By Type, 2018 - 2030 (US$ Million)
- 9.4.8.4. Japan Market Size and Forecast, By Application, 2018 - 2030 (US$ Million)
- 9.4.9. South Korea
- 9.4.9.1. Overview
- 9.4.9.2. Market Analysis, Forecast, and Y-O-Y Growth Rate, 2018 - 2030, (US$ Million)
- 9.4.9.3. South Korea Market Size and Forecast, By Type, 2018 - 2030 (US$ Million)
- 9.4.9.4. South Korea Market Size and Forecast, By Application, 2018 - 2030 (US$ Million)
- 9.4.10. Australia
- 9.4.10.1. Overview
- 9.4.10.2. Market Analysis, Forecast, and Y-O-Y Growth Rate, 2018 - 2030, (US$ Million)
- 9.4.10.3. Australia Market Size and Forecast, By Type, 2018 - 2030 (US$ Million)
- 9.4.10.4. Australia Market Size and Forecast, By Application, 2018 - 2030 (US$ Million)
- 9.4.11. Thailand
- 9.4.11.1. Overview
- 9.4.11.2. Market Analysis, Forecast, and Y-O-Y Growth Rate, 2018 - 2030, (US$ Million)
- 9.4.11.3. Thailand Market Size and Forecast, By Type, 2018 - 2030 (US$ Million)
- 9.4.11.4. Thailand Market Size and Forecast, By Application, 2018 - 2030 (US$ Million)
- 9.4.12. Indonesia
- 9.4.12.1. Overview
- 9.4.12.2. Market Analysis, Forecast, and Y-O-Y Growth Rate, 2018 - 2030, (US$ Million)
- 9.4.12.3. Indonesia Market Size and Forecast, By Type, 2018 - 2030 (US$ Million)
- 9.4.12.4. Indonesia Market Size and Forecast, By Application, 2018 - 2030 (US$ Million)
- 9.4.13. Philippines
- 9.4.13.1. Overview
- 9.4.13.2. Market Analysis, Forecast, and Y-O-Y Growth Rate, 2018 - 2030, (US$ Million)
- 9.4.13.3. Philippines Market Size and Forecast, By Type, 2018 - 2030 (US$ Million)
- 9.4.13.4. Philippines Market Size and Forecast, By Application, 2018 - 2030 (US$ Million)
- 9.4.14. Rest of APAC
- 9.4.14.1. Overview
- 9.4.14.2. Market Analysis, Forecast, and Y-O-Y Growth Rate, 2018 - 2030, (US$ Million)
- 9.4.14.3. Rest of APAC Market Size and Forecast, By Type, 2018 - 2030 (US$ Million)
- 9.4.14.4. Rest of APAC Market Size and Forecast, By Application, 2018 - 2030 (US$ Million)
- 9.5. Latin America
- 9.5.1. Overview
- 9.5.2. Dry Mix Mortar Key Manufacturers in Latin America
- 9.5.3. Latin America Market Size and Forecast, By Country, 2018 - 2030 (US$ Million)
- 9.5.4. Latin America Market Size and Forecast, By Type, 2018 - 2030 (US$ Million)
- 9.5.5. Latin America Market Size and Forecast, By Application, 2018 - 2030 (US$ Million)
- 9.5.6. Brazil
- 9.5.6.1. Overview
- 9.5.6.2. Market Analysis, Forecast, and Y-O-Y Growth Rate, 2018 - 2030, (US$ Million)
- 9.5.6.3. Brazil Market Size and Forecast, By Type, 2018 - 2030 (US$ Million)
- 9.5.6.4. Brazil Market Size and Forecast, By Application, 2018 - 2030 (US$ Million)
- 9.5.7. Mexico
- 9.5.7.1. Overview
- 9.5.7.2. Market Analysis, Forecast, and Y-O-Y Growth Rate, 2018 - 2030, (US$ Million)
- 9.5.7.3. Mexico Market Size and Forecast, By Type, 2018 - 2030 (US$ Million)
- 9.5.7.4. Mexico Market Size and Forecast, By Application, 2018 - 2030 (US$ Million)
- 9.5.8. Argentina
- 9.5.8.1. Overview
- 9.5.8.2. Market Analysis, Forecast, and Y-O-Y Growth Rate, 2018 - 2030, (US$ Million)
- 9.5.8.3. Argentina Market Size and Forecast, By Type, 2018 - 2030 (US$ Million)
- 9.5.8.4. Argentina Market Size and Forecast, By Application, 2018 - 2030 (US$ Million)
- 9.5.9. Colombia
- 9.5.9.1. Overview
- 9.5.9.2. Market Analysis, Forecast, and Y-O-Y Growth Rate, 2018 - 2030, (US$ Million)
- 9.5.9.3. Colombia Market Size and Forecast, By Type, 2018 - 2030 (US$ Million)
- 9.5.9.4. Colombia Market Size and Forecast, By Application, 2018 - 2030 (US$ Million)
- 9.5.10. Rest of LATAM
- 9.5.10.1. Overview
- 9.5.10.2. Market Analysis, Forecast, and Y-O-Y Growth Rate, 2018 - 2030, (US$ Million)
- 9.5.10.3. Rest of LATAM Market Size and Forecast, By Type, 2018 - 2030 (US$ Million)
- 9.5.10.4. Rest of LATAM Market Size and Forecast, By Application, 2018 - 2030 (US$ Million)
- 9.6. Middle East and Africa
- 9.6.1. Overview
- 9.6.2. Dry Mix Mortar Key Manufacturers in Middle East and Africa
- 9.6.3. Middle East and Africa Market Size and Forecast, By Country, 2018 - 2030 (US$ Million)
- 9.6.4. Middle East and Africa Market Size and Forecast, By Type, 2018 - 2030 (US$ Million)
- 9.6.5. Middle East and Africa Market Size and Forecast, By Application, 2018 - 2030 (US$ Million)
- 9.6.6. Saudi Arabia
- 9.6.6.1. Overview
- 9.6.6.2. Market Analysis, Forecast, and Y-O-Y Growth Rate, 2018 - 2030, (US$ Million)
- 9.6.6.3. Saudi Arabia Market Size and Forecast, By Type, 2018 - 2030 (US$ Million)
- 9.6.6.4. Saudi Arabia Market Size and Forecast, By Application, 2018 - 2030 (US$ Million)
- 9.6.7. United Arab Emirates
- 9.6.7.1. Overview
- 9.6.7.2. Market Analysis, Forecast, and Y-O-Y Growth Rate, 2018 - 2030, (US$ Million)
- 9.6.7.3. United Arab Emirates Market Size and Forecast, By Type, 2018 - 2030 (US$ Million)
- 9.6.7.4. United Arab Emirates Market Size and Forecast, By Application, 2018 - 2030 (US$ Million)
- 9.6.8. Israel
- 9.6.8.1. Overview
- 9.6.8.2. Market Analysis, Forecast, and Y-O-Y Growth Rate, 2018 - 2030, (US$ Million)
- 9.6.8.3. Israel Market Size and Forecast, By Type, 2018 - 2030 (US$ Million)
- 9.6.8.4. Israel Market Size and Forecast, By Application, 2018 - 2030 (US$ Million)
- 9.6.9. Turkey
- 9.6.9.1. Overview
- 9.6.9.2. Market Analysis, Forecast, and Y-O-Y Growth Rate, 2018 - 2030, (US$ Million)
- 9.6.9.3. Turkey Market Size and Forecast, By Type, 2018 - 2030 (US$ Million)
- 9.6.9.4. Turkey Market Size and Forecast, By Application, 2018 - 2030 (US$ Million)
- 9.6.10. Algeria
- 9.6.10.1. Overview
- 9.6.10.2. Market Analysis, Forecast, and Y-O-Y Growth Rate, 2018 - 2030, (US$ Million)
- 9.6.10.3. Algeria Market Size and Forecast, By Type, 2018 - 2030 (US$ Million)
- 9.6.10.4. Algeria Market Size and Forecast, By Application, 2018 - 2030 (US$ Million)
- 9.6.11. Egypt
- 9.6.11.1. Overview
- 9.6.11.2. Market Analysis, Forecast, and Y-O-Y Growth Rate, 2018 - 2030, (US$ Million)
- 9.6.11.3. Egypt Market Size and Forecast, By Type, 2018 - 2030 (US$ Million)
- 9.6.11.4. Egypt Market Size and Forecast, By Application, 2018 - 2030 (US$ Million)
- 9.6.12. Rest of MEA
- 9.6.12.1. Overview
- 9.6.12.2. Market Analysis, Forecast, and Y-O-Y Growth Rate, 2018 - 2030, (US$ Million)
- 9.6.12.3. Rest of MEA Market Size and Forecast, By Type, 2018 - 2030 (US$ Million)
- 9.6.12.4. Rest of MEA Market Size and Forecast, By Application, 2018 - 2030 (US$ Million)
10. Key Vendor Analysis- Dry Mix Mortar Application
- 10.1. Competitive Dashboard
- 10.2. Company Profiles
- 10.2.1. Ardex Group
- 10.2.2. Saint-Gobain Weber
- 10.2.3. Dow
- 10.2.4. CEMEX S.A.B. de C.V.
- 10.2.5. Caparol
- 10.2.6. LafargeHolcim
- 10.2.7. Sika AG
- 10.2.8. Dryvit Systems
- 10.2.9. Mapei SpA
- 10.2.10. Quick-Mix Group
- 10.2.11. Knauf
- 10.2.12. BASF SE
- 10.2.13. Custom Building Products
- 10.2.14. Parex Group
- 10.2.15. Sakrete
11. 360 Degree Analyst View
12. Appendix
- 12.1. Research Methodology
- 12.2. References
- 12.3. Abbreviations
- 12.4. Disclaimer
- 12.5. Contact Us