|
|
市場調査レポート
商品コード
1092206
積層セラミックコンデンサ市場(2028年まで):COVID-19の影響分析、タイプ、電圧範囲、エンドユーザー、地域別の競合戦略とセグメント予測Multilayer Ceramic Capacitor Market with COVID-19 Impact Analysis, By Type, Voltage Range, End User Insights- Regional Outlook, Competitive Strategies and Segment Forecasts to 2028 |
||||||
|
|
|||||||
|
● お客様のご希望に応じて、既存データの加工や未掲載情報(例:国別セグメント)の追加などの対応が可能です。 詳細はお問い合わせください。 |
|||||||


| 積層セラミックコンデンサ市場(2028年まで):COVID-19の影響分析、タイプ、電圧範囲、エンドユーザー、地域別の競合戦略とセグメント予測 |
|
出版日: 2022年05月01日
発行: AnalystView Market Insights
ページ情報: 英文 267 Pages
納期: 2~3営業日
|
- 全表示
- 概要
- 図表
- 目次
世界の積層セラミックコンデンサの市場規模は、2021年に60億550万米ドルとなり、予測期間中に6.1%のCAGRで拡大すると予想されています。
当レポートでは世界の積層セラミックコンデンサ市場を調査し、市場の概要、市場の促進要因・抑制要因の分析、市場機会、COVID-19の影響、セグメント別の市場分析、競合情勢、主要企業のプロファイルなど、体系的な情報を提供しています。
目次
第1章 積層セラミックコンデンサ市場概要
第2章 エグゼクティブサマリー
- 市場内訳
- タイプ別
- 電圧範囲別
- エンドユーザー別
- 国別
- 地域別
- 競合考察
第3章 積層セラミックコンデンサ:主要な市場動向
- 市場促進要因
- 市場促進要因の影響分析
- 市場抑制要因
- 市場抑制要因の影響分析
- 市場機会
- 市場の将来動向
第4章 積層セラミックコンデンサ:業界調査
- ポーターのファイブフォース分析
- マーケティング戦略分析
- 成長見通しのマッピング
- 規制の枠組みの分析
第5章 積層セラミックコンデンサ市場:COVID-19の影響分析
- COVID-19以前の影響分析
- COVID-19以後の影響分析
第6章 積層セラミックコンデンサ:市場情勢
- 市場シェア分析(2020年)
- 主要イノベーター分析
- 主要メーカー別の内訳データ
- 確立された企業の分析
- 新興企業の分析
第7章 積層セラミックコンデンサ市場:タイプ別
- 概要
第8章 積層セラミックコンデンサ市場:電圧範囲別
- 概要
第9章 積層セラミックコンデンサ市場:エンドユーザー別
- 概要
第10章 積層セラミックコンデンサ市場:地域別
- イントロダクション
- 北米
- 欧州
- アジア太平洋地域
- ラテンアメリカ
- 中東とアフリカ
第11章 ベンダーの分析
- 競合ダッシュボード
- 企業プロファイル
- Murata Manufacturing
- Samsung Electro-Mechanics
- TDK Corporation
- Kyocera
- Taiyo Yuden
- YAGEO Corporation
- Walsin Technology Corporation
- KEMET
- Vishay
- Darfon Electronics Corp
第12章 アナリストの包括的展望
第13章 付録
List of Tables
- TABLE List of data sources
- TABLE Market drivers; Impact Analysis
- TABLE Market restraints; Impact Analysis
- TABLE Multilayer Ceramic Capacitor market: Types Snapshot (2020)
- TABLE Segment Dashboard; Definition and Scope, by Types
- TABLE Global Multilayer Ceramic Capacitor Meter market, by Types, 2017 - 2028 (USD Million)
- TABLE Multilayer Ceramic Capacitor market: Voltage Range Snapshot (2020)
- TABLE Segment Dashboard; Definition and Scope, by Voltage Range
- TABLE Global Multilayer Ceramic Capacitor market, by Voltage Range, 2017 - 2028 (USD Million)
- TABLE Multilayer Ceramic Capacitor market: End User Snapshot (2020)
- TABLE Segment Dashboard; Definition and Scope, by End User
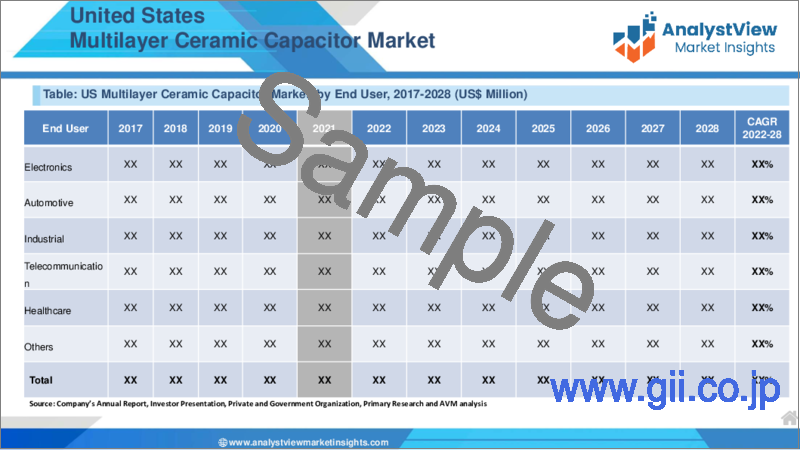
- TABLE Global Multilayer Ceramic Capacitor market, by End User, 2017 - 2028 (USD Million)
- TABLE Multilayer Ceramic Capacitor market: Regional snapshot (2020)
- TABLE Segment Dashboard; Definition and Scope, by Region
- TABLE Global Multilayer Ceramic Capacitor Meter market, by Region 2017 - 2028 (USD Million)
- TABLE North America Multilayer Ceramic Capacitor Meter market, by Country, 2017 - 2028 (USD Million)
- TABLE North America Multilayer Ceramic Capacitor market, by Types, 2017 - 2028 (USD Million)
- TABLE North America Multilayer Ceramic Capacitor market, by Voltage Range, 2017 - 2028 (USD Million)
- TABLE North America Multilayer Ceramic Capacitor market, by End User, 2017 - 2028 (USD Million)
- TABLE Europe Multilayer Ceramic Capacitor market, by Country, 2017 - 2028 (USD Million)
- TABLE Europe Multilayer Ceramic Capacitor market, by Types, 2017 - 2028 (USD Million)
- TABLE EuropeMultilayer Ceramic Capacitor market, by Voltage Range, 2017 - 2028 (USD Million)
- TABLE Europe Multilayer Ceramic Capacitor market, by End User, 2017 - 2028 (USD Million)
- TABLE Asia Pacific Multilayer Ceramic Capacitor market, by Country, 2017 - 2028 (USD Million)
- TABLE Asia Pacific Multilayer Ceramic Capacitor market, by Types, 2017 - 2028 (USD Million)
- TABLE Asia Pacific Multilayer Ceramic Capacitor market, by Voltage Range, 2017 - 2028 (USD Million)
- TABLE Asia Pacific Multilayer Ceramic Capacitor market, by End User, 2017 - 2028 (USD Million)
- TABLE Latin America Multilayer Ceramic Capacitor market, by Country, 2017 - 2028 (USD Million)
- TABLE Latin America Multilayer Ceramic Capacitor market, by Type, 2017 - 2028 (USD Million)
- TABLE Latin America Multilayer Ceramic Capacitor market, by Voltage Range, 2017 - 2028 (USD Million)
- TABLE Latin America Multilayer Ceramic Capacitor market, by End User, 2017 - 2028 (USD Million)
- TABLE Middle East and Africa Multilayer Ceramic Capacitor market, by Country, 2017 - 2028 (USD Million)
- TABLE Middle East and Africa Multilayer Ceramic Capacitor market, by Type, 2017 - 2028 (USD Million)
- TABLE Middle East and Africa Multilayer Ceramic Capacitor market, by Voltage Range, 2017 - 2028 (USD Million)
- TABLE Middle East and Africa Multilayer Ceramic Capacitor market, by End User, 2017 - 2028 (USD Million)
List of Figures
- FIGURE Multilayer Ceramic Capacitor Meter market segmentation
- FIGURE Market research methodology
- FIGURE Value chain analysis
- FIGURE Porter's Five Forces Analysis
- FIGURE Market Attractiveness Analysis
- FIGURE COVID-19 Impact Analysis
- FIGURE Pre & Post COVID-19 Impact Comparision Study
- FIGURE Competitive Landscape; Key company market share analysis, 2020
- FIGURE Type segment market share analysis, 2021 & 2028
- FIGURE Type segment market size forecast and trend analysis, 2017 to 2028 (USD Million)
- FIGURE Voltage Range segment market share analysis, 2021 & 2028
- FIGURE Voltage Range segment market size forecast and trend analysis, 2017 to 2028 (USD Million)
- FIGURE End User segment market share analysis, 2021 & 2028
- FIGURE End User segment market size forecast and trend analysis, 2017 to 2028 (USD Million)
- FIGURE Regional segment market share analysis, 2021 & 2028
- FIGURE Regional segment market size forecast and trend analysis, 2017 to 2028 (USD Million)
- FIGURE North America Multilayer Ceramic Capacitor market share and leading players, 2020
- FIGURE Europe Multilayer Ceramic Capacitor market share and leading players, 2020
- FIGURE Asia Pacific Multilayer Ceramic Capacitor Meter market share and leading players, 2020
- FIGURE Latin America Multilayer Ceramic Capacitor Meter market share and leading players, 2020
- FIGURE Middle East and Africa Multilayer Ceramic Capacitor Meter market share and leading players, 2020
- FIGURE North America market share analysis by country, 2020
- FIGURE U.S. Multilayer Ceramic Capacitor market size, forecast and trend analysis, 2017 to 2028 (USD Million)
- FIGURE Canada Multilayer Ceramic Capacitor market size, forecast and trend analysis, 2017 to 2028 (USD Million)
- FIGURE Europe Multilayer Ceramic Capacitor market share analysis by country, 2020
- FIGURE Germany Multilayer Ceramic Capacitor market size, forecast and trend analysis, 2017 to 2028 (USD Million)
- FIGURE Spain Multilayer Ceramic Capacitor market size, forecast and trend analysis, 2017 to 2028 (USD Million)
- FIGURE Italy Multilayer Ceramic Capacitor market size, forecast and trend analysis, 2017 to 2028 (USD Million)
- FIGURE UK Multilayer Ceramic Capacitor market size, forecast and trend analysis, 2017 to 2028 (USD Million)
- FIGURE France Multilayer Ceramic Capacitor Meter market size, forecast and trend analysis, 2017 to 2028 (USD Million)
- FIGURE Rest of the Europe Multilayer Ceramic Capacitor market size, forecast and trend analysis, 2017 to 2028 (USD Million)
- FIGURE Asia Pacific Multilayer Ceramic Capacitor market share analysis by country, 2020
- FIGURE India Multilayer Ceramic Capacitor market size, forecast and trend analysis, 2017 to 2028 (USD Million)
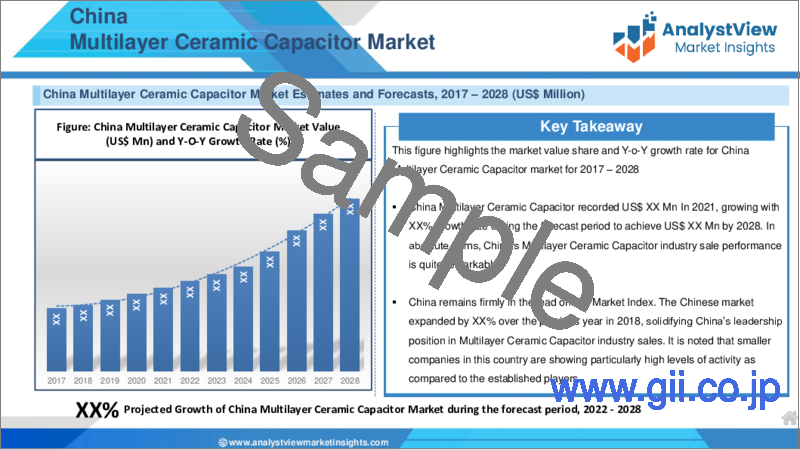
- FIGURE China Multilayer Ceramic Capacitor market size, forecast and trend analysis, 2017 to 2028 (USD Million)
- FIGURE Japan Multilayer Ceramic Capacitor market size, forecast and trend analysis, 2017 to 2028 (USD Million)
- FIGURE South Korea Multilayer Ceramic Capacitor market size, forecast and trend analysis, 2017 to 2028 (USD Million)
- FIGURE Singapore Multilayer Ceramic Capacitor market size, forecast and trend analysis, 2017 to 2028 (USD Million)
- FIGURE Rest of APAC Multilayer Ceramic Capacitor market size, forecast and trend analysis, 2017 to 2028 (USD Million)
- FIGURE Latin America Multilayer Ceramic Capacitor market size, forecast and trend analysis, 2017 to 2028 (USD Million)
- FIGURE Latin America Multilayer Ceramic Capacitor market share analysis by country, 2020
- FIGURE Brazil Multilayer Ceramic Capacitor market size, forecast and trend analysis, 2017 to 2028 (USD Million)
- FIGURE Mexico Multilayer Ceramic Capacitor market size, forecast and trend analysis, 2017 to 2028 (USD Million)
- FIGURE Argentina Multilayer Ceramic Capacitor market size, forecast and trend analysis, 2017 to 2028 (USD Million)
- FIGURE Rest of LATAM Multilayer Ceramic Capacitor market size, forecast and trend analysis, 2017 to 2028 (USD Million)
- FIGURE Middle East and Africa Multilayer Ceramic Capacitor market size, forecast and trend analysis, 2017 to 2028 (USD Million)
- FIGURE Middle East and Africa Multilayer Ceramic Capacitor market share analysis by country, 2020
- FIGURE Saudi Arabia Multilayer Ceramic Capacitor market size, forecast and trend analysis, 2017 to 2028 (USD Million)
- FIGURE United Arab Emirates Multilayer Ceramic Capacitor market size, forecast and trend analysis, 2017 to 2028 (USD Million)
REPORT HIGHLIGHT
The global Multilayer Ceramic Capacitor market is estimated to be worth $6,005.5 million in 2021. Multilayer Ceramic Capacitor market is expected to expand at an 6.1% CAGR during the forecast period.
Market Introduction
An electric component called a capacitor is made up of two electrical conductors separated by a thin insulating substance. A Multilayer Ceramic Capacitor (MLCC) is a sandwich construction made up of many layers of ceramic inner electrodes. The MLCC is a surface-mounted device (SMD) capacitor that is utilized in a variety of capacitance applications, including telecommunications, data processing, PCs, hard discs, mobile phones, PCs, DVDs, cameras, and general electronic circuits, among others. Agricultural Variable Rate Technologies (MLCCs) have unique qualities such as size and shape flexibility, low cost, and the capacity to tolerate high voltages, and are regarded as the most trustworthy.
However, the ability to bundle several components into a single package was the most important feature that led to their broad use. Each MLCC includes hundreds of layers, each of which functions independently. This removed the need for additional circuitry components.
Market Dynamics
Consumer electronics demand has been rising, particularly in emerging countries such as Malaysia, China, and others. Factors such as rising disposable income and the emergence of a middle class drive up the market for consumer electronics, moving the market forward. This is due to the inclusion of a number of capacitors in consumer electronics such as TVs, smartphones, MP3 players, and some other similar products. Furthermore, smart TVs and LED TVs already have supplanted CRT televisions. As a result, major players in the worldwide MLCC market are expected to benefit from a plethora of chances. Technology advancements, charging infrastructure expansion, and the number of BEV models available may all continue to rise at a much quicker rate than the general car market. Even if total car sales remain unchanged, this growth may promote MLCC adoption.
However, because of the growing number of electronic devices placed in cars, demand for MLCCs has surged, causing supply shortages in a wide range of industries, particularly automakers and smartphone manufacturers. Customers of ordinary MLCCs are among those who are hardest hit by scarcity. Murata and Kyocera, for example, abandoned their products and devoted the majority of their production capacity to automotive MLCC manufacturing. Smaller clients, who typically account for 40-50 percent of total sales, have been harmed by the shortfall.
Segmentation Analysis
Multilayer Ceramic Capacitor Market is segmented by type, voltage range, end-user, and geography. Based on application, the residential segment is expected to dominate the global market with a 37% market share. One of the most important categories of the Multilayer Ceramic Capacitor market is automotive. The majority of the market's vendors are boosting their investments in the automobile industry. Some of the major factors driving demand for MLCC in the automotive industry are the increasing government regulations for mandatory Advanced Driver Assistant systems, the rising adoption of electric vehicles and autonomous vehicle technology, and the rising adoption of smart technologies for automotive manufacturing.
Competitive Landscape
The global Multilayer Ceramic Capacitor market is fairly competitive with the presence of a large number of international and national players. Some of the major players in the market are Samsung Electro-Mechanics, Murata Manufacturing, TDK Corporation, and Kyocera, among others. Industry players are relying on strategic mergers and acquisitions to gain a significant share of the global Multilayer Ceramic Capacitor market. For instance, in January 2021, KYOCERA CORPORATION acquired SLD Laser. In addition, in January 2021, Yageo Group launched three hybrid aluminum polymer capacitor series: PHA225, A780, and PHH225.
Key features of the study:
- This proposed research study on Multilayer Ceramic Capacitor market provides market size (US$ million), compound annual growth rate (CAGR %) and forecast estimation (2022-2028), considering 2021 as the base year
- The research report elucidates potential growth opportunities across different segments/countries and explains attractive investment proposition matrix for Multilayer Ceramic Capacitor market.
- The overall report identifies new investment opportunities, challenges faced by established players, and growth factors to sustain in the Multilayer Ceramic Capacitor market.
- Impact of COVID-19 on Multilayer Ceramic Capacitor market size, forecast, CAGR, and market dynamics are discussed in detail under the research scope. Detailed insight on Multilayer Ceramic Capacitor market post-COVID will also be covered.
- In order to give the users of this report a comprehensive view on the Multilayer Ceramic Capacitor market, we have also included competitive landscape and key innovator analysis for the Multilayer Ceramic Capacitor market
- The study encompasses a growth prospect mapping analysis, wherein all the industry segments are benchmarked based on their market size, growth rate and attractiveness.
- The report offers detailed company profiling featuring major market participants which will help users to understand their financial information and strategic initiatives of players operating in the Multilayer Ceramic Capacitor market.
- In addition, the report also unveil the important acquisitions & mergers, collaborations & joint ventures, new launch, research & development, regional expansion of major participants involved in the market on global as well as regional level.
- The global Multilayer Ceramic Capacitor market report primarily caters to various stakeholders in this industry including suppliers, investors, new entrants, distributors, and financial analysts
SCOPE OF THE REPORT
The scope of this report covers the market by its major segments, which include as follows:
Global Multilayer Ceramic Capacitor Market Key Players
- Murata Manufacturing
- Samsung Electro-Mechanics
- TDK Corporation
- Kyocera
- Taiyo Yuden
- YAGEO Corporation
- Walsin Technology Corporation
- KEMET
- Vishay
- Darfon Electronics Corp
Global Multilayer Ceramic Capacitor Market by Type
- General Capacitor
- Array
- Serial Construction
- Mega Cap
- Others
Global Multilayer Ceramic Capacitor Market by Voltage Range
- Low Range
- Mid Range
- High Range
Global Multilayer Ceramic Capacitor Market by End User
- Electronics
- Automotive
- Industrial
- Telecommunication
Global Multilayer Ceramic Capacitor Market by Region
- North America
- United States
- Canada
- Mexico
- Europe
- Germany
- United Kingdom
- France
- Italy
- Spain
- Rest of Europe
- Asia-Pacific
- China
- Japan
- India
- Australia
- South Korea
- Rest of Asia-Pacific
- Latin America
- Brazil
- Argentina
- Rest of Latin America
- Middle-East and Africa
- GCC
- South Africa
- Rest of Middle-East and Africa
TABLE OF CONTENT
1. Multilayer Ceramic Capacitor Market Overview
- 1.1. Study Scope
2. Executive Summary
- 2.1. Market Snippet
- 2.1.1. Market Snippet by Type
- 2.1.2. Market Snippet by Voltage Range
- 2.1.3. Market Snippet by End User
- 2.1.4. Market Snippet by Country
- 2.1.5. Market Snippet by Region
- 2.2. Competitive Insights
3. Multilayer Ceramic Capacitor Key Market Trends
- 3.1. Market Drivers
- 3.1.1. Impact Analysis of Market Drivers
- 3.2. Market Restraints
- 3.2.1. Impact Analysis of Market Restraints
- 3.3. Market Opportunities
- 3.4. Market Future Trends
4. Multilayer Ceramic Capacitor Industry Study
- 4.1. Porter's Five Forces Analysis
- 4.2. Marketing Strategy Analysis
- 4.3. Growth Prospect Mapping
- 4.4. Regulatory Framework Analysis
5. Multilayer Ceramic Capacitor Market: COVID-19 Impact Analysis
- 5.1. Pre-COVID-19 Impact Analysis
- 5.2. Post-COVID-19 Impact Analysis
- 5.2.1. Top Performing Segments
- 5.2.2. Marginal Growth Segments
- 5.2.3. Top Looser Segments
- 5.2.4. Marginal Loss Segments
6. Multilayer Ceramic Capacitor Market Landscape
- 6.1. Market Share Analysis, 2020
- 6.2. Key Innovators Analysis
- 6.3. Breakdown Data, by Key Manufacturer
- 6.3.1. Established Players' Analysis
- 6.3.2. Emerging Players' Analysis
7. Multilayer Ceramic Capacitor Market - By Type
- 7.1. Overview
- 7.1.1. Segment Share Analysis, By Type, 2021 & 2028 (%)
- 7.1.2. General Capacitor
- 7.1.3. Array
- 7.1.4. Serial Construction
- 7.1.5. Mega Cap
- 7.1.6. Others
8. Multilayer Ceramic Capacitor Market - By Voltage Range
- 8.1. Overview
- 8.1.1. Segment Share Analysis, By Voltage Range, 2021 & 2028 (%)
- 8.1.2. Low Range
- 8.1.3. Mid Range
- 8.1.4. High Range
9. Multilayer Ceramic Capacitor Market - By End User
- 9.1. Overview
- 9.1.1. Segment Share Analysis, By Type, 2021 & 2028 (%)
- 9.1.2. Electronics
- 9.1.3. Automotive
- 9.1.4. Industrial
- 9.1.5. Telecommunication
10. Multilayer Ceramic Capacitor Market- By Geography
- 10.1. Introduction
- 10.1.1. Segment Share Analysis, By Geography, 2021 & 2028 (%)
- 10.2. North America
- 10.2.1. Overview
- 10.2.2. Key Manufacturers in North America
- 10.2.3. North America Market Size and Forecast, By Country, 2017 - 2028 (US$ Million)
- 10.2.4. North America Market Size and Forecast, By Type, 2017 - 2028 (US$ Million)
- 10.2.5. North America Market Size and Forecast, By Voltage Range, 2017 - 2028 (US$ Million)
- 10.2.6. North America Market Size and Forecast, By End User, 2017 - 2028 (US$ Million)
- 10.2.7. U.S.
- 10.2.7.1. Overview
- 10.2.7.2. Market Analysis, Forecast, and Y-O-Y Growth Rate, 2017 - 2028, (US$ Million)
- 10.2.7.3. U.S. Market Size and Forecast, By Type, 2017 - 2028 (US$ Million)
- 10.2.7.4. U.S. Market Size and Forecast, By Voltage Range, 2017 - 2028 (US$ Million)
- 10.2.7.5. U.S. Market Size and Forecast, By End User, 2017 - 2028 (US$ Million)
- 10.2.8. Canada
- 10.2.8.1. Overview
- 10.2.8.2. Market Analysis, Forecast, and Y-O-Y Growth Rate, 2017 - 2028, (US$ Million)
- 1.1.1.1. Canada Market Size and Forecast, By Type, 2017 - 2028 (US$ Million)
- 1.1.1.2. Canada Market Size and Forecast, By Voltage Range, 2017 - 2028 (US$ Million)
- 1.1.1.3. Canada Market Size and Forecast, By End User, 2017 - 2028 (US$ Million)
- 10.3. Europe
- 10.3.1. Overview
- 10.3.2. Key Manufacturers in Europe
- 10.3.3. Europe Market Size and Forecast, By Country, 2017 - 2028 (US$ Million)
- 10.3.4. Europe Market Size and Forecast, By Type, 2017 - 2028 (US$ Million)
- 10.3.5. Europe Market Size and Forecast, By Voltage Range, 2017 - 2028 (US$ Million)
- 10.3.6. Europe Market Size and Forecast, By End User, 2017 - 2028 (US$ Million)
- 10.3.7. Germany
- 10.3.7.1. Overview
- 10.3.7.2. Market Analysis, Forecast, and Y-O-Y Growth Rate, 2017 - 2028, (US$ Million)
- 10.3.7.3. Germany Market Size and Forecast, By Type, 2017 - 2028 (US$ Million)
- 10.3.7.4. Germany Market Size and Forecast, By Voltage Range, 2017 - 2028 (US$ Million)
- 10.3.7.5. Germany Market Size and Forecast, By End User, 2017 - 2028 (US$ Million)
- 10.3.8. Italy
- 10.3.8.1. Overview
- 10.3.8.2. Market Analysis, Forecast, and Y-O-Y Growth Rate, 2017 - 2028, (US$ Million)
- 10.3.8.3. Italy Market Size and Forecast, By Type, 2017 - 2028 (US$ Million)
- 10.3.8.4. Italy Market Size and Forecast, By Voltage Range, 2017 - 2028 (US$ Million)
- 10.3.8.5. Italy Market Size and Forecast, By End User, 2017 - 2028 (US$ Million)
- 10.3.9. United Kingdom
- 10.3.9.1. Overview
- 10.3.9.2. Market Analysis, Forecast, and Y-O-Y Growth Rate, 2017 - 2028, (US$ Million)
- 10.3.9.3. United Kingdom Market Size and Forecast, By Type, 2017 - 2028 (US$ Million)
- 10.3.9.4. United Kingdom Market Size and Forecast, By Voltage Range, 2017 - 2028 (US$ Million)
- 10.3.9.5. United Kingdom Market Size and Forecast, By End User, 2017 - 2028 (US$ Million)
- 10.3.10. France
- 10.3.10.1. Overview
- 10.3.10.2. Market Analysis, Forecast, and Y-O-Y Growth Rate, 2017 - 2028, (US$ Million)
- 10.3.10.3. France Market Size and Forecast, By Type, 2017 - 2028 (US$ Million)
- 10.3.10.4. France Market Size and Forecast, By Voltage Range, 2017 - 2028 (US$ Million)
- 10.3.10.5. France Market Size and Forecast, By End User, 2017 - 2028 (US$ Million)
- 10.3.11. Rest of Europe
- 10.3.11.1. Overview
- 10.3.11.2. Market Analysis, Forecast, and Y-O-Y Growth Rate, 2017 - 2028, (US$ Million)
- 10.3.11.3. Rest of the Europe Market Size and Forecast, By Type, 2017 - 2028 (US$ Million)
- 10.3.11.4. Rest of the Europe Market Size and Forecast, By Voltage Range, 2017 - 2028 (US$ Million)
- 10.3.11.5. Rest of the Europe Market Size and Forecast, By End User, 2017 - 2028 (US$ Million)
- 10.4. Asia Pacific (APAC)
- 10.4.1. Overview
- 10.4.2. Key Manufacturers in Asia Pacific
- 10.4.3. Asia Pacific Market Size and Forecast, By Country, 2017 - 2028 (US$ Million)
- 10.4.4. Asia Pacific Market Size and Forecast, By Type, 2017 - 2028 (US$ Million)
- 10.4.5. Asia Pacific Market Size and Forecast, By Voltage Range, 2017 - 2028 (US$ Million)
- 10.4.6. Asia Pacific Market Size and Forecast, By End User, 2017 - 2028 (US$ Million)
- 10.4.7. India
- 10.4.7.1. Overview
- 10.4.7.2. Market Analysis, Forecast, and Y-O-Y Growth Rate, 2017 - 2028, (US$ Million)
- 10.4.7.3. India Market Size and Forecast, By Type, 2017 - 2028 (US$ Million)
- 10.4.7.4. India Market Size and Forecast, By Voltage Range, 2017 - 2028 (US$ Million)
- 10.4.7.5. India Market Size and Forecast, By End User, 2017 - 2028 (US$ Million)
- 10.4.8. China
- 10.4.8.1. Overview
- 10.4.8.2. Market Analysis, Forecast, and Y-O-Y Growth Rate, 2017 - 2028, (US$ Million)
- 10.4.8.3. China Market Size and Forecast, By Type, 2017 - 2028 (US$ Million)
- 10.4.8.4. China Market Size and Forecast, By Voltage Range, 2017 - 2028 (US$ Million)
- 10.4.8.5. China Market Size and Forecast, By End User, 2017 - 2028 (US$ Million)
- 10.4.9. Japan
- 10.4.9.1. Overview
- 10.4.9.2. Market Analysis, Forecast, and Y-O-Y Growth Rate, 2017 - 2028, (US$ Million)
- 10.4.9.3. Japan Market Size and Forecast, By Type, 2017 - 2028 (US$ Million)
- 10.4.9.4. Japan Market Size and Forecast, By Voltage Range, 2017 - 2028 (US$ Million)
- 10.4.9.5. Japan Market Size and Forecast, By End User, 2017 - 2028 (US$ Million)
- 10.4.10. South Korea
- 10.4.10.1. Overview
- 10.4.10.2. Market Analysis, Forecast, and Y-O-Y Growth Rate, 2017 - 2028, (US$ Million)
- 10.4.10.3. South Korea Market Size and Forecast, By Type, 2017 - 2028 (US$ Million)
- 10.4.10.4. South Korea Market Size and Forecast, By Voltage Range, 2017 - 2028 (US$ Million)
- 10.4.10.5. South Korea Market Size and Forecast, By End User, 2017 - 2028 (US$ Million)
- 10.4.11. Rest of APAC
- 10.4.11.1. Overview
- 10.4.11.2. Market Analysis, Forecast, and Y-O-Y Growth Rate, 2017 - 2028, (US$ Million)
- 10.4.11.3. Rest of APAC Market Size and Forecast, By Type, 2017 - 2028 (US$ Million)
- 10.4.11.4. Rest of APAC Market Size and Forecast, By Voltage Range, 2017 - 2028 (US$ Million)
- 10.4.11.5. Rest of APAC Market Size and Forecast, By End User, 2017 - 2028 (US$ Million)
- 10.5. Latin America
- 10.5.1. Overview
- 10.5.2. Key Manufacturers in Latin America
- 10.5.3. Latin America Market Size and Forecast, By Country, 2017 - 2028 (US$ Million)
- 10.5.4. Latin America Market Size and Forecast, By Type, 2017 - 2028 (US$ Million)
- 10.5.5. Latin America Market Size and Forecast, By Voltage Range, 2017 - 2028 (US$ Million)
- 10.5.6. Latin America Market Size and Forecast, By End User, 2017 - 2028 (US$ Million)
- 10.5.7. Brazil
- 10.5.7.1. Overview
- 10.5.7.2. Market Analysis, Forecast, and Y-O-Y Growth Rate, 2017 - 2028, (US$ Million)
- 10.5.7.3. Brazil Market Size and Forecast, By Type, 2017 - 2028 (US$ Million)
- 10.5.7.4. Brazil Market Size and Forecast, By Voltage Range, 2017 - 2028 (US$ Million)
- 10.5.7.5. Brazil Market Size and Forecast, By End User, 2017 - 2028 (US$ Million)
- 10.5.8. Mexico
- 10.5.8.1. Overview
- 10.5.8.2. Market Analysis, Forecast, and Y-O-Y Growth Rate, 2017 - 2028, (US$ Million)
- 10.5.8.3. Mexico Market Size and Forecast, By Type, 2017 - 2028 (US$ Million)
- 10.5.8.4. Mexico Market Size and Forecast, By Voltage Range, 2017 - 2028 (US$ Million)
- 10.5.8.5. Mexico Market Size and Forecast, By End User, 2017 - 2028 (US$ Million)
- 10.5.9. Argentina
- 10.5.9.1. Overview
- 10.5.9.2. Market Analysis, Forecast, and Y-O-Y Growth Rate, 2017 - 2028, (US$ Million)
- 10.5.9.3. Argentina Market Size and Forecast, By Type, 2017 - 2028 (US$ Million)
- 10.5.9.4. Argentina Market Size and Forecast, By Voltage Range, 2017 - 2028 (US$ Million)
- 10.5.9.5. Argentina Market Size and Forecast, By End User, 2017 - 2028 (US$ Million)
- 10.5.10. Rest of LATAM
- 10.5.10.1. Overview
- 10.5.10.2. Market Analysis, Forecast, and Y-O-Y Growth Rate, 2017 - 2028, (US$ Million)
- 10.5.10.3. Rest of LATAM Market Size and Forecast, By Type, 2017 - 2028 (US$ Million)
- 10.5.10.4. Rest of LATAM Market Size and Forecast, By Voltage Range, 2017 - 2028 (US$ Million)
- 10.5.10.5. Rest of LATAM Market Size and Forecast, By End User, 2017 - 2028 (US$ Million)
- 10.6. Middle East and Africa
- 10.6.1. Overview
- 10.6.2. Key Manufacturers in Middle East and Africa
- 10.6.3. Middle East and Africa Market Size and Forecast, By Country, 2017 - 2028 (US$ Million)
- 10.6.4. Middle East and Africa Market Size and Forecast, By Type, 2017 - 2028 (US$ Million)
- 10.6.5. Middle East and Africa Market Size and Forecast, By Voltage Range, 2017 - 2028 (US$ Million)
- 10.6.6. Middle East and Africa Market Size and Forecast, By End User, 2017 - 2028 (US$ Million)
- 10.6.7. Saudi Arabia
- 10.6.7.1. Overview
- 10.6.7.2. Market Analysis, Forecast, and Y-O-Y Growth Rate, 2017 - 2028, (US$ Million)
- 10.6.7.3. Saudi Arabia Market Size and Forecast, By Type, 2017 - 2028 (US$ Million)
- 10.6.7.4. Saudi Arabia Market Size and Forecast, By Voltage Range, 2017 - 2028 (US$ Million)
- 10.6.7.5. Saudi Arabia Market Size and Forecast, By End User, 2017 - 2028 (US$ Million)
- 10.6.8. United Arab Emirates
- 10.6.8.1. Overview
- 10.6.8.2. Market Analysis, Forecast, and Y-O-Y Growth Rate, 2017 - 2028, (US$ Million)
- 10.6.8.3. United Arab Emirates Market Size and Forecast, By Type, 2017 - 2028 (US$ Million)
- 10.6.8.4. United Arab Emirates Market Size and Forecast, By Voltage Range, 2017 - 2028 (US$ Million)
- 10.6.8.5. United Arab Emirates Market Size and Forecast, By End User, 2017 - 2028 (US$ Million)
11. Key Vendor Analysis
- 11.1. Competitive Dashboard
- 11.2. Company Profiles
- 11.2.1. Murata Manufacturing
- 11.2.2. Samsung Electro-Mechanics
- 11.2.3. TDK Corporation
- 11.2.4. Kyocera
- 11.2.5. Taiyo Yuden
- 11.2.6. YAGEO Corporation
- 11.2.7. Walsin Technology Corporation
- 11.2.8. KEMET
- 11.2.9. Vishay
- 11.2.10. Darfon Electronics Corp
12. 360 Degree Analyst View
13. Appendix
- 13.1. Research Methodology
- 13.2. References
- 13.3. Abbreviations
- 13.4. Disclaimer
- 13.5. Contact Us