|
|
市場調査レポート
商品コード
1408031
積層セラミックコンデンサ(MLCC)の世界市場の評価:誘電体タイプ別、電圧範囲別、エンドユーザー別、地域別、機会、予測(2017年~2031年)Multi-Layer Ceramic Capacitor Market Assessment, By Dielectric Type, By Voltage Range, By End-user, By Region, Opportunities and Forecast, 2017-2031F |
||||||
|
|
|||||||
カスタマイズ可能
|
|||||||


| 積層セラミックコンデンサ(MLCC)の世界市場の評価:誘電体タイプ別、電圧範囲別、エンドユーザー別、地域別、機会、予測(2017年~2031年) |
|
出版日: 2024年01月15日
発行: Markets & Data
ページ情報: 英文 207 Pages
納期: 3~5営業日
|

- 全表示
- 概要
- 図表
- 目次
世界の積層セラミックコンデンサ(MLCC)の市場規模は、2023年に141億米ドル、2031年までに213億1,000万米ドルに達し、2024年~2031年にCAGRで5.3%の成長が予測されています。市場は、スマートフォン、タブレット、カーエレクトロニクス、IoT機器などの電子機器の需要の増加によって大幅な成長を示しています。
MLCCは、安全システム、インフォテインメント、エンジン制御ユニットなど、さまざまな用途で重要な役割を果たしています。電気自動車の普及や、従来の自動車への先進の電子機器の統合は、MLCC市場の拡大にさらに寄与しています。市場は、フィルタリング、デカップリング、高静電容量化、バイパス機能の強化を組み込んだ先進の設計の導入により、近年プラスの動向を見せています。これらの革新的な設計は、薄層化と静電容量の向上に重要な役割を果たしています。さらにMLCCは、電磁干渉(EMI)を抑制するためにDC-DCコンバータやAC-ACコンバータに幅広く利用されています。
さらに、MLCCのスマートLCDテレビやLEDテレビへの統合が広がっています。これらのテレビの人気は高まっており、市場の成長加速に大きく寄与すると予測されます。これらの機器へのMLCCの搭載は、最新のテレビ技術に求められる先進の機能と性能をサポートするMLCCの重要性を反映しています。高静電容量や小型化部品の開発など、MLCC技術の革新は依然としてメーカーの焦点となっています。電子産業が進化を続ける中、MLCC市場は、5G技術、IoTの進歩、さまざまな産業で進行中のデジタルトランスフォーメーションによる成長が見込まれています。
例えばGSMAは、2025年までに5Gネットワークが世界人口の約3分の1を網羅すると予測しています。同団体は、2025年末までに5G接続数が20億に達し、全モバイル接続数の5分の1を超えると予測しています。5Gの急速な普及は、5G機能を搭載した機器、特にスマートフォンに対する大きな需要を生み出します。
電気自動車の普及が市場の大幅な成長に寄与
電気自動車(EV)の普及は、自動車用積層セラミックコンデンサ(MLCC)の需要急増の大きなカタリストとなっています。自動車産業が電化へと転換する中、電気自動車とハイブリッド車の両方への電子部品の統合が浸透しています。MLCCはこのパラダイムにおいて極めて重要な役割を果たしており、さまざまな重大な機能をサポートしています。MLCCはエアバッグシステムやESCの適切な機能などの安全機能の確保に不可欠です。さらに、これらのコンデンサはEV内の効果的な電力管理に不可欠であり、エネルギー使用とバッテリーへの蓄電の最適化に寄与しています。電気自動車やハイブリッド車全体の電子アーキテクチャは、信頼性の高い性能を提供し、電子システムの複雑なネットワークを管理するためにMLCCに大きく依存しています。
電気自動車の台頭による自動車部門でのMLCCの高い需要は、現代の自動車の技術情勢を形成する上でMLCCが重要な役割を担っていることを裏付けています。自動車産業が電気の進化を続ける中、安全性、電力効率、全体の電子統合の強化におけるMLCCの重要性は、今後さらに高まることが予測されます。
積層セラミックコンデンサ(MLCC)市場の成長に影響を与える5G技術
5G技術の普及は、市場のもっとも重大な促進要因となっています。より高い周波数とデータ転送速度の大幅な増加を特徴とする5Gネットワークへの世界のシフトは、この最先端の通信規格の要求を満たすためにMLCCなどの先進の部品の統合を必要とします。5Gネットワークは、従来よりも高い周波数で動作し、より高速で効率的なデータ伝送を可能にします。このような高周波に固有の急速な発振と複雑な信号処理には、卓越した性能特性を持つコンデンサが必要です。コンパクトなサイズ、高静電容量、高効率で知られるMLCCは、5Gインフラ内で信号のシームレスな処理とフィルタリングを可能にする上で不可欠です。
通信産業が5Gの革新的な能力を受け入れるにつれて、MLCCに対する需要は、先進のネットワーク技術の複雑で迅速なデータ処理の要件をサポートする上での重要な役割によって推進されています。5GインフラへのMLCCの統合は、より高速で応答性が高く、相互接続された通信システムへの世界の進化を促進する基礎部品としてのMLCCの重要性を強調しています。
当レポートでは、世界の積層セラミックコンデンサ(MLCC)市場について調査分析し、市場規模と予測、市場力学、主要企業の情勢と見通しなどを提供しています。
目次
第1章 調査手法
第2章 プロジェクトの範囲と定義
第3章 積層セラミックコンデンサ(MLCC)市場に対するCOVID-19の影響
第4章 エグゼクティブサマリー
第5章 積層セラミックコンデンサ(MLCC)市場の見通し(2017年~2031年)
- 市場規模と予測
- 金額
- 誘電体タイプ別
- クラス1
- クラス2
- クラス3
- その他
- 電圧範囲別
- 高電圧
- 中電圧
- 低電圧
- エンドユーザー別
- 通信
- 自動車
- 航空
- 軍事、防衛
- コンシューマーエレクトロニクス
- その他
- 地域別
- 北米
- 欧州
- 南米
- アジア太平洋
- 中東・アフリカ
- 市場シェア:企業別(2023年)
第6章 積層セラミックコンデンサ(MLCC)市場の見通し:地域別(2017年~2031年)
- 北米
- 市場規模と予測
- 誘電体タイプ別
- 電圧範囲別
- エンドユーザー別
- 米国
- カナダ
- メキシコ
- 欧州
- ドイツ
- フランス
- イタリア
- 英国
- ロシア
- オランダ
- スペイン
- トルコ
- ポーランド
- 南米
- ブラジル
- アルゼンチン
- アジア太平洋
- インド
- 中国
- 日本
- オーストラリア
- ベトナム
- 韓国
- インドネシア
- フィリピン
- 中東・アフリカ
- サウジアラビア
- アラブ首長国連邦
- 南アフリカ
第7章 市場マッピング(2023年)
- 誘電体タイプ別
- 電圧範囲別
- エンドユーザー別
- 地域別
第8章 マクロ環境と産業構造
- PESTEL分析
- ポーターのファイブフォース分析
第9章 市場力学
- 成長促進要因
- 成長抑制要因(課題、抑制要因)
第10章 主要企業情勢
- マーケットリーダー上位5社の競合マトリクス
- マーケットリーダー上位5社の市場収益分析(2023年)
- 合併と買収/合弁事業(該当する場合)
- SWOT分析(市場参入企業5社)
- 特許分析(該当する場合)
第11章 価格分析(該当する場合)
第12章 ケーススタディ(該当する場合)
第13章 主要企業の見通し
- Murata Manufacturing Co. Ltd
- Taiyo Yuden Co. Ltd
- Kyocera Corporation
- Yageo Corporation
- Walsin Technology Corporation
- Samsung Electro-mechanics Co. Ltd
- EYANG Holdings (Group) Co., Limited
- Vishay Intertechnology, Inc.
- Worth Elektronik Group
- KEMET Corporation
第14章 戦略的推奨事項
第15章 当社について、免責事項
List of Tables
- Table 1. Pricing Analysis of Products from Key Players
- Table 2. Competition Matrix of Top 5 Market Leaders
- Table 3. Mergers & Acquisitions/ Joint Ventures (If Applicable)
- Table 4. About Us - Regions and Countries Where We Have Executed Client Projects
List of Figures
- Figure 1. Global Multi-Layer Ceramic Capacitor Market, By Value, In USD Billion, 2017-2031F
- Figure 2. Global Multi-Layer Ceramic Capacitor Market Share (%), By Dielectric Type, 2017-2031F
- Figure 3. Global Multi-Layer Ceramic Capacitor Market Share (%), By Voltage Range, 2017-2031F
- Figure 4. Global Multi-Layer Ceramic Capacitor Market Share (%), By End-user, 2017-2031F
- Figure 5. Global Multi-Layer Ceramic Capacitor Market Share (%), By Region, 2017-2031F
- Figure 6. North America Multi-Layer Ceramic Capacitor Market, By Value, In USD Billion, 2017-2031F
- Figure 7. North America Multi-Layer Ceramic Capacitor Market Share (%), By Dielectric Type, 2017-2031F
- Figure 8. North America Multi-Layer Ceramic Capacitor Market Share (%), By Voltage Range, 2017-2031F
- Figure 9. North America Multi-Layer Ceramic Capacitor Market Share (%), By End-user, 2017-2031F
- Figure 10. North America Multi-Layer Ceramic Capacitor Market Share (%), By Country, 2017-2031F
- Figure 11. United States Multi-Layer Ceramic Capacitor Market, By Value, In USD Billion, 2017-2031F
- Figure 12. United States Multi-Layer Ceramic Capacitor Market Share (%), By Dielectric Type, 2017-2031F
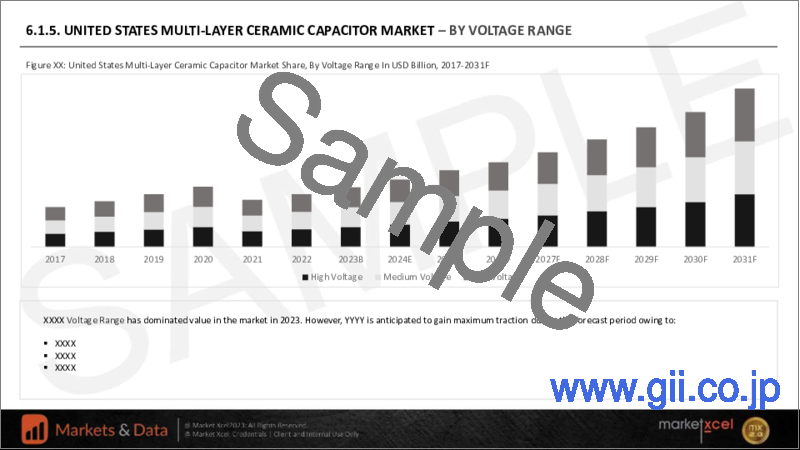
- Figure 13. United States Multi-Layer Ceramic Capacitor Market Share (%), By Voltage Range, 2017-2031F
- Figure 14. United States Multi-Layer Ceramic Capacitor Market Share (%), By End-user, 2017-2031F
- Figure 15. Canada Multi-Layer Ceramic Capacitor Market, By Value, In USD Billion, 2017-2031F
- Figure 16. Canada Multi-Layer Ceramic Capacitor Market Share (%), By Dielectric Type, 2017-2031F
- Figure 17. Canada Multi-Layer Ceramic Capacitor Market Share (%), By Voltage Range, 2017-2031F
- Figure 18. Canada Multi-Layer Ceramic Capacitor Market Share (%), By End-user, 2017-2031F
- Figure 19. Mexico Multi-Layer Ceramic Capacitor Market, By Value, In USD Billion, 2017-2031F
- Figure 20. Mexico Multi-Layer Ceramic Capacitor Market Share (%), By Dielectric Type, 2017-2031F
- Figure 21. Mexico Multi-Layer Ceramic Capacitor Market Share (%), By Voltage Range, 2017-2031F
- Figure 22. Mexico Multi-Layer Ceramic Capacitor Market Share (%), By End-user, 2017-2031F
- Figure 23. Europe Multi-Layer Ceramic Capacitor Market, By Value, In USD Billion, 2017-2031F
- Figure 24. Europe Multi-Layer Ceramic Capacitor Market Share (%), By Dielectric Type, 2017-2031F
- Figure 25. Europe Multi-Layer Ceramic Capacitor Market Share (%), By Voltage Range, 2017-2031F
- Figure 26. Europe Multi-Layer Ceramic Capacitor Market Share (%), By End-user, 2017-2031F
- Figure 27. Europe Multi-Layer Ceramic Capacitor Market Share (%), By Country, 2017-2031F
- Figure 28. Germany Multi-Layer Ceramic Capacitor Market, By Value, In USD Billion, 2017-2031F
- Figure 29. Germany Multi-Layer Ceramic Capacitor Market Share (%), By Dielectric Type, 2017-2031F
- Figure 30. Germany Multi-Layer Ceramic Capacitor Market Share (%), By Voltage Range, 2017-2031F
- Figure 31. Germany Multi-Layer Ceramic Capacitor Market Share (%), By End-user, 2017-2031F
- Figure 32. France Multi-Layer Ceramic Capacitor Market, By Value, In USD Billion, 2017-2031F
- Figure 33. France Multi-Layer Ceramic Capacitor Market Share (%), By Dielectric Type, 2017-2031F
- Figure 34. France Multi-Layer Ceramic Capacitor Market Share (%), By Voltage Range, 2017-2031F
- Figure 35. France Multi-Layer Ceramic Capacitor Market Share (%), By End-user, 2017-2031F
- Figure 36. Italy Multi-Layer Ceramic Capacitor Market, By Value, In USD Billion, 2017-2031F
- Figure 37. Italy Multi-Layer Ceramic Capacitor Market Share (%), By Dielectric Type, 2017-2031F
- Figure 38. Italy Multi-Layer Ceramic Capacitor Market Share (%), By Voltage Range, 2017-2031F
- Figure 39. Italy Multi-Layer Ceramic Capacitor Market Share (%), By End-user, 2017-2031F
- Figure 40. United Kingdom Multi-Layer Ceramic Capacitor Market, By Value, In USD Billion, 2017-2031F
- Figure 41. United Kingdom Multi-Layer Ceramic Capacitor Market Share (%), By Dielectric Type, 2017-2031F
- Figure 42. United Kingdom Multi-Layer Ceramic Capacitor Market Share (%), By Voltage Range, 2017-2031F
- Figure 43. United Kingdom Multi-Layer Ceramic Capacitor Market Share (%), By End-user, 2017-2031F
- Figure 44. Russia Multi-Layer Ceramic Capacitor Market, By Value, In USD Billion, 2017-2031F
- Figure 45. Russia Multi-Layer Ceramic Capacitor Market Share (%), By Dielectric Type, 2017-2031F
- Figure 46. Russia Multi-Layer Ceramic Capacitor Market Share (%), By Voltage Range, 2017-2031F
- Figure 47. Russia Multi-Layer Ceramic Capacitor Market Share (%), By End-user, 2017-2031F
- Figure 48. Netherlands Multi-Layer Ceramic Capacitor Market, By Value, In USD Billion, 2017-2031F
- Figure 49. Netherlands Multi-Layer Ceramic Capacitor Market Share (%), By Dielectric Type, 2017-2031F
- Figure 50. Netherlands Multi-Layer Ceramic Capacitor Market Share (%), By Voltage Range, 2017-2031F
- Figure 51. Netherlands Multi-Layer Ceramic Capacitor Market Share (%), By End-user, 2017-2031F
- Figure 52. Spain Multi-Layer Ceramic Capacitor Market, By Value, In USD Billion, 2017-2031F
- Figure 53. Spain Multi-Layer Ceramic Capacitor Market Share (%), By Dielectric Type, 2017-2031F
- Figure 54. Spain Multi-Layer Ceramic Capacitor Market Share (%), By Voltage Range, 2017-2031F
- Figure 55. Spain Multi-Layer Ceramic Capacitor Market Share (%), By End-user, 2017-2031F
- Figure 56. Turkey Multi-Layer Ceramic Capacitor Market, By Value, In USD Billion, 2017-2031F
- Figure 57. Turkey Multi-Layer Ceramic Capacitor Market Share (%), By Dielectric Type, 2017-2031F
- Figure 58. Turkey Multi-Layer Ceramic Capacitor Market Share (%), By Voltage Range, 2017-2031F
- Figure 59. Turkey Multi-Layer Ceramic Capacitor Market Share (%), By End-user, 2017-2031F
- Figure 60. Poland Multi-Layer Ceramic Capacitor Market, By Value, In USD Billion, 2017-2031F
- Figure 61. Poland Multi-Layer Ceramic Capacitor Market Share (%), By Dielectric Type, 2017-2031F
- Figure 62. Poland Multi-Layer Ceramic Capacitor Market Share (%), By Voltage Range, 2017-2031F
- Figure 63. Poland Multi-Layer Ceramic Capacitor Market Share (%), By End-user, 2017-2031F
- Figure 64. South America Multi-Layer Ceramic Capacitor Market, By Value, In USD Billion, 2017-2031F
- Figure 65. South America Multi-Layer Ceramic Capacitor Market Share (%), By Dielectric Type, 2017-2031F
- Figure 66. South America Multi-Layer Ceramic Capacitor Market Share (%), By Voltage Range, 2017-2031F
- Figure 67. South America Multi-Layer Ceramic Capacitor Market Share (%), By End-user, 2017-2031F
- Figure 68. South America Multi-Layer Ceramic Capacitor Market Share (%), By Country, 2017-2031F
- Figure 69. Brazil Multi-Layer Ceramic Capacitor Market, By Value, In USD Billion, 2017-2031F
- Figure 70. Brazil Multi-Layer Ceramic Capacitor Market Share (%), By Dielectric Type, 2017-2031F
- Figure 71. Brazil Multi-Layer Ceramic Capacitor Market Share (%), By Voltage Range, 2017-2031F
- Figure 72. Brazil Multi-Layer Ceramic Capacitor Market Share (%), By End-user, 2017-2031F
- Figure 73. Argentina Multi-Layer Ceramic Capacitor Market, By Value, In USD Billion, 2017-2031F
- Figure 74. Argentina Multi-Layer Ceramic Capacitor Market Share (%), By Dielectric Type, 2017-2031F
- Figure 75. Argentina Multi-Layer Ceramic Capacitor Market Share (%), By Voltage Range, 2017-2031F
- Figure 76. Argentina Multi-Layer Ceramic Capacitor Market Share (%), By End-user, 2017-2031F
- Figure 77. Asia-Pacific Multi-Layer Ceramic Capacitor Market, By Value, In USD Billion, 2017-2031F
- Figure 78. Asia-Pacific Multi-Layer Ceramic Capacitor Market Share (%), By Dielectric Type, 2017-2031F
- Figure 79. Asia-Pacific Multi-Layer Ceramic Capacitor Market Share (%), By Voltage Range, 2017-2031F
- Figure 80. Asia-Pacific Multi-Layer Ceramic Capacitor Market Share (%), By End-user, 2017-2031F
- Figure 81. Asia-Pacific Multi-Layer Ceramic Capacitor Market Share (%), By End-use Industry, 2017-2031F
- Figure 82. Asia-Pacific Multi-Layer Ceramic Capacitor Market Share (%), By Country, 2017-2031F
- Figure 83. India Multi-Layer Ceramic Capacitor Market, By Value, In USD Billion, 2017-2031F
- Figure 84. India Multi-Layer Ceramic Capacitor Market Share (%), By Dielectric Type, 2017-2031F
- Figure 85. India Multi-Layer Ceramic Capacitor Market Share (%), By Voltage Range, 2017-2031F
- Figure 86. India Multi-Layer Ceramic Capacitor Market Share (%), By End-user, 2017-2031F
- Figure 87. China Multi-Layer Ceramic Capacitor Market, By Value, In USD Billion, 2017-2031F
- Figure 88. China Multi-Layer Ceramic Capacitor Market Share (%), By Dielectric Type, 2017-2031F
- Figure 89. China Multi-Layer Ceramic Capacitor Market Share (%), By Voltage Range, 2017-2031F
- Figure 90. China Multi-Layer Ceramic Capacitor Market Share (%), By End-user, 2017-2031F
- Figure 91. Japan Multi-Layer Ceramic Capacitor Market, By Value, In USD Billion, 2017-2031F
- Figure 92. Japan Multi-Layer Ceramic Capacitor Market Share (%), By Dielectric Type, 2017-2031F
- Figure 93. Japan Multi-Layer Ceramic Capacitor Market Share (%), By Voltage Range, 2017-2031F
- Figure 94. Japan Multi-Layer Ceramic Capacitor Market Share (%), By End-user, 2017-2031F
- Figure 95. Australia Multi-Layer Ceramic Capacitor Market, By Value, In USD Billion, 2017-2031F
- Figure 96. Australia Multi-Layer Ceramic Capacitor Market Share (%), By Dielectric Type, 2017-2031F
- Figure 97. Australia Multi-Layer Ceramic Capacitor Market Share (%), By Voltage Range, 2017-2031F
- Figure 98. Australia Multi-Layer Ceramic Capacitor Market Share (%), By End-user, 2017-2031F
- Figure 99. Vietnam Multi-Layer Ceramic Capacitor Market, By Value, In USD Billion, 2017-2031F
- Figure 100. Vietnam Multi-Layer Ceramic Capacitor Market Share (%), By Dielectric Type, 2017-2031F
- Figure 101. Vietnam Multi-Layer Ceramic Capacitor Market Share (%), By Voltage Range, 2017-2031F
- Figure 102. Vietnam Multi-Layer Ceramic Capacitor Market Share (%), By End-user, 2017-2031F
- Figure 103. South Korea Multi-Layer Ceramic Capacitor Market, By Value, In USD Billion, 2017-2031F
- Figure 104. South Korea Multi-Layer Ceramic Capacitor Market Share (%), By Dielectric Type, 2017-2031F
- Figure 105. South Korea Multi-Layer Ceramic Capacitor Market Share (%), By Voltage Range, 2017-2031F
- Figure 106. South Korea Multi-Layer Ceramic Capacitor Market Share (%), By End-user, 2017-2031F
- Figure 107. Indonesia Multi-Layer Ceramic Capacitor Market, By Value, In USD Billion, 2017-2031F
- Figure 108. Indonesia Multi-Layer Ceramic Capacitor Market Share (%), By Dielectric Type, 2017-2031F
- Figure 109. Indonesia Multi-Layer Ceramic Capacitor Market Share (%), By Voltage Range, 2017-2031F
- Figure 110. Indonesia Multi-Layer Ceramic Capacitor Market Share (%), By End-user, 2017-2031F
- Figure 111. Philippines Multi-Layer Ceramic Capacitor Market, By Value, In USD Billion, 2017-2031F
- Figure 112. Philippines Multi-Layer Ceramic Capacitor Market Share (%), By Dielectric Type, 2017-2031F
- Figure 113. Philippines Multi-Layer Ceramic Capacitor Market Share (%), By Voltage Range, 2017-2031F
- Figure 114. Philippines Multi-Layer Ceramic Capacitor Market Share (%), By End-user, 2017-2031F
- Figure 115. Middle East & Africa Multi-Layer Ceramic Capacitor Market, By Value, In USD Billion, 2017-2031F
- Figure 116. Middle East & Africa Multi-Layer Ceramic Capacitor Market Share (%), By Dielectric Type, 2017-2031F
- Figure 117. Middle East & Africa Multi-Layer Ceramic Capacitor Market Share (%), By Voltage Range, 2017-2031F
- Figure 118. Middle East & Africa Multi-Layer Ceramic Capacitor Market Share (%), By End-user, 2017-2031F
- Figure 119. Middle East & Africa Multi-Layer Ceramic Capacitor Market Share (%), By Country, 2017-2031F
- Figure 120. Saudi Arabia Multi-Layer Ceramic Capacitor Market, By Value, In USD Billion, 2017-2031F
- Figure 121. Saudi Arabia Multi-Layer Ceramic Capacitor Market Share (%), By Dielectric Type, 2017-2031F
- Figure 122. Saudi Arabia Multi-Layer Ceramic Capacitor Market Share (%), By Voltage Range, 2017-2031F
- Figure 123. Saudi Arabia Multi-Layer Ceramic Capacitor Market Share (%), By End-user, 2017-2031F
- Figure 124. UAE Multi-Layer Ceramic Capacitor Market, By Value, In USD Billion, 2017-2031F
- Figure 125. UAE Multi-Layer Ceramic Capacitor Market Share (%), By Dielectric Type, 2017-2031F
- Figure 126. UAE Multi-Layer Ceramic Capacitor Market Share (%), By Voltage Range, 2017-2031F
- Figure 127. UAE Multi-Layer Ceramic Capacitor Market Share (%), By End-user, 2017-2031F
- Figure 128. South Africa Multi-Layer Ceramic Capacitor Market, By Value, In USD Billion, 2017-2031F
- Figure 129. South Africa Multi-Layer Ceramic Capacitor Market Share (%), By Dielectric Type, 2017-2031F
- Figure 130. South Africa Multi-Layer Ceramic Capacitor Market Share (%), By Voltage Range, 2017-2031F
- Figure 131. South Africa Multi-Layer Ceramic Capacitor Market Share (%), By End-user, 2017-2031F
- Figure 132. By Dielectric Type Map-Market Size (USD Billion) & Growth Rate (%), 2023
- Figure 133. By Voltage Range Map-Market Size (USD Billion) & Growth Rate (%), 2023
- Figure 134. By End-user Map-Market Size (USD Billion) & Growth Rate (%), 2023
- Figure 135. By Region Map-Market Size (USD Billion) & Growth Rate (%), 2023
Global multi-layer ceramic capacitor market size was valued at USD 14.1 billion in 2023, the market is forecasted to reach a value of USD 21.31 billion by 2031, displaying a CAGR of 5.3% from 2024 to 2031. The multi-layer ceramic capacitor (MLCC) is a dynamic and essential component of the electronics industry. MLCCs are widely used in electronic devices for energy storage and signal filtering due to their compact size, high capacitance, and reliability. The market has experienced substantial growth driven by the increasing demand for electronic devices such as smartphones, tablets, automotive electronics, and IoT devices.
One of the key factors fueling the market is the escalating adoption of MLCCs in the automotive sector, where they are crucial for various applications, including safety systems, infotainment, and engine control units. The proliferation of electric vehicles and the integration of advanced electronics in traditional vehicles further contribute to the MLCC market expansion. The MLCC market has experienced positive trends in recent years due to the introduction of advanced designs that incorporate improved filtering, decoupling, higher capacitance, and enhanced bypassing capabilities. These innovative designs play a crucial role in achieving thinner layers and enhanced charge capacity. Additionally, MLCCs find extensive application in DC-DC and AC-AC converters to suppress Electromagnetic Interference (EMI).
Furthermore, the integration of MLCCs into smart LCD and LED televisions has become widespread. The rising popularity of these televisions is anticipated to contribute significantly to the accelerated growth of the market. The inclusion of MLCCs in these devices reflects their importance in supporting the sophisticated functionalities and performance requirements of modern television technology. Innovation in MLCC technology, such as the development of high-capacitance and miniaturized components, remains a focal point for manufacturers. As the electronics industry continues to evolve, the MLCC market is expected to grow, driven by advancements in 5G technology, Internet of Things (IoT), and the ongoing digital transformation across various industries.
For instance, GSMA, a global smartphone association, anticipates that by 2025, 5G networks will encompass approximately one-third of the global population. The organization estimates that by the conclusion of 2025, the number of 5G connections to reach 2 billion, constituting more than a fifth of all mobile connections. The surge in 5G adoption generates substantial demand for devices equipped with 5G capabilities, particularly smartphones.
Electric Vehicle Proliferation Contribute Significant Market Growth
The proliferation of electric vehicles (EVs) is a significant catalyst for the demand surge in multi-layer ceramic capacitors (MLCCs) within automotive applications. As the automotive industry undergoes a transformative shift towards electrification, the integration of electronic components in both electric and hybrid vehicles has become pervasive. MLCCs play a pivotal role in this paradigm, supporting various critical functions. MLCCs are integral to ensuring safety features, such as the proper functioning of airbag systems and electronic stability control. Moreover, these capacitors are essential for effective power management within EVs, contributing to the optimization of energy usage and storage in batteries. The overall electronic architecture of electric and hybrid vehicles heavily relies on MLCCs to provide reliable performance and manage the complex network of electronic systems.
The heightened demand for MLCCs in the automotive sector, driven by the rise of electric vehicles, underscores their crucial role in shaping the technological landscape of modern vehicles. As the automotive industry continues its electric evolution, the significance of MLCCs in enhancing safety, power efficiency, and overall electronic integration is poised to grow even further.
For instance, in May 2023, Samsung Electro-Mechanics proudly achieved a milestone by introducing the industry's highest capacitance at high voltage in MLCC for electric vehicles. This accomplishment is part of the company's strategic initiative to broaden its range of high-end automotive electronic components. The newly launched MLCCs have been meticulously developed with a specific emphasis on their suitability for electric vehicle (EV) applications. They come with impressive voltage ratings of 250V and 100V, ensuring robust performance in the demanding environment of EVs. Additionally, these capacitors are designed to operate effectively within a temperature range of 125°C, further enhancing their suitability for the unique challenges posed by electric vehicle systems.
5G Technology Influencing Multi-Layer Ceramic Capacitor Market Growth
The widespread adoption of 5G technology stands as a paramount driver for the multi-layer ceramic capacitor (MLCC) market. The global shift toward 5G networks, characterized by higher frequencies and substantially increased data transfer rates, necessitates the integration of advanced components such as MLCCs to meet the demands of this cutting-edge telecommunications standard. 5G networks operate at higher frequencies than their predecessors, enabling faster and more efficient data transmission. The rapid oscillations and intricate signal processing inherent in these higher frequencies demand capacitors with exceptional performance characteristics. MLCCs, known for their compact size, high capacitance, and efficiency, are essential in enabling the seamless processing and filtering of signals within 5G infrastructure.
As the telecommunications industry embraces the transformative capabilities of 5G, the demand for MLCCs is propelled by their crucial role in supporting the complex and rapid data processing requirements of this advanced network technology. The integration of MLCCs in 5G infrastructure underscores their significance as foundational components facilitating the global evolution toward faster, more responsive, and interconnected telecommunications systems.
For instance, in November 2021, Samsung Electro-Mechanics revealed the successful development of a high-capacitance, high-voltage Multi-Layer Ceramic Capacitor (MLCC) specifically designed for 5G communication base stations. This innovative MLCC, categorized as size 3225 (with dimensions of 3.2mm in width and 2.5mm in height), boasts a remarkable capacitance of 10uF (microfarad) and a high-rated voltage of 100V (volt).
Asia-Pacific Dominates the Multi-Layer Ceramic Capacitor Market
Asia-Pacific is dominant in the multi-layer ceramic capacitor (MLCC) market, underscoring its pivotal role in the global electronics industry. Several factors contribute to this regional dominance. Asia-Pacific is home to major manufacturing hubs, including China, Japan, and South Korea, where a substantial portion of the world's electronic devices are produced. These countries serve as significant consumers and electronic goods producers, fostering a robust demand for MLCCs.
Recognizing the immense growth potential and to meet the surging demand, several automakers have made substantial investments across diverse segments of the Indian automotive industry. In alignment with this, IBEF reports that the Indian automotive industry is striving to quintuple vehicle exports between 2016 and 2026. As of the fiscal year 2022, the total number of automobiles exported from India reached a noteworthy figure of 5,617,246 units. It underscores the industry's commitment to meeting global demands and establishing India as a significant player in the international automotive market. Translating this into the context of the multi-layer ceramic capacitor (MLCC) market, the increased production and export of vehicles in India is contributing to the growing demand for electronic components, including MLCCs, in the automotive manufacturing landscape.
Lack of Production of MLCCs Poses Obstacle to Expand of the Market Worldwide
Multi-layer ceramic capacitors (MLCCs), recognized for their efficiency and durability, are facilitating swift innovation across diverse industries and applications. Nevertheless, a global shortage currently impedes their supply, particularly in conventional, non-specialized geometries. The heightened demand for MLCCs, driven by substantial advancements in IoT, consumer electronics, and electric vehicles (EV), has constrained progress in these sectors, with lead times extending to several months or even a year due to the capacitor's scarcity.
Typically, high-value manufacturers exit due to heightened competition and profit struggles, allowing lower-value mass producers to take over with reduced overhead. However, the multi-layer ceramic capacitor (MLCC) market doesn't conform to this pattern. In May, the average capacity utilization rate for Japanese suppliers was 78%, while the rates for Chinese, Taiwanese, and South Korean suppliers were approximately 60-63%.
Impact of COVID-19
The COVID-19 pandemic has significantly impacted the multi-layer ceramic capacitor (MLCC) market. Supply chain disruptions due to lockdowns and restrictions affected production, leading to shortages and extended lead times. The increased demand for electronic devices, particularly in remote work and healthcare sectors, strained the already constrained supply. Manufacturing challenges, such as workforce shortages and operational limitations, further contributed to production delays. The pandemic-induced economic downturn influenced consumer spending and investment decisions, impacting overall market dynamics and pricing strategies. Despite heightened demand in specific sectors, the MLCC market faced uncertainties, price volatility, and a need for strategic adaptation in 2020.
Key Players Landscape and Outlook
The multi-layer ceramic capacitor market is expanding due to the increasing emphasis placed by companies worldwide on establishing advanced technological infrastructure and increasing production base. Furthermore, the market expansion is exponentially facilitated by automotive industry, 5G technology along with significant investments made by companies to enhance research and development resources, engage in collaboration projects, bolster marketing efforts, and expand distribution networks. These factors collectively contribute to the rapid expansion of the market.
In May 2023, Murata Manufacturing Co. Ltd unveiled its latest multi-layer ceramic capacitor (MLCC) designed to meet the rising demand for components featuring increased capacitance levels, compact form factors, and enhanced temperature performance. With capacitance values reaching 10µF (with a ±20% tolerance), the GRM series of MLCCs is available in a 0201inch/0603M package size. Notably, these MLCCs currently stand as the smallest on the market to provide such high capacitance levels, offering a remarkable 65% reduction in size compared to the typically specified 0402-inch/1005M products.
Table of Contents
1. Research Methodology
2. Project Scope & Definitions
3. Impact of COVID-19 on Multi-Layer Ceramic Capacitor Market
4. Executive Summary
5. Multi-Layer Ceramic Capacitor Market Outlook, 2017-2031F
- 5.1. Market Size & Forecast
- 5.1.1. By Value
- 5.2. By Dielectric Type
- 5.2.1. Class 1
- 5.2.2. Class 2
- 5.2.3. Class 3
- 5.2.4. Others
- 5.3. By Voltage Range
- 5.3.1. High Voltage
- 5.3.2. Medium Voltage
- 5.3.3. Low Voltage
- 5.4. By End-user
- 5.4.1. Telecommunication
- 5.4.2. Automotive
- 5.4.3. Aviation
- 5.4.4. Military and Defense
- 5.4.5. Consumer Electronics
- 5.4.6. Others
- 5.5. By Region
- 5.5.1. North America
- 5.5.2. Europe
- 5.5.3. South America
- 5.5.4. Asia-Pacific
- 5.5.5. Middle East and Africa
- 5.6. By Company Market Share (%), 2023
6. Multi-Layer Ceramic Capacitor Market Outlook, By Region, 2017-2031F
- 6.1. North America*
- 6.1.1. Market Size & Forecast
- 6.1.1.1. By Value
- 6.1.2. By Dielectric Type
- 6.1.2.1. Class 1
- 6.1.2.2. Class 2
- 6.1.2.3. Class 3
- 6.1.2.4. Others
- 6.1.3. By Voltage Range
- 6.1.3.1. High Voltage
- 6.1.3.2. Medium Voltage
- 6.1.3.3. Low Voltage
- 6.1.4. By End-user
- 6.1.4.1. Telecommunication
- 6.1.4.2. Automotive
- 6.1.4.3. Aviation
- 6.1.4.4. Military and Defense
- 6.1.4.5. Consumer Electronics
- 6.1.4.6. Others
- 6.1.5. United States*
- 6.1.5.1. Market Size & Forecast
- 6.1.5.1.1. By Value
- 6.1.5.2. By Dielectric Type
- 6.1.5.2.1. Class 1
- 6.1.5.2.2. Class 2
- 6.1.5.2.3. Class 3
- 6.1.5.2.4. Others
- 6.1.5.3. By Voltage Range
- 6.1.5.3.1. High Voltage
- 6.1.5.3.2. Medium Voltage
- 6.1.5.3.3. Low Voltage
- 6.1.5.4. By End-user
- 6.1.5.4.1. Telecommunication
- 6.1.5.4.2. Automotive
- 6.1.5.4.3. Aviation
- 6.1.5.4.4. Military and Defense
- 6.1.5.4.5. Consumer Electronics
- 6.1.5.4.6. Others
- 6.1.6. Canada
- 6.1.7. Mexico
- 6.1.1. Market Size & Forecast
All segments will be provided for all regions and countries covered:
- 6.2. Europe
- 6.2.1. Germany
- 6.2.2. France
- 6.2.3. Italy
- 6.2.4. United Kingdom
- 6.2.5. Russia
- 6.2.6. Netherlands
- 6.2.7. Spain
- 6.2.8. Turkey
- 6.2.9. Poland
- 6.3. South America
- 6.3.1. Brazil
- 6.3.2. Argentina
- 6.4. Asia-Pacific
- 6.4.1. India
- 6.4.2. China
- 6.4.3. Japan
- 6.4.4. Australia
- 6.4.5. Vietnam
- 6.4.6. South Korea
- 6.4.7. Indonesia
- 6.4.8. Philippines
- 6.5. Middle East & Africa
- 6.5.1. Saudi Arabia
- 6.5.2. UAE
- 6.5.3. South Africa
7. Market Mapping, 2023
- 7.1. By Dielectric Type
- 7.2. By Voltage Range
- 7.3. By End-user
- 7.4. By Region
8. Macro Environment and Industry Structure
- 8.1. PESTEL Analysis
- 8.2. Porter's Five Forces Analysis
9. Market Dynamics
- 9.1. Growth Drivers
- 9.2. Growth Inhibitors (Challenges, Restraints)
10. Key Players Landscape
- 10.1. Competition Matrix of Top Five Market Leaders
- 10.2. Market Revenue Analysis of Top Five Market Leaders (in %, 2023)
- 10.3. Mergers and Acquisitions/Joint Ventures (If Applicable)
- 10.4. SWOT Analysis (For Five Market Players)
- 10.5. Patent Analysis (If Applicable)
11. Pricing Analysis (If Applicable)
12. Case Studies (If applicable)
13. Key Players Outlook
- 13.1. Murata Manufacturing Co. Ltd
- 13.1.1. Company Details
- 13.1.2. Key Management Personnel
- 13.1.3. Products & Services
- 13.1.4. Financials (As reported)
- 13.1.5. Key Market Focus & Geographical Presence
- 13.1.6. Recent Developments
- 13.2. Taiyo Yuden Co. Ltd
- 13.3. Kyocera Corporation
- 13.4. Yageo Corporation
- 13.5. Walsin Technology Corporation
- 13.6. Samsung Electro-mechanics Co. Ltd
- 13.7. EYANG Holdings (Group) Co., Limited
- 13.8. Vishay Intertechnology, Inc.
- 13.9. Worth Elektronik Group
- 13.10. KEMET Corporation
Companies mentioned above DO NOT hold any order as per market share and can be changed as per information available during research work.
