|
|
市場調査レポート
商品コード
1762920
積層セラミックコンデンサの世界市場 2025年~2029年Global Multi-layer Ceramic Capacitor Market 2025-2029 |
||||||

|
|||||||
カスタマイズ可能
|
|||||||

| 積層セラミックコンデンサの世界市場 2025年~2029年 |
|
出版日: 2025年07月02日
発行: TechNavio
ページ情報: 英文 247 Pages
納期: 即納可能
|

全表示
- 概要
- 図表
- 目次
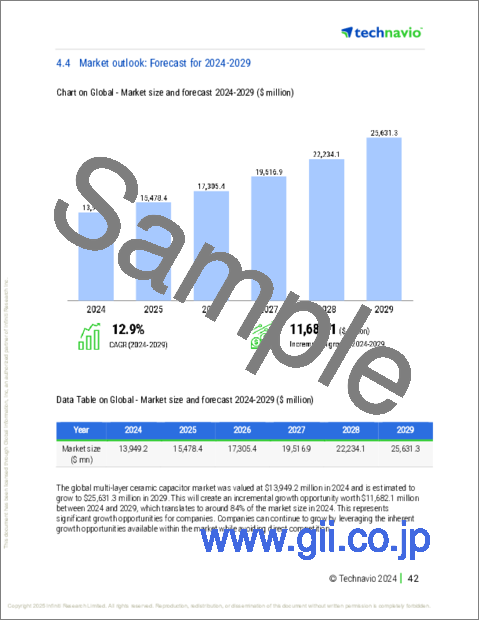
積層セラミックコンデンサ市場は2024年~2029年に116億8,210万米ドル、予測期間中のCAGRは12.9%で成長すると予測されます。
当レポートでは、積層セラミックコンデンサ市場の全体的な分析、市場規模・予測、動向、成長促進要因、課題、約25のベンダーを網羅したベンダー分析などを掲載しています。
現在の市場シナリオ、最新動向と促進要因、市場環境全体に関する最新分析を提供しています。市場は、5G技術と高度通信インフラの普及、自動車分野での電動化と機能高度化の加速、モノのインターネットの普及と家電の進歩によって牽引されています。
| 市場範囲 | |
|---|---|
| 基準年 | 2025年 |
| 終了年 | 2029年 |
| 予測期間 | 2025年~2029年 |
| 成長モメンタム | 加速 |
| 前年比 | 11% |
| CAGR | 12.9% |
| 増分額 | 116億8,210万米ドル |
本調査は、業界の主要参加者からのインプットを含め、一次情報と二次情報を客観的に組み合わせて実施しました。レポートには、主要企業の分析に加え、包括的な市場規模データ、地域分析によるセグメント、ベンダー情勢が含まれています。レポートには過去データと予測データがあります。
本調査では、今後数年間の積層セラミックコンデンサ市場の成長を促進する主要な理由の一つとして、高信頼性の自動車および産業用アプリケーションに向けた戦略的ポートフォリオの軸足を挙げています。また、先進コンピューティング向けの超高容量・低ESLソリューションの開発や、高容量アプリケーションにおける代替キャパシタ技術の採用拡大も、市場の大きな需要につながります。
目次
第1章 エグゼクティブサマリー
- 市場概要
第2章 Technavio分析
- 価格・ライフサイクル・顧客購入バスケット・採用率・購入基準の分析
- インプットの重要性と差別化の要因
- 混乱の要因
- 促進要因と課題の影響
第3章 市場情勢
- 市場エコシステム
- 市場の特徴
- バリューチェーン分析
第4章 市場規模
- 市場の定義
- 市場セグメント分析
- 市場規模 2024年
- 市場の見通し 2024年~2029年
第5章 市場規模実績
- 積層セラミックコンデンサの世界市場 2019年~2023年
- 用途別セグメント分析 2019年~2023年
- タイプ別セグメント分析 2019年~2023年
- 出力定格別セグメント分析 2019年~2023年
- 地域別セグメント分析 2019年~2023年
- 国別セグメント分析 2019年~2023年
第6章 定性分析
- 積層セラミックコンデンサの世界市場におけるAIの影響
第7章 ファイブフォース分析
- ファイブフォースの要約
- 買い手の交渉力
- 供給企業の交渉力
- 新規参入業者の脅威
- 代替品の脅威
- 競争の脅威
- 市況
第8章 市場セグメンテーション:用途別
- 市場セグメント
- 比較:用途別
- 家電:市場規模と予測 2024年~2029年
- 電気自動車:市場規模と予測 2024年~2029年
- ADAS:市場規模と予測 2024年~2029年
- ナビゲーションシステム:市場規模と予測 2024年~2029年
- その他:市場規模と予測 2024年~2029年
- 市場機会:用途別
第9章 市場セグメンテーション:タイプ別
- 市場セグメント
- 比較:タイプ別
- 一般的なコンデンサ:市場規模と予測 2024年~2029年
- 配列:市場規模と予測 2024年~2029年
- 常用構築:市場規模と予測 2024年~2029年
- メガキャップ:市場規模と予測 2024年~2029年
- その他:市場規模と予測 2024年~2029年
- 市場機会:タイプ別
第10章 市場セグメンテーション:出力定格別
- 市場セグメント
- 比較:出力定格別
- 低域:市場規模と予測 2024年~2029年
- 中域:市場規模と予測 2024年~2029年
- 高域:市場規模と予測 2024年~2029年
- 市場機会:出力定格別
第11章 顧客情勢
- 顧客情勢の概要
第12章 地域別情勢
- 地域別セグメンテーション
- 地域別比較
- アジア太平洋:市場規模と予測 2024年~2029年
- 北米:市場規模と予測 2024年~2029年
- 欧州:市場規模と予測 2024年~2029年
- 南米:市場規模と予測 2024年~2029年
- 中東・アフリカ:市場規模と予測 2024年~2029年
- 中国:市場規模と予測 2024年~2029年
- 米国:市場規模と予測 2024年~2029年
- 日本:市場規模と予測 2024年~2029年
- カナダ:市場規模と予測 2024年~2029年
- 韓国:市場規模と予測 2024年~2029年
- ドイツ:市場規模と予測 2024年~2029年
- フランス:市場規模と予測 2024年~2029年
- インド:市場規模と予測 2024年~2029年
- 英国:市場規模と予測 2024年~2029年
- ブラジル:市場規模と予測 2024年~2029年
- 市場機会:地域情勢別
第13章 促進要因・課題・機会・抑制要因
- 市場促進要因
- 市場の課題
- 促進要因と課題の影響
- 市場の機会・抑制要因
第14章 競合情勢
- 概要
- 競合情勢
- 混乱の状況
- 業界のリスク
第15章 競合分析
- 企業プロファイル
- 企業ランキング指数
- 企業の市場ポジショニング
- Fenghua HK Electronics Ltd
- Johanson Dielectrics Inc.
- KYOCERA Corp.
- MARUWA CO. LTD.
- Murata Manufacturing Co. Ltd.
- Nippon Chemi-Con Corp.
- Panasonic Holdings Corp.
- Samsung Electro-Mechanics
- Samwha Electronics
- Shenzhen Eyang Technology Development Co. Ltd.
- TAIYO YUDEN Co. Ltd.
- TDK Corp.
- Vishay Intertechnology Inc.
- Walsin Technologies Corp.
- Yageo Corp.
第16章 付録
Exhibits:
- Exhibits1: Executive Summary - Chart on Market Overview
- Exhibits2: Executive Summary - Data Table on Market Overview
- Exhibits3: Executive Summary - Chart on Global Market Characteristics
- Exhibits4: Executive Summary - Chart on Market By Geographical Landscape
- Exhibits5: Executive Summary - Chart on Market Segmentation by Application
- Exhibits6: Executive Summary - Chart on Market Segmentation by Type
- Exhibits7: Executive Summary - Chart on Market Segmentation by Power Rating
- Exhibits8: Executive Summary - Chart on Incremental Growth
- Exhibits9: Executive Summary - Data Table on Incremental Growth
- Exhibits10: Executive Summary - Chart on Company Market Positioning
- Exhibits11: Analysis of price sensitivity, lifecycle, customer purchase basket, adoption rates, and purchase criteria
- Exhibits12: Overview on criticality of inputs and factors of differentiation
- Exhibits13: Overview on factors of disruption
- Exhibits14: Impact of drivers and challenges in 2024 and 2029
- Exhibits15: Parent Market
- Exhibits16: Data Table on - Parent Market
- Exhibits17: Market characteristics analysis
- Exhibits18: Value chain analysis
- Exhibits19: Offerings of companies included in the market definition
- Exhibits20: Market segments
- Exhibits21: Chart on Global - Market size and forecast 2024-2029 ($ million)
- Exhibits22: Data Table on Global - Market size and forecast 2024-2029 ($ million)
- Exhibits23: Chart on Global Market: Year-over-year growth 2024-2029 (%)
- Exhibits24: Data Table on Global Market: Year-over-year growth 2024-2029 (%)
- Exhibits25: Historic Market Size - Data Table on Global Multi-Layer Ceramic Capacitor Market 2019 - 2023 ($ million)
- Exhibits26: Historic Market Size - Application Segment 2019 - 2023 ($ million)
- Exhibits27: Historic Market Size - Type Segment 2019 - 2023 ($ million)
- Exhibits28: Historic Market Size - Power Rating Segment 2019 - 2023 ($ million)
- Exhibits29: Historic Market Size - Geography Segment 2019 - 2023 ($ million)
- Exhibits30: Historic Market Size - Country Segment 2019 - 2023 ($ million)
- Exhibits31: Five forces analysis - Comparison between 2024 and 2029
- Exhibits32: Bargaining power of buyers - Impact of key factors 2024 and 2029
- Exhibits33: Bargaining power of suppliers - Impact of key factors in 2024 and 2029
- Exhibits34: Threat of new entrants - Impact of key factors in 2024 and 2029
- Exhibits35: Threat of substitutes - Impact of key factors in 2024 and 2029
- Exhibits36: Threat of rivalry - Impact of key factors in 2024 and 2029
- Exhibits37: Chart on Market condition - Five forces 2024 and 2029
- Exhibits38: Chart on Application - Market share 2024-2029 (%)
- Exhibits39: Data Table on Application - Market share 2024-2029 (%)
- Exhibits40: Chart on Comparison by Application
- Exhibits41: Data Table on Comparison by Application
- Exhibits42: Chart on Consumer electronics - Market size and forecast 2024-2029 ($ million)
- Exhibits43: Data Table on Consumer electronics - Market size and forecast 2024-2029 ($ million)
- Exhibits44: Chart on Consumer electronics - Year-over-year growth 2024-2029 (%)
- Exhibits45: Data Table on Consumer electronics - Year-over-year growth 2024-2029 (%)
- Exhibits46: Chart on Electric vehicles - Market size and forecast 2024-2029 ($ million)
- Exhibits47: Data Table on Electric vehicles - Market size and forecast 2024-2029 ($ million)
- Exhibits48: Chart on Electric vehicles - Year-over-year growth 2024-2029 (%)
- Exhibits49: Data Table on Electric vehicles - Year-over-year growth 2024-2029 (%)
- Exhibits50: Chart on ADAS - Market size and forecast 2024-2029 ($ million)
- Exhibits51: Data Table on ADAS - Market size and forecast 2024-2029 ($ million)
- Exhibits52: Chart on ADAS - Year-over-year growth 2024-2029 (%)
- Exhibits53: Data Table on ADAS - Year-over-year growth 2024-2029 (%)
- Exhibits54: Chart on Navigation systems - Market size and forecast 2024-2029 ($ million)
- Exhibits55: Data Table on Navigation systems - Market size and forecast 2024-2029 ($ million)
- Exhibits56: Chart on Navigation systems - Year-over-year growth 2024-2029 (%)
- Exhibits57: Data Table on Navigation systems - Year-over-year growth 2024-2029 (%)
- Exhibits58: Chart on Others - Market size and forecast 2024-2029 ($ million)
- Exhibits59: Data Table on Others - Market size and forecast 2024-2029 ($ million)
- Exhibits60: Chart on Others - Year-over-year growth 2024-2029 (%)
- Exhibits61: Data Table on Others - Year-over-year growth 2024-2029 (%)
- Exhibits62: Market opportunity by Application ($ million)
- Exhibits63: Data Table on Market opportunity by Application ($ million)
- Exhibits64: Chart on Type - Market share 2024-2029 (%)
- Exhibits65: Data Table on Type - Market share 2024-2029 (%)
- Exhibits66: Chart on Comparison by Type
- Exhibits67: Data Table on Comparison by Type
- Exhibits68: Chart on General capacitor - Market size and forecast 2024-2029 ($ million)
- Exhibits69: Data Table on General capacitor - Market size and forecast 2024-2029 ($ million)
- Exhibits70: Chart on General capacitor - Year-over-year growth 2024-2029 (%)
- Exhibits71: Data Table on General capacitor - Year-over-year growth 2024-2029 (%)
- Exhibits72: Chart on Array - Market size and forecast 2024-2029 ($ million)
- Exhibits73: Data Table on Array - Market size and forecast 2024-2029 ($ million)
- Exhibits74: Chart on Array - Year-over-year growth 2024-2029 (%)
- Exhibits75: Data Table on Array - Year-over-year growth 2024-2029 (%)
- Exhibits76: Chart on Serial construction - Market size and forecast 2024-2029 ($ million)
- Exhibits77: Data Table on Serial construction - Market size and forecast 2024-2029 ($ million)
- Exhibits78: Chart on Serial construction - Year-over-year growth 2024-2029 (%)
- Exhibits79: Data Table on Serial construction - Year-over-year growth 2024-2029 (%)
- Exhibits80: Chart on Mega cap - Market size and forecast 2024-2029 ($ million)
- Exhibits81: Data Table on Mega cap - Market size and forecast 2024-2029 ($ million)
- Exhibits82: Chart on Mega cap - Year-over-year growth 2024-2029 (%)
- Exhibits83: Data Table on Mega cap - Year-over-year growth 2024-2029 (%)
- Exhibits84: Chart on Others - Market size and forecast 2024-2029 ($ million)
- Exhibits85: Data Table on Others - Market size and forecast 2024-2029 ($ million)
- Exhibits86: Chart on Others - Year-over-year growth 2024-2029 (%)
- Exhibits87: Data Table on Others - Year-over-year growth 2024-2029 (%)
- Exhibits88: Market opportunity by Type ($ million)
- Exhibits89: Data Table on Market opportunity by Type ($ million)
- Exhibits90: Chart on Power Rating - Market share 2024-2029 (%)
- Exhibits91: Data Table on Power Rating - Market share 2024-2029 (%)
- Exhibits92: Chart on Comparison by Power Rating
- Exhibits93: Data Table on Comparison by Power Rating
- Exhibits94: Chart on Low range - Market size and forecast 2024-2029 ($ million)
- Exhibits95: Data Table on Low range - Market size and forecast 2024-2029 ($ million)
- Exhibits96: Chart on Low range - Year-over-year growth 2024-2029 (%)
- Exhibits97: Data Table on Low range - Year-over-year growth 2024-2029 (%)
- Exhibits98: Chart on Medium range - Market size and forecast 2024-2029 ($ million)
- Exhibits99: Data Table on Medium range - Market size and forecast 2024-2029 ($ million)
- Exhibits100: Chart on Medium range - Year-over-year growth 2024-2029 (%)
- Exhibits101: Data Table on Medium range - Year-over-year growth 2024-2029 (%)
- Exhibits102: Chart on High range - Market size and forecast 2024-2029 ($ million)
- Exhibits103: Data Table on High range - Market size and forecast 2024-2029 ($ million)
- Exhibits104: Chart on High range - Year-over-year growth 2024-2029 (%)
- Exhibits105: Data Table on High range - Year-over-year growth 2024-2029 (%)
- Exhibits106: Market opportunity by Power Rating ($ million)
- Exhibits107: Data Table on Market opportunity by Power Rating ($ million)
- Exhibits108: Analysis of price sensitivity, lifecycle, customer purchase basket, adoption rates, and purchase criteria
- Exhibits109: Chart on Market share By Geographical Landscape 2024-2029 (%)
- Exhibits110: Data Table on Market share By Geographical Landscape 2024-2029 (%)
- Exhibits111: Chart on Geographic comparison
- Exhibits112: Data Table on Geographic comparison
- Exhibits113: Chart on APAC - Market size and forecast 2024-2029 ($ million)
- Exhibits114: Data Table on APAC - Market size and forecast 2024-2029 ($ million)
- Exhibits115: Chart on APAC - Year-over-year growth 2024-2029 (%)
- Exhibits116: Data Table on APAC - Year-over-year growth 2024-2029 (%)
- Exhibits117: Chart on North America - Market size and forecast 2024-2029 ($ million)
- Exhibits118: Data Table on North America - Market size and forecast 2024-2029 ($ million)
- Exhibits119: Chart on North America - Year-over-year growth 2024-2029 (%)
- Exhibits120: Data Table on North America - Year-over-year growth 2024-2029 (%)
- Exhibits121: Chart on Europe - Market size and forecast 2024-2029 ($ million)
- Exhibits122: Data Table on Europe - Market size and forecast 2024-2029 ($ million)
- Exhibits123: Chart on Europe - Year-over-year growth 2024-2029 (%)
- Exhibits124: Data Table on Europe - Year-over-year growth 2024-2029 (%)
- Exhibits125: Chart on South America - Market size and forecast 2024-2029 ($ million)
- Exhibits126: Data Table on South America - Market size and forecast 2024-2029 ($ million)
- Exhibits127: Chart on South America - Year-over-year growth 2024-2029 (%)
- Exhibits128: Data Table on South America - Year-over-year growth 2024-2029 (%)
- Exhibits129: Chart on Middle East and Africa - Market size and forecast 2024-2029 ($ million)
- Exhibits130: Data Table on Middle East and Africa - Market size and forecast 2024-2029 ($ million)
- Exhibits131: Chart on Middle East and Africa - Year-over-year growth 2024-2029 (%)
- Exhibits132: Data Table on Middle East and Africa - Year-over-year growth 2024-2029 (%)
- Exhibits133: Chart on China - Market size and forecast 2024-2029 ($ million)
- Exhibits134: Data Table on China - Market size and forecast 2024-2029 ($ million)
- Exhibits135: Chart on China - Year-over-year growth 2024-2029 (%)
- Exhibits136: Data Table on China - Year-over-year growth 2024-2029 (%)
- Exhibits137: Chart on US - Market size and forecast 2024-2029 ($ million)
- Exhibits138: Data Table on US - Market size and forecast 2024-2029 ($ million)
- Exhibits139: Chart on US - Year-over-year growth 2024-2029 (%)
- Exhibits140: Data Table on US - Year-over-year growth 2024-2029 (%)
- Exhibits141: Chart on Japan - Market size and forecast 2024-2029 ($ million)
- Exhibits142: Data Table on Japan - Market size and forecast 2024-2029 ($ million)
- Exhibits143: Chart on Japan - Year-over-year growth 2024-2029 (%)
- Exhibits144: Data Table on Japan - Year-over-year growth 2024-2029 (%)
- Exhibits145: Chart on Canada - Market size and forecast 2024-2029 ($ million)
- Exhibits146: Data Table on Canada - Market size and forecast 2024-2029 ($ million)
- Exhibits147: Chart on Canada - Year-over-year growth 2024-2029 (%)
- Exhibits148: Data Table on Canada - Year-over-year growth 2024-2029 (%)
- Exhibits149: Chart on South Korea - Market size and forecast 2024-2029 ($ million)
- Exhibits150: Data Table on South Korea - Market size and forecast 2024-2029 ($ million)
- Exhibits151: Chart on South Korea - Year-over-year growth 2024-2029 (%)
- Exhibits152: Data Table on South Korea - Year-over-year growth 2024-2029 (%)
- Exhibits153: Chart on Germany - Market size and forecast 2024-2029 ($ million)
- Exhibits154: Data Table on Germany - Market size and forecast 2024-2029 ($ million)
- Exhibits155: Chart on Germany - Year-over-year growth 2024-2029 (%)
- Exhibits156: Data Table on Germany - Year-over-year growth 2024-2029 (%)
- Exhibits157: Chart on France - Market size and forecast 2024-2029 ($ million)
- Exhibits158: Data Table on France - Market size and forecast 2024-2029 ($ million)
- Exhibits159: Chart on France - Year-over-year growth 2024-2029 (%)
- Exhibits160: Data Table on France - Year-over-year growth 2024-2029 (%)
- Exhibits161: Chart on India - Market size and forecast 2024-2029 ($ million)
- Exhibits162: Data Table on India - Market size and forecast 2024-2029 ($ million)
- Exhibits163: Chart on India - Year-over-year growth 2024-2029 (%)
- Exhibits164: Data Table on India - Year-over-year growth 2024-2029 (%)
- Exhibits165: Chart on UK - Market size and forecast 2024-2029 ($ million)
- Exhibits166: Data Table on UK - Market size and forecast 2024-2029 ($ million)
- Exhibits167: Chart on UK - Year-over-year growth 2024-2029 (%)
- Exhibits168: Data Table on UK - Year-over-year growth 2024-2029 (%)
- Exhibits169: Chart on Brazil - Market size and forecast 2024-2029 ($ million)
- Exhibits170: Data Table on Brazil - Market size and forecast 2024-2029 ($ million)
- Exhibits171: Chart on Brazil - Year-over-year growth 2024-2029 (%)
- Exhibits172: Data Table on Brazil - Year-over-year growth 2024-2029 (%)
- Exhibits173: Market opportunity By Geographical Landscape ($ million)
- Exhibits174: Data Tables on Market opportunity By Geographical Landscape ($ million)
- Exhibits175: Impact of drivers and challenges in 2024 and 2029
- Exhibits176: Overview on criticality of inputs and factors of differentiation
- Exhibits177: Overview on factors of disruption
- Exhibits178: Impact of key risks on business
- Exhibits179: Companies covered
- Exhibits180: Company ranking index
- Exhibits181: Matrix on companies position and classification
- Exhibits182: Fenghua HK Electronics Ltd - Overview
- Exhibits183: Fenghua HK Electronics Ltd - Product / Service
- Exhibits184: Fenghua HK Electronics Ltd - Key offerings
- Exhibits185: SWOT
- Exhibits186: Johanson Dielectrics Inc. - Overview
- Exhibits187: Johanson Dielectrics Inc. - Product / Service
- Exhibits188: Johanson Dielectrics Inc. - Key offerings
- Exhibits189: SWOT
- Exhibits190: KYOCERA Corp. - Overview
- Exhibits191: KYOCERA Corp. - Business segments
- Exhibits192: KYOCERA Corp. - Key news
- Exhibits193: KYOCERA Corp. - Key offerings
- Exhibits194: KYOCERA Corp. - Segment focus
- Exhibits195: SWOT
- Exhibits196: MARUWA CO. LTD. - Overview
- Exhibits197: MARUWA CO. LTD. - Product / Service
- Exhibits198: MARUWA CO. LTD. - Key offerings
- Exhibits199: SWOT
- Exhibits200: Murata Manufacturing Co. Ltd. - Overview
- Exhibits201: Murata Manufacturing Co. Ltd. - Business segments
- Exhibits202: Murata Manufacturing Co. Ltd. - Key news
- Exhibits203: Murata Manufacturing Co. Ltd. - Key offerings
- Exhibits204: Murata Manufacturing Co. Ltd. - Segment focus
- Exhibits205: SWOT
- Exhibits206: Nippon Chemi-Con Corp. - Overview
- Exhibits207: Nippon Chemi-Con Corp. - Product / Service
- Exhibits208: Nippon Chemi-Con Corp. - Key offerings
- Exhibits209: SWOT
- Exhibits210: Panasonic Holdings Corp. - Overview
- Exhibits211: Panasonic Holdings Corp. - Business segments
- Exhibits212: Panasonic Holdings Corp. - Key news
- Exhibits213: Panasonic Holdings Corp. - Key offerings
- Exhibits214: Panasonic Holdings Corp. - Segment focus
- Exhibits215: SWOT
- Exhibits216: Samsung Electro-Mechanics - Overview
- Exhibits217: Samsung Electro-Mechanics - Product / Service
- Exhibits218: Samsung Electro-Mechanics - Key offerings
- Exhibits219: SWOT
- Exhibits220: Samwha Electronics - Overview
- Exhibits221: Samwha Electronics - Product / Service
- Exhibits222: Samwha Electronics - Key offerings
- Exhibits223: SWOT
- Exhibits224: Shenzhen Eyang Technology Development Co. Ltd. - Overview
- Exhibits225: Shenzhen Eyang Technology Development Co. Ltd. - Product / Service
- Exhibits226: Shenzhen Eyang Technology Development Co. Ltd. - Key offerings
- Exhibits227: SWOT
- Exhibits228: TAIYO YUDEN Co. Ltd. - Overview
- Exhibits229: TAIYO YUDEN Co. Ltd. - Product / Service
- Exhibits230: TAIYO YUDEN Co. Ltd. - Key offerings
- Exhibits231: SWOT
- Exhibits232: TDK Corp. - Overview
- Exhibits233: TDK Corp. - Business segments
- Exhibits234: TDK Corp. - Key news
- Exhibits235: TDK Corp. - Key offerings
- Exhibits236: TDK Corp. - Segment focus
- Exhibits237: SWOT
- Exhibits238: Vishay Intertechnology Inc. - Overview
- Exhibits239: Vishay Intertechnology Inc. - Business segments
- Exhibits240: Vishay Intertechnology Inc. - Key news
- Exhibits241: Vishay Intertechnology Inc. - Key offerings
- Exhibits242: Vishay Intertechnology Inc. - Segment focus
- Exhibits243: SWOT
- Exhibits244: Walsin Technologies Corp. - Overview
- Exhibits245: Walsin Technologies Corp. - Product / Service
- Exhibits246: Walsin Technologies Corp. - Key offerings
- Exhibits247: SWOT
- Exhibits248: Yageo Corp. - Overview
- Exhibits249: Yageo Corp. - Business segments
- Exhibits250: Yageo Corp. - Key offerings
- Exhibits251: Yageo Corp. - Segment focus
- Exhibits252: SWOT
- Exhibits253: Inclusions checklist
- Exhibits254: Exclusions checklist
- Exhibits255: Currency conversion rates for US$
- Exhibits256: Research methodology
- Exhibits257: Information sources
- Exhibits258: Data validation
- Exhibits259: Validation techniques employed for market sizing
- Exhibits260: Data synthesis
- Exhibits261: 360 degree market analysis
- Exhibits262: List of abbreviations
The multi-layer ceramic capacitor market is forecasted to grow by USD 11,682.1 mn during 2024-2029, accelerating at a CAGR of 12.9% during the forecast period. The report on the multi-layer ceramic capacitor market provides a holistic analysis, market size and forecast, trends, growth drivers, and challenges, as well as vendor analysis covering around 25 vendors.
The report offers an up-to-date analysis regarding the current market scenario, the latest trends and drivers, and the overall market environment. The market is driven by proliferation of 5g technology and advanced telecommunications infrastructure, accelerating electrification and functional sophistication in automotive sector, and pervasive integration of internet of things and advancements in consumer electronics.
| Market Scope | |
|---|---|
| Base Year | 2025 |
| End Year | 2029 |
| Series Year | 2025-2029 |
| Growth Momentum | Accelerate |
| YOY 2025 | 11% |
| CAGR | 12.9% |
| Incremental Value | $11,682.1 mn |
The study was conducted using an objective combination of primary and secondary information including inputs from key participants in the industry. The report contains a comprehensive market size data, segment with regional analysis and vendor landscape in addition to an analysis of the key companies. Reports have historic and forecast data.
Technavio's multi-layer ceramic capacitor market is segmented as below:
By Application
- Consumer electronics
- Electric vehicles
- ADAS
- Navigation systems
- Others
By Type
- General capacitor
- Array
- Serial construction
- Mega cap
- Others
By Power Rating
- Low range
- Medium range
- High range
By Geographical Landscape
- APAC
- North America
- Europe
- South America
- Middle East and Africa
This study identifies the strategic portfolio pivot towards high reliability automotive and industrial applications as one of the prime reasons driving the multi-layer ceramic capacitor market growth during the next few years. Also, development of ultra-high capacitance and low esl solutions for advanced computing and growing adoption of alternative capacitor technologies in high capacitance applications will lead to sizable demand in the market.
The report on the multi-layer ceramic capacitor market covers the following areas:
- Multi-Layer Ceramic Capacitor Market sizing
- Multi-Layer Ceramic Capacitor Market forecast
- Multi-Layer Ceramic Capacitor Market industry analysis
The robust vendor analysis is designed to help clients improve their market position, and in line with this, this report provides a detailed analysis of several leading multi-layer ceramic capacitor market vendors that include Dalian Dalicap Technology Co. Ltd., Fenghua HK Electronics Ltd, Holy Stone Enterprise Co. Ltd., Johanson Dielectrics Inc., KYOCERA Corp., MARUWA CO. LTD., Murata Manufacturing Co. Ltd., NIC COMPONENTS CORP., Nippon Chemi-Con Corp., Panasonic Holdings Corp., Samsung Electro-Mechanics, Samwha Electronics, Shenzhen Eyang Technology Development Co. Ltd., TAIYO YUDEN Co. Ltd., TDK Corp., Vishay Intertechnology Inc., Walsin Technologies Corp., and Yageo Corp.. Also, the multi-layer ceramic capacitor market analysis report includes information on upcoming trends and challenges that will influence market growth. This is to help companies strategize and leverage all forthcoming growth opportunities.
The publisher presents a detailed picture of the market by the way of study, synthesis, and summation of data from multiple sources by an analysis of key parameters such as profit, pricing, competition, and promotions. It presents various market facets by identifying the key industry influencers. The data presented is comprehensive, reliable, and a result of extensive primary and secondary research. The market research reports provide a complete competitive landscape and an in-depth vendor selection methodology and analysis using qualitative and quantitative research to forecast accurate market growth.
Table of Contents
1 Executive Summary
- 1.1 Market overview
- Executive Summary - Chart on Market Overview
- Executive Summary - Data Table on Market Overview
- Executive Summary - Chart on Global Market Characteristics
- Executive Summary - Chart on Market By Geographical Landscape
- Executive Summary - Chart on Market Segmentation by Application
- Executive Summary - Chart on Market Segmentation by Type
- Executive Summary - Chart on Market Segmentation by Power Rating
- Executive Summary - Chart on Incremental Growth
- Executive Summary - Data Table on Incremental Growth
- Executive Summary - Chart on Company Market Positioning
2 Technavio Analysis
- 2.1 Analysis of price sensitivity, lifecycle, customer purchase basket, adoption rates, and purchase criteria
- Analysis of price sensitivity, lifecycle, customer purchase basket, adoption rates, and purchase criteria
- 2.2 Criticality of inputs and Factors of differentiation
- Overview on criticality of inputs and factors of differentiation
- 2.3 Factors of disruption
- Overview on factors of disruption
- 2.4 Impact of drivers and challenges
- Impact of drivers and challenges in 2024 and 2029
3 Market Landscape
- 3.1 Market ecosystem
- Parent Market
- Data Table on - Parent Market
- 3.2 Market characteristics
- Market characteristics analysis
- 3.3 Value chain analysis
- Value chain analysis
4 Market Sizing
- 4.1 Market definition
- Offerings of companies included in the market definition
- 4.2 Market segment analysis
- Market segments
- 4.3 Market size 2024
- 4.4 Market outlook: Forecast for 2024-2029
- Chart on Global - Market size and forecast 2024-2029 ($ million)
- Data Table on Global - Market size and forecast 2024-2029 ($ million)
- Chart on Global Market: Year-over-year growth 2024-2029 (%)
- Data Table on Global Market: Year-over-year growth 2024-2029 (%)
5 Historic Market Size
- 5.1 Global Multi-Layer Ceramic Capacitor Market 2019 - 2023
- Historic Market Size - Data Table on Global Multi-Layer Ceramic Capacitor Market 2019 - 2023 ($ million)
- 5.2 Application segment analysis 2019 - 2023
- Historic Market Size - Application Segment 2019 - 2023 ($ million)
- 5.3 Type segment analysis 2019 - 2023
- Historic Market Size - Type Segment 2019 - 2023 ($ million)
- 5.4 Power Rating segment analysis 2019 - 2023
- Historic Market Size - Power Rating Segment 2019 - 2023 ($ million)
- 5.5 Geography segment analysis 2019 - 2023
- Historic Market Size - Geography Segment 2019 - 2023 ($ million)
- 5.6 Country segment analysis 2019 - 2023
- Historic Market Size - Country Segment 2019 - 2023 ($ million)
6 Qualitative Analysis
- 6.1 The impact of AI in the?global multi-layer ceramic capacitor market
7 Five Forces Analysis
- 7.1 Five forces summary
- Five forces analysis - Comparison between 2024 and 2029
- 7.2 Bargaining power of buyers
- Bargaining power of buyers - Impact of key factors 2024 and 2029
- 7.3 Bargaining power of suppliers
- Bargaining power of suppliers - Impact of key factors in 2024 and 2029
- 7.4 Threat of new entrants
- Threat of new entrants - Impact of key factors in 2024 and 2029
- 7.5 Threat of substitutes
- Threat of substitutes - Impact of key factors in 2024 and 2029
- 7.6 Threat of rivalry
- Threat of rivalry - Impact of key factors in 2024 and 2029
- 7.7 Market condition
- Chart on Market condition - Five forces 2024 and 2029
8 Market Segmentation by Application
- 8.1 Market segments
- Chart on Application - Market share 2024-2029 (%)
- Data Table on Application - Market share 2024-2029 (%)
- 8.2 Comparison by Application
- Chart on Comparison by Application
- Data Table on Comparison by Application
- 8.3 Consumer electronics - Market size and forecast 2024-2029
- Chart on Consumer electronics - Market size and forecast 2024-2029 ($ million)
- Data Table on Consumer electronics - Market size and forecast 2024-2029 ($ million)
- Chart on Consumer electronics - Year-over-year growth 2024-2029 (%)
- Data Table on Consumer electronics - Year-over-year growth 2024-2029 (%)
- 8.4 Electric vehicles - Market size and forecast 2024-2029
- Chart on Electric vehicles - Market size and forecast 2024-2029 ($ million)
- Data Table on Electric vehicles - Market size and forecast 2024-2029 ($ million)
- Chart on Electric vehicles - Year-over-year growth 2024-2029 (%)
- Data Table on Electric vehicles - Year-over-year growth 2024-2029 (%)
- 8.5 ADAS - Market size and forecast 2024-2029
- Chart on ADAS - Market size and forecast 2024-2029 ($ million)
- Data Table on ADAS - Market size and forecast 2024-2029 ($ million)
- Chart on ADAS - Year-over-year growth 2024-2029 (%)
- Data Table on ADAS - Year-over-year growth 2024-2029 (%)
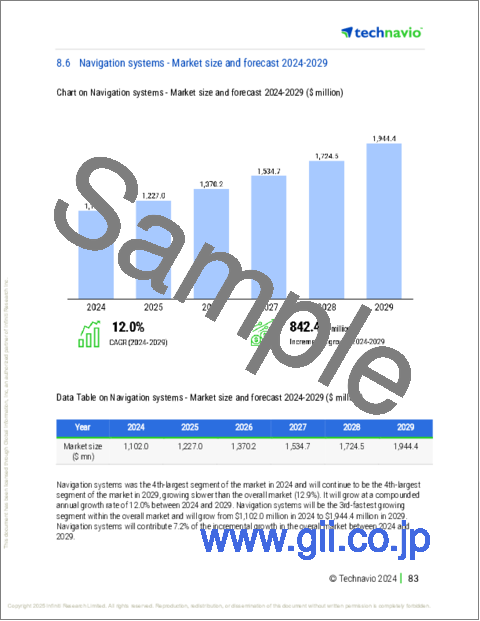
- 8.6 Navigation systems - Market size and forecast 2024-2029
- Chart on Navigation systems - Market size and forecast 2024-2029 ($ million)
- Data Table on Navigation systems - Market size and forecast 2024-2029 ($ million)
- Chart on Navigation systems - Year-over-year growth 2024-2029 (%)
- Data Table on Navigation systems - Year-over-year growth 2024-2029 (%)
- 8.7 Others - Market size and forecast 2024-2029
- Chart on Others - Market size and forecast 2024-2029 ($ million)
- Data Table on Others - Market size and forecast 2024-2029 ($ million)
- Chart on Others - Year-over-year growth 2024-2029 (%)
- Data Table on Others - Year-over-year growth 2024-2029 (%)
- 8.8 Market opportunity by Application
- Market opportunity by Application ($ million)
- Data Table on Market opportunity by Application ($ million)
9 Market Segmentation by Type
- 9.1 Market segments
- Chart on Type - Market share 2024-2029 (%)
- Data Table on Type - Market share 2024-2029 (%)
- 9.2 Comparison by Type
- Chart on Comparison by Type
- Data Table on Comparison by Type
- 9.3 General capacitor - Market size and forecast 2024-2029
- Chart on General capacitor - Market size and forecast 2024-2029 ($ million)
- Data Table on General capacitor - Market size and forecast 2024-2029 ($ million)
- Chart on General capacitor - Year-over-year growth 2024-2029 (%)
- Data Table on General capacitor - Year-over-year growth 2024-2029 (%)
- 9.4 Array - Market size and forecast 2024-2029
- Chart on Array - Market size and forecast 2024-2029 ($ million)
- Data Table on Array - Market size and forecast 2024-2029 ($ million)
- Chart on Array - Year-over-year growth 2024-2029 (%)
- Data Table on Array - Year-over-year growth 2024-2029 (%)
- 9.5 Serial construction - Market size and forecast 2024-2029
- Chart on Serial construction - Market size and forecast 2024-2029 ($ million)
- Data Table on Serial construction - Market size and forecast 2024-2029 ($ million)
- Chart on Serial construction - Year-over-year growth 2024-2029 (%)
- Data Table on Serial construction - Year-over-year growth 2024-2029 (%)
- 9.6 Mega cap - Market size and forecast 2024-2029
- Chart on Mega cap - Market size and forecast 2024-2029 ($ million)
- Data Table on Mega cap - Market size and forecast 2024-2029 ($ million)
- Chart on Mega cap - Year-over-year growth 2024-2029 (%)
- Data Table on Mega cap - Year-over-year growth 2024-2029 (%)
- 9.7 Others - Market size and forecast 2024-2029
- Chart on Others - Market size and forecast 2024-2029 ($ million)
- Data Table on Others - Market size and forecast 2024-2029 ($ million)
- Chart on Others - Year-over-year growth 2024-2029 (%)
- Data Table on Others - Year-over-year growth 2024-2029 (%)
- 9.8 Market opportunity by Type
- Market opportunity by Type ($ million)
- Data Table on Market opportunity by Type ($ million)
10 Market Segmentation by Power Rating
- 10.1 Market segments
- Chart on Power Rating - Market share 2024-2029 (%)
- Data Table on Power Rating - Market share 2024-2029 (%)
- 10.2 Comparison by Power Rating
- Chart on Comparison by Power Rating
- Data Table on Comparison by Power Rating
- 10.3 Low range - Market size and forecast 2024-2029
- Chart on Low range - Market size and forecast 2024-2029 ($ million)
- Data Table on Low range - Market size and forecast 2024-2029 ($ million)
- Chart on Low range - Year-over-year growth 2024-2029 (%)
- Data Table on Low range - Year-over-year growth 2024-2029 (%)
- 10.4 Medium range - Market size and forecast 2024-2029
- Chart on Medium range - Market size and forecast 2024-2029 ($ million)
- Data Table on Medium range - Market size and forecast 2024-2029 ($ million)
- Chart on Medium range - Year-over-year growth 2024-2029 (%)
- Data Table on Medium range - Year-over-year growth 2024-2029 (%)
- 10.5 High range - Market size and forecast 2024-2029
- Chart on High range - Market size and forecast 2024-2029 ($ million)
- Data Table on High range - Market size and forecast 2024-2029 ($ million)
- Chart on High range - Year-over-year growth 2024-2029 (%)
- Data Table on High range - Year-over-year growth 2024-2029 (%)
- 10.6 Market opportunity by Power Rating
- Market opportunity by Power Rating ($ million)
- Data Table on Market opportunity by Power Rating ($ million)
11 Customer Landscape
- 11.1 Customer landscape overview
- Analysis of price sensitivity, lifecycle, customer purchase basket, adoption rates, and purchase criteria
12 Geographic Landscape
- 12.1 Geographic segmentation
- Chart on Market share By Geographical Landscape 2024-2029 (%)
- Data Table on Market share By Geographical Landscape 2024-2029 (%)
- 12.2 Geographic comparison
- Chart on Geographic comparison
- Data Table on Geographic comparison
- 12.3 APAC - Market size and forecast 2024-2029
- Chart on APAC - Market size and forecast 2024-2029 ($ million)
- Data Table on APAC - Market size and forecast 2024-2029 ($ million)
- Chart on APAC - Year-over-year growth 2024-2029 (%)
- Data Table on APAC - Year-over-year growth 2024-2029 (%)
- 12.4 North America - Market size and forecast 2024-2029
- Chart on North America - Market size and forecast 2024-2029 ($ million)
- Data Table on North America - Market size and forecast 2024-2029 ($ million)
- Chart on North America - Year-over-year growth 2024-2029 (%)
- Data Table on North America - Year-over-year growth 2024-2029 (%)
- 12.5 Europe - Market size and forecast 2024-2029
- Chart on Europe - Market size and forecast 2024-2029 ($ million)
- Data Table on Europe - Market size and forecast 2024-2029 ($ million)
- Chart on Europe - Year-over-year growth 2024-2029 (%)
- Data Table on Europe - Year-over-year growth 2024-2029 (%)
- 12.6 South America - Market size and forecast 2024-2029
- Chart on South America - Market size and forecast 2024-2029 ($ million)
- Data Table on South America - Market size and forecast 2024-2029 ($ million)
- Chart on South America - Year-over-year growth 2024-2029 (%)
- Data Table on South America - Year-over-year growth 2024-2029 (%)
- 12.7 Middle East and Africa - Market size and forecast 2024-2029
- Chart on Middle East and Africa - Market size and forecast 2024-2029 ($ million)
- Data Table on Middle East and Africa - Market size and forecast 2024-2029 ($ million)
- Chart on Middle East and Africa - Year-over-year growth 2024-2029 (%)
- Data Table on Middle East and Africa - Year-over-year growth 2024-2029 (%)
- 12.8 China - Market size and forecast 2024-2029
- Chart on China - Market size and forecast 2024-2029 ($ million)
- Data Table on China - Market size and forecast 2024-2029 ($ million)
- Chart on China - Year-over-year growth 2024-2029 (%)
- Data Table on China - Year-over-year growth 2024-2029 (%)
- 12.9 US - Market size and forecast 2024-2029
- Chart on US - Market size and forecast 2024-2029 ($ million)
- Data Table on US - Market size and forecast 2024-2029 ($ million)
- Chart on US - Year-over-year growth 2024-2029 (%)
- Data Table on US - Year-over-year growth 2024-2029 (%)
- 12.10 Japan - Market size and forecast 2024-2029
- Chart on Japan - Market size and forecast 2024-2029 ($ million)
- Data Table on Japan - Market size and forecast 2024-2029 ($ million)
- Chart on Japan - Year-over-year growth 2024-2029 (%)
- Data Table on Japan - Year-over-year growth 2024-2029 (%)
- 12.11 Canada - Market size and forecast 2024-2029
- Chart on Canada - Market size and forecast 2024-2029 ($ million)
- Data Table on Canada - Market size and forecast 2024-2029 ($ million)
- Chart on Canada - Year-over-year growth 2024-2029 (%)
- Data Table on Canada - Year-over-year growth 2024-2029 (%)
- 12.12 South Korea - Market size and forecast 2024-2029
- Chart on South Korea - Market size and forecast 2024-2029 ($ million)
- Data Table on South Korea - Market size and forecast 2024-2029 ($ million)
- Chart on South Korea - Year-over-year growth 2024-2029 (%)
- Data Table on South Korea - Year-over-year growth 2024-2029 (%)
- 12.13 Germany - Market size and forecast 2024-2029
- Chart on Germany - Market size and forecast 2024-2029 ($ million)
- Data Table on Germany - Market size and forecast 2024-2029 ($ million)
- Chart on Germany - Year-over-year growth 2024-2029 (%)
- Data Table on Germany - Year-over-year growth 2024-2029 (%)
- 12.14 France - Market size and forecast 2024-2029
- Chart on France - Market size and forecast 2024-2029 ($ million)
- Data Table on France - Market size and forecast 2024-2029 ($ million)
- Chart on France - Year-over-year growth 2024-2029 (%)
- Data Table on France - Year-over-year growth 2024-2029 (%)
- 12.15 India - Market size and forecast 2024-2029
- Chart on India - Market size and forecast 2024-2029 ($ million)
- Data Table on India - Market size and forecast 2024-2029 ($ million)
- Chart on India - Year-over-year growth 2024-2029 (%)
- Data Table on India - Year-over-year growth 2024-2029 (%)
- 12.16 UK - Market size and forecast 2024-2029
- Chart on UK - Market size and forecast 2024-2029 ($ million)
- Data Table on UK - Market size and forecast 2024-2029 ($ million)
- Chart on UK - Year-over-year growth 2024-2029 (%)
- Data Table on UK - Year-over-year growth 2024-2029 (%)
- 12.17 Brazil - Market size and forecast 2024-2029
- Chart on Brazil - Market size and forecast 2024-2029 ($ million)
- Data Table on Brazil - Market size and forecast 2024-2029 ($ million)
- Chart on Brazil - Year-over-year growth 2024-2029 (%)
- Data Table on Brazil - Year-over-year growth 2024-2029 (%)
- 12.18 Market opportunity By Geographical Landscape
- Market opportunity By Geographical Landscape ($ million)
- Data Tables on Market opportunity By Geographical Landscape ($ million)
13 Drivers, Challenges, and Opportunity/Restraints
- 13.1 Market drivers
- 13.2 Market challenges
- 13.3 Impact of drivers and challenges
- Impact of drivers and challenges in 2024 and 2029
- 13.4 Market opportunities/restraints
14 Competitive Landscape
- 14.1 Overview
- 14.2 Competitive Landscape
- Overview on criticality of inputs and factors of differentiation
- 14.3 Landscape disruption
- Overview on factors of disruption
- 14.4 Industry risks
- Impact of key risks on business
15 Competitive Analysis
- 15.1 Companies profiled
- Companies covered
- 15.2 Company ranking index
- Company ranking index
- 15.3 Market positioning of companies
- Matrix on companies position and classification
- 15.4 Fenghua HK Electronics Ltd
- Fenghua HK Electronics Ltd - Overview
- Fenghua HK Electronics Ltd - Product / Service
- Fenghua HK Electronics Ltd - Key offerings
- SWOT
- 15.5 Johanson Dielectrics Inc.
- Johanson Dielectrics Inc. - Overview
- Johanson Dielectrics Inc. - Product / Service
- Johanson Dielectrics Inc. - Key offerings
- SWOT
- 15.6 KYOCERA Corp.
- KYOCERA Corp. - Overview
- KYOCERA Corp. - Business segments
- KYOCERA Corp. - Key news
- KYOCERA Corp. - Key offerings
- KYOCERA Corp. - Segment focus
- SWOT
- 15.7 MARUWA CO. LTD.
- MARUWA CO. LTD. - Overview
- MARUWA CO. LTD. - Product / Service
- MARUWA CO. LTD. - Key offerings
- SWOT
- 15.8 Murata Manufacturing Co. Ltd.
- Murata Manufacturing Co. Ltd. - Overview
- Murata Manufacturing Co. Ltd. - Business segments
- Murata Manufacturing Co. Ltd. - Key news
- Murata Manufacturing Co. Ltd. - Key offerings
- Murata Manufacturing Co. Ltd. - Segment focus
- SWOT
- 15.9 Nippon Chemi-Con Corp.
- Nippon Chemi-Con Corp. - Overview
- Nippon Chemi-Con Corp. - Product / Service
- Nippon Chemi-Con Corp. - Key offerings
- SWOT
- 15.10 Panasonic Holdings Corp.
- Panasonic Holdings Corp. - Overview
- Panasonic Holdings Corp. - Business segments
- Panasonic Holdings Corp. - Key news
- Panasonic Holdings Corp. - Key offerings
- Panasonic Holdings Corp. - Segment focus
- SWOT
- 15.11 Samsung Electro-Mechanics
- Samsung Electro-Mechanics - Overview
- Samsung Electro-Mechanics - Product / Service
- Samsung Electro-Mechanics - Key offerings
- SWOT
- 15.12 Samwha Electronics
- Samwha Electronics - Overview
- Samwha Electronics - Product / Service
- Samwha Electronics - Key offerings
- SWOT
- 15.13 Shenzhen Eyang Technology Development Co. Ltd.
- Shenzhen Eyang Technology Development Co. Ltd. - Overview
- Shenzhen Eyang Technology Development Co. Ltd. - Product / Service
- Shenzhen Eyang Technology Development Co. Ltd. - Key offerings
- SWOT
- 15.14 TAIYO YUDEN Co. Ltd.
- TAIYO YUDEN Co. Ltd. - Overview
- TAIYO YUDEN Co. Ltd. - Product / Service
- TAIYO YUDEN Co. Ltd. - Key offerings
- SWOT
- 15.15 TDK Corp.
- TDK Corp. - Overview
- TDK Corp. - Business segments
- TDK Corp. - Key news
- TDK Corp. - Key offerings
- TDK Corp. - Segment focus
- SWOT
- 15.16 Vishay Intertechnology Inc.
- Vishay Intertechnology Inc. - Overview
- Vishay Intertechnology Inc. - Business segments
- Vishay Intertechnology Inc. - Key news
- Vishay Intertechnology Inc. - Key offerings
- Vishay Intertechnology Inc. - Segment focus
- SWOT
- 15.17 Walsin Technologies Corp.
- Walsin Technologies Corp. - Overview
- Walsin Technologies Corp. - Product / Service
- Walsin Technologies Corp. - Key offerings
- SWOT
- 15.18 Yageo Corp.
- Yageo Corp. - Overview
- Yageo Corp. - Business segments
- Yageo Corp. - Key offerings
- Yageo Corp. - Segment focus
- SWOT
16 Appendix
- 16.1 Scope of the report
- 16.2 Inclusions and exclusions checklist
- Inclusions checklist
- Exclusions checklist
- 16.3 Currency conversion rates for US$
- Currency conversion rates for US$
- 16.4 Research methodology
- Research methodology
- 16.5 Data procurement
- Information sources
- 16.6 Data validation
- Data validation
- 16.7 Validation techniques employed for market sizing
- Validation techniques employed for market sizing
- 16.8 Data synthesis
- Data synthesis
- 16.9 360 degree market analysis
- 360 degree market analysis
- 16.10 List of abbreviations
- List of abbreviations
