|
|
市場調査レポート
商品コード
1405844
積層セラミックコンデンサの市場規模、シェア、動向分析レポート:タイプ別、定格電圧範囲別、ケースサイズ別、誘電体タイプ別、最終用途別、地域別、セグメント予測、2023年~2030年Multi-layer Ceramic Capacitor Market Size, Share & Trends Analysis Report By Type, By Rated Voltage Range, By Case Size, By Dielectric Type, By End-use, By Region, And Segment Forecasts, 2023 - 2030 |
||||||
|
|
|||||||
|
● お客様のご希望に応じて、既存データの加工や未掲載情報(例:国別セグメント)の追加などの対応が可能です。 詳細はお問い合わせください。 |
|||||||


| 積層セラミックコンデンサの市場規模、シェア、動向分析レポート:タイプ別、定格電圧範囲別、ケースサイズ別、誘電体タイプ別、最終用途別、地域別、セグメント予測、2023年~2030年 |
|
出版日: 2023年12月11日
発行: Grand View Research
ページ情報: 英文 145 Pages
納期: 2~10営業日
|
- 全表示
- 概要
- 図表
- 目次
積層セラミックコンデンサ市場の成長と動向:
Grand View Research, Inc.の最新レポートによると、世界の積層セラミックコンデンサの市場規模は、予測期間中にCAGR 5.6%を記録し、2030年までに167億7,000万米ドルに達すると予測されています。
これらのコンデンサの高抵抗と周波数の向上が需要を牽引すると見られています。
MLCCは面実装(SMD)タイプのコンデンサで、幅広い静電容量範囲で使用されています。MLCCは、エレクトロニクスや自動車など数多くの最終用途産業で幅広く使用されています。これらのコンデンサは、高い耐電圧、高い信頼性、優れた周波数などの特徴により、他のコンデンサよりも好まれています。さらに、MLCCはチューナーや携帯電話などの無線周波数(RF)アプリケーションで広く使用されています。
小型化、多機能アプリケーション、高周波アプリケーションとの融合といったエレクトロニクス産業における一般的な動向に対応するため、MLCC開発者は静電容量の面で先進的なMLCC品種の開発に注力しています。中国の多くのコンデンサメーカーは、加工要件を満たすために機械のアップグレードに投資しています。
MLCCメーカーは、超小型コンデンサ、大容量コンデンサ、低等価直列インダクタンス(ESL)コンデンサといったセラミックコンデンサの新品種を提供し、顧客の多様なニーズに応えることに注力しています。加えて、メーカー各社は、競争の激しい市場に耐えうる先進的なMLCCを開発するため、研究開発活動に多額の投資を行っています。
積層セラミックコンデンサ市場レポートハイライト
- タイプ別では、一般コンデンサセグメントが2022年に31.0%の最大収益シェアを占めました。
- 一般コンデンサは、電気回路からノイズを除去し、電荷を一時的に蓄えるという大きな利点があるため、いくつかの産業で広く使用されています。これらのコンデンサは、最も高い静電容量、優れたDCバイアス特性、高い信頼性のためのモノリシック構造を提供します。
- 予測期間中、エレクトロニクス最終用途セグメントがMLCC市場をリードすると予測されています。スマートフォン、テレビ、タブレット、デジタルスチルカメラ、コンピュータなどのコンシューマーエレクトロニクス製品の採用が増加しており、エレクトロニクス業界におけるMLCCの需要が加速すると予想されます。
- 誘電体タイプでは、Y5Vセグメントが予測期間中に6.2%のCAGRを記録すると予想されます。
- アジア太平洋地域は引き続き優位を保ち、予測期間中に最も急成長する地域となる見込みです。
- 中国、台湾、インドなどの新興諸国における開発イニシアティブと改良技術の採用は、エレクトロニクス、自動車、通信産業における生産活動を促進し、それによってMLCCの需要を増大させています。
目次
第1章 調査手法と範囲
第2章 エグゼクティブサマリー
第3章 積層セラミックコンデンサ(MLCC)の市場変数、動向および範囲
- 市場系統の見通し
- 業界のバリューチェーン分析
- 市場力学
- 市場促進要因分析
- 市場抑制要因分析
- 市場機会分析
- 積層セラミックコンデンサ(MLCC)市場分析ツール
- 業界分析-ポーターのファイブフォース分析
- PESTEL分析
第4章 積層セラミックコンデンサ(MLCC)市場:タイプの推定・動向分析
- 積層セラミックコンデンサ(MLCC)市場:重要なポイント
- 積層セラミックコンデンサ(MLCC)市場:動向と市場シェア分析、2022年・2030年
- 一般的なコンデンサ
- 一般的なコンデンサ市場推計・予測、2017年~2030年
- アレイ型
- アレイ型市場推計・予測、2017年~2030年
- 直列構造
- 直列構造市場推計・予測、2017年~2030年
- メガキャップ
- メガキャップ市場推計・予測、2017年~2030年
- その他
- その他の市場推計・予測、2017年~2030年
第5章 積層セラミックコンデンサ(MLCC)市場:定格電圧範囲の推定・動向分析
- 積層セラミックコンデンサ(MLCC)市場:重要なポイント
- 積層セラミックコンデンサ(MLCC)市場:動向と市場シェア分析、2022年・2030年
- 低域(最大50V)
- 低域
- 中域(100 V~630 V)
- 中域
- 高域(1000V以上)
- 高域
第6章 積層セラミックコンデンサ(MLCC)市場:ケースサイズの推定・動向分析
- 積層セラミックコンデンサ(MLCC)市場:重要なポイント
- 積層セラミックコンデンサ(MLCC)市場:動向と市場シェア分析、2022年・2030年
- 0603インチ未満
- 0603インチ未満の市場推計・予測、2017年~2030年
- 0603~1206インチ
- 0603~1206インチ市場推計・予測、2017年~2030年
- 1206インチ以上
- 1206インチ以上の市場推計・予測、2017年~2030年
第7章 積層セラミックコンデンサ(MLCC)市場:誘電体の種類の推定・動向分析
- 積層セラミックコンデンサ(MLCC)市場:重要なポイント
- 積層セラミックコンデンサ(MLCC)市場:動向と市場シェア分析、2022年・2030年
- X7R
- X7R市場推計・予測、2017年~2030年
- X5R
- X5R市場推計・予測、2017年~2030年
- C0G
- C0G市場推計・予測、2017年~2030年
- Y5V
- Y5V市場推計・予測、2017年~2030年
- その他
- その他の市場推計・予測、2017年~2030年
第8章 積層セラミックコンデンサ(MLCC)市場:最終用途の推定・動向分析
- 積層セラミックコンデンサ(MLCC)市場:重要なポイント
- 積層セラミックコンデンサ(MLCC)市場:動向と市場シェア分析、2022年・2030年
- エレクトロニクス
- エレクトロニクス市場推計・予測、2017年~2030年
- 自動車
- 自動車市場推計・予測、2017年~2030年
- 産業
- 産業市場推計・予測、2017年~2030年
- 通信
- 通信市場推計・予測、2017年~2030年
- データ送信
- データ送信市場推計・予測、2017年~2030年
- その他
- その他の市場推計・予測、2017年~2030年
第9章 積層セラミックコンデンサ(MLCC)市場:地域推定・動向分析
- 地域別の見通し
- 地域別積層セラミックコンデンサ(MLCC)市場:重要なポイント
- 北米
- 北米市場推計・予測、2017年~2030年
- 米国
- カナダ
- 欧州
- 欧州市場推計・予測、2017年~2030年
- 英国
- ドイツ
- フランス
- スペイン
- イタリア
- アジア太平洋地域
- アジア太平洋市場推計・予測、2017年~2030年
- 中国
- インド
- 日本
- オーストラリア
- 韓国
- ラテンアメリカ
- ラテンアメリカ市場推計・予測、2017年~2030年
- ブラジル
- メキシコ
- 中東・アフリカ
- 中東・アフリカ市場推計・予測、2017年~2030年
- アラブ首長国連邦(UAE)
- サウジアラビア
- 南アフリカ
第10章 競合情勢
- 主要市場参入企業による最近の動向と影響分析
- 市場参入企業の分類
- Murata Manufacturing Co., Ltd.
- TAIYO YUDEN CO., LTD.
- KYOCERA Corporation
- YAGEO Group
- Walsin Technology Corporation
- SAMSUNG ELECTRO-MECHANICS
- Future Electronics
- TDK Corporation
- Vishay Intertechnology, Inc.
List of Tables
- Table 1 List of abbreviations
- Table 2 North America MLCC market, by type, 2017 - 2030 (USD Million)
- Table 3 North America MLCC market, by rated voltage range, 2017 - 2030 (USD Million)
- Table 4 North America MLCC market, by case size, 2017 - 2030 (USD Million)
- Table 5 North America MLCC market, by dielectric type, 2017 - 2030 (USD Million)
- Table 6 North America MLCC market, by end-use, 2017 - 2030 (USD Million)
- Table 7 North America MLCC market, by region, (USD Million) 2017 to 2030
- Table 8 U.S. MLCC market, by type, 2017 - 2030 (USD Million)
- Table 9 U.S. MLCC market, by rated voltage range, 2017 - 2030 (USD Million)
- Table 10 U.S. MLCC market, by case size, 2017 - 2030 (USD Million)
- Table 11 U.S. MLCC market, by dielectric type, 2017 - 2030 (USD Million)
- Table 12 U.S. MLCC market, by end-use, 2017 - 2030 (USD Million)
- Table 13 Canada MLCC market, by type, 2017 - 2030 (USD Million)
- Table 14 Canada MLCC market, by rated voltage range, 2017 - 2030 (USD Million)
- Table 15 Canada MLCC market, by case size, 2017 - 2030 (USD Million)
- Table 16 Canada MLCC market, by dielectric type, 2017 - 2030 (USD Million)
- Table 17 Canada MLCC market, by type, 2017 - 2030 (USD Million)
- Table 18 Europe MLCC market, by end-use, 2017 - 2030 (USD Million)
- Table 19 Europe MLCC market, by rated voltage range, 2017 - 2030 (USD Million)
- Table 20 Europe MLCC market, by region, (USD Million) 2017 to 2030
- Table 21 Europe MLCC market, by case size, 2017 - 2030 (USD Million)
- Table 22 Europe MLCC market, by dielectric type, 2017 - 2030 (USD Million)
- Table 23 Europe MLCC market, by end-use, 2017 - 2030 (USD Million)
- Table 24 Germany MLCC market, by type, 2017 - 2030 (USD Million)
- Table 25 Germany MLCC market, by rated voltage range, 2017 - 2030 (USD Million)
- Table 26 Germany MLCC market, by case size, 2017 - 2030 (USD Million)
- Table 27 Germany MLCC market, by dielectric type, 2017 - 2030 (USD Million)
- Table 28 Germany MLCC market, by end-use, 2017 - 2030 (USD Million)
- Table 29 UK MLCC market, by type, 2017 - 2030 (USD Million)
- Table 30 UK MLCC market, by rated voltage range, 2017 - 2030 (USD Million)
- Table 31 UK MLCC market, by case size, 2017 - 2030 (USD Million)
- Table 32 UK MLCC market, by dielectric type, 2017 - 2030 (USD Million)
- Table 33 UK MLCC market, by end-use, 2017 - 2030 (USD Million)
- Table 34 France MLCC market, by type, 2017 - 2030 (USD Million)
- Table 35 France MLCC market, by rated voltage range, 2017 - 2030 (USD Million)
- Table 36 France MLCC market, by dielectric type, 2017 - 2030 (USD Million)
- Table 37 France MLCC market, by case size, 2017 - 2030 (USD Million)
- Table 38 France MLCC market, by end-use, 2017 - 2030 (USD Million)
- Table 39 Asia Pacific MLCC market, by type, 2017 - 2030 (USD Million)
- Table 40 Asia Pacific MLCC market, by rated voltage range, 2017 - 2030 (USD Million)
- Table 41 Asia Pacific MLCC market, by region, (USD Million) 2017 to 2030
- Table 42 Asia Pacific MLCC market, by case size, 2017 - 2030 (USD Million)
- Table 43 Asia Pacific MLCC market, by dielectric type, 2017 - 2030 (USD Million)
- Table 44 Asia Pacific MLCC market, by end-use, 2017 - 2030 (USD Million)
- Table 45 China MLCC market, by type, 2017 - 2030 (USD Million)
- Table 46 China MLCC market, by rated voltage range, 2017 - 2030 (USD Million)
- Table 47 China MLCC market, by case size, 2017 - 2030 (USD Million)
- Table 48 China MLCC market, by dielectric type, 2017 - 2030 (USD Million)
- Table 49 China MLCC market, by end-use, 2017 - 2030 (USD Million)
- Table 50 Japan MLCC market, by type, 2017 - 2030 (USD Million)
- Table 51 Japan MLCC market, by rated voltage range, 2017 - 2030 (USD Million)
- Table 52 Japan MLCC market, by case size, 2017 - 2030 (USD Million)
- Table 53 Japan MLCC market, by dielectric type, 2017 - 2030 (USD Million)
- Table 54 Japan MLCC market, by end-use, 2017 - 2030 (USD Million)
- Table 55 India MLCC market, by type, 2017 - 2030 (USD Million)
- Table 56 India MLCC market, by rated voltage range, 2017 - 2030 (USD Million)
- Table 57 India MLCC market, by case size, 2017 - 2030 (USD Million)
- Table 58 India MLCC market, by dielectric type, 2017 - 2030 (USD Million)
- Table 59 India MLCC market, by end-use, 2017 - 2030 (USD Million)
- Table 60 Australia MLCC market, by type, 2017 - 2030 (USD Million)
- Table 61 Australia MLCC market, by rated voltage range, 2017 - 2030 (USD Million)
- Table 62 Australia MLCC market, by case size, 2017 - 2030 (USD Million)
- Table 63 Australia MLCC market, by dielectric type, 2017 - 2030 (USD Million)
- Table 64 Australia MLCC market, by end-use, 2017 - 2030 (USD Million)
- Table 65 South Korea MLCC market, by type, 2017 - 2030 (USD Million)
- Table 66 South Korea MLCC market, by rated voltage range, 2017 - 2030 (USD Million)
- Table 67 South Korea MLCC market, by case size, 2017 - 2030 (USD Million)
- Table 68 South Korea MLCC market, by dielectric type, 2017 - 2030 (USD Million)
- Table 69 South Korea MLCC market, by end-use, 2017 - 2030 (USD Million)
- Table 70 Latin America MLCC market, by type, 2017 - 2030 (USD Million)
- Table 71 Latin America MLCC market, by rated voltage range, 2017 - 2030 (USD Million)
- Table 72 Latin America MLCC market, by case size, 2017 - 2030 (USD Million)
- Table 73 Latin America MLCC market, by dielectric type, 2017 - 2030 (USD Million)
- Table 74 Latin America MLCC market, by end-use, 2017 - 2030 (USD Million)
- Table 75 Latin America MLCC market, by region, (USD Million) 2017 to 2030
- Table 76 Brazil MLCC market, by type, 2017 - 2030 (USD Million)
- Table 77 Brazil MLCC market, by rated voltage range, 2017 - 2030 (USD Million)
- Table 78 Brazil MLCC market, by case size, 2017 - 2030 (USD Million)
- Table 79 Brazil MLCC market, by dielectric type, 2017 - 2030 (USD Million)
- Table 80 Brazil MLCC market, by end-use, 2017 - 2030 (USD Million)
- Table 81 Mexico MLCC market, by type, 2017 - 2030 (USD Million)
- Table 82 Mexico MLCC market, by rated voltage range, 2017 - 2030 (USD Million)
- Table 83 Mexico MLCC market, by case size, 2017 - 2030 (USD Million)
- Table 84 Mexico MLCC market, by dielectric type, 2017 - 2030 (USD Million)
- Table 85 Mexico MLCC market, by end-use, 2017 - 2030 (USD Million)
- Table 86 Middle East and Africa MLCC market, by type, 2017 - 2030 (USD Million)
- Table 87 Middle East and Africa MLCC market, by rated voltage range, 2017 - 2030 (USD Million)
- Table 88 Middle East and Africa MLCC market, by case size, 2017 - 2030 (USD Million)
- Table 89 Middle East and Africa MLCC market, by dielectric type, 2017 - 2030 (USD Million)
- Table 90 Middle East and Africa MLCC market, by end-use, 2017 - 2030 (USD Million)
- Table 91 Middle East and Africa MLCC market, by region, (USD Million) 2017 to 2030
- Table 92 UAE MLCC market, by type, 2017 - 2030 (USD Million)
- Table 93 UAE MLCC market, by rated voltage range, 2017 - 2030 (USD Million)
- Table 94 UAE MLCC market, by case size, 2017 - 2030 (USD Million)
- Table 95 UAE MLCC market, by dielectric type, 2017 - 2030 (USD Million)
- Table 96 UAE MLCC market, by end-use, 2017 - 2030 (USD Million)
- Table 97 Saudi Arabia MLCC market, by type, 2017 - 2030 (USD Million)
- Table 98 Saudi Arabia MLCC market, by rated voltage range, 2017 - 2030 (USD Million)
- Table 99 Saudi Arabia MLCC market, by case size, 2017 - 2030 (USD Million)
- Table 100 Saudi Arabia MLCC market, by dielectric type, 2017 - 2030 (USD Million)
- Table 101 Saudi Arabia MLCC market, by end-use, 2017 - 2030 (USD Million)
- Table 102 South Africa MLCC market, by type, 2017 - 2030 (USD Million)
- Table 103 South Africa MLCC market, by rated voltage range, 2017 - 2030 (USD Million)
- Table 104 South Africa MLCC market, by case size, 2017 - 2030 (USD Million)
- Table 105 South Africa MLCC market, by dielectric type, 2017 - 2030 (USD Million)
- Table 106 South Africa MLCC market, by end-use, 2017 - 2030 (USD Million)
List of Figures
- Fig. 1 Market research process
- Fig. 2 Data triangulation techniques
- Fig. 3 Primary research pattern
- Fig. 4 Market research approaches
- Fig. 5 Value-chain-based sizing & forecasting
- Fig. 6 QFD modeling for market share assessment
- Fig. 7 Market formulation & validation
- Fig. 8 MLCC: Market outlook
- Fig. 9 MLCC: Competitive insights
- Fig. 10 Parent market outlook
- Fig. 11 Related/ancillary market outlook
- Fig. 12 Penetration and growth prospect mapping
- Fig. 13 Industry value chain analysis
- Fig. 14 MLCC market driver impact
- Fig. 15 MLCC market restraint impact
- Fig. 16 MLCC market strategic initiatives analysis
- Fig. 17 MLCC market: Type movement analysis
- Fig. 18 MLCC market: Type outlook and key takeaways
- Fig. 19 General capacitor market estimates and forecasts, 2017 - 2030
- Fig. 20 Array market estimates and forecasts, 2017 - 2030
- Fig. 21 Serial construction market estimates and forecasts, 2017 - 2030
- Fig. 22 Mega cap market estimates and forecasts, 2017 - 2030
- Fig. 23 Others market estimates and forecasts, 2017 - 2030
- Fig. 24 MLCC market: Rated voltage range movement analysis
- Fig. 25 MLCC market: Rated voltage range outlook and key takeaways
- Fig. 26 Low range (Up to 50 V) market estimates and forecasts, 2017 - 2030
- Fig. 27 Mid-range (100 V - 630 V) estimates and forecasts, 2017 - 2030
- Fig. 28 High-range (1000 V & above) estimates and forecasts, 2017 - 2030
- Fig. 29 MLCC market: Case size movement analysis
- Fig. 30 MLCC market: Case size outlook and key takeaways
- Fig. 31 Less than 0603 inches market estimates and forecasts, 2017 - 2030
- Fig. 32 0603-1206 inches market estimates and forecasts, 2017 - 2030
- Fig. 33 More than 1206 inches market estimates and forecasts, 2017 - 2030
- Fig. 34 MLCC market: Dielectric type movement analysis
- Fig. 35 MLCC market: Dielectric type outlook and key takeaways
- Fig. 36 X7R market estimates and forecasts, 2017 - 2030
- Fig. 37 X5R market estimates and forecasts, 2017 - 2030
- Fig. 38 C0G market estimates and forecasts, 2017 - 2030
- Fig. 39 Y5V market estimates and forecasts, 2017 - 2030
- Fig. 40 Others market estimates and forecasts, 2017 - 2030
- Fig. 41 MLCC market: End-use movement analysis
- Fig. 42 MLCC market: End-use outlook and key takeaways
- Fig. 43 Electronics market estimates and forecasts, 2017 - 2030
- Fig. 44 Automotive market estimates and forecasts, 2017 - 2030
- Fig. 45 Industrial market estimates and forecasts, 2017 - 2030
- Fig. 46 Telecommunication market estimates and forecasts, 2017 - 2030
- Fig. 47 Data transmission market estimates and forecasts, 2017 - 2030
- Fig. 48 Others market estimates and forecasts, 2017 - 2030
- Fig. 49 Global MLCC market: Regional movement analysis
- Fig. 50 Global MLCC market: Regional outlook and key takeaways
- Fig. 51 North America market estimates and forecasts, 2017 - 2030
- Fig. 52 U.S. market estimates and forecasts, 2017 - 2030
- Fig. 53 Canada market estimates and forecasts, 2017 - 2030
- Fig. 54 Europe market estimates and forecasts, 2017 - 2030
- Fig. 55 UK market estimates and forecasts, 2017 - 2030
- Fig. 56 Germany market estimates and forecasts, 2017 - 2030
- Fig. 57 France market estimates and forecasts, 2017 - 2030
- Fig. 58 Spain market estimates and forecasts, 2017 - 2030
- Fig. 59 Italy market estimates and forecasts, 2017 - 2030
- Fig. 60 Asia Pacific market estimates and forecasts, 2017 - 2030
- Fig. 61 China market estimates and forecasts, 2017 - 2030
- Fig. 62 India market estimates and forecasts, 2017 - 2030
- Fig. 63 Japan market estimates and forecasts, 2017 - 2030
- Fig. 64 Australia market estimates and forecasts, 2017 - 2030
- Fig. 65 South Korea market estimates and forecasts, 2017 - 2030
- Fig. 66 Latin America market estimates and forecasts, 2017 - 2030
- Fig. 67 Brazil market estimates and forecasts, 2017 - 2030
- Fig. 68 Mexico market estimates and forecasts, 2017 - 2030
- Fig. 69 Middle East and Africa market estimates and forecasts, 2017 - 2030
- Fig. 70 United Arab Emirates market estimates and forecasts, 2017 - 2030
- Fig. 71 Middle East and Africa market estimates and forecasts, 2017 - 2030
- Fig. 72 Middle East and Africa market estimates and forecasts, 2017 - 2030
Multi-layer Ceramic Capacitor Market Growth & Trends:
The global multi-layer ceramic capacitor market size is expected to reach USD 16.77 billion by 2030, registering a CAGR of 5.6% during the forecast period, according to a new report by Grand View Research, Inc. High resistance and enhanced frequency of these capacitors are expected to drive the demand.
MLCCs are Surface Mounted Device (SMD) type capacitors used in wide ranges of capacitance. MLCCs are extensively used in numerous end-use industries such as electronics and automotive. These capacitors are preferred over other capacitors owing to features such as higher withstanding voltage, higher reliability, and better frequency. Furthermore, MLCCs are widely used in Radio Frequency (RF) applications such as tuner and cellular phones.
With the view of accommodating popular trends in the electronics industry, such as miniaturization, multi-functional applications, and convergence with high frequency applications, MLCC developers are focusing on the development of advanced MLCC varieties in terms of capacitance. Numerous Chinese capacitor manufacturers are investing in machinery upgrade to meet the processing requirements.
MLCC manufacturers are focusing on offering new varieties of ceramic capacitors such as ultra-small capacitors, high volume capacitors, and low Equivalent Series Inductance (ESL) capacitors to meet the varying needs of customers. In addition, manufacturers are heavily investing in R&D activities to develop advanced MLCCs that can withstand the highly competitive market.
Multi-layer Ceramic Capacitor Market Report Highlights:
- In terms of type, the general capacitor segment accounted for the largest revenue share of 31.0% in 2022.
- General capacitors are widely used in several industries owing to their vast benefits in removing noise from the electric circuit and storing electric charge temporarily. These capacitors offer the highest capacitance, excellent DC-bias characteristics, and monolithic structure for high reliability
- Electronics end use segment is projected to lead the MLCC market over the forecast period. Increasing adoption of consumer electronics products such as smartphones, televisions, tablets, digital still cameras, and computers is expected to accelerate the demand for MLCCs in the electronics industry
- In terms of dielectric type, the Y5V segment is expected to register the highest CAGR of 6.2% over the forecast period
- Asia Pacific is expected to continue its dominance and is expected to emerge as the fastest-growing region over the forecast period
- Development initiatives and adoption of improved technologies in developing countries such as China, Taiwan, and India are driving production activities in electronics, automotive, and telecommunications industries, thereby creating more demand for MLCCs.
Table of Contents
Chapter 1. Methodology and Scope
- 1.1. Market Segmentation & Scope
- 1.1.1. Type
- 1.1.2. Rated voltage range
- 1.1.3. Case size
- 1.1.4. Dielectric type
- 1.1.5. End-use
- 1.1.6. Regional scope
- 1.1.7. Estimates and forecast timeline
- 1.2. Research Methodology
- 1.3. Information Procurement
- 1.3.1. Purchased database
- 1.3.2. GVR's internal database
- 1.3.3. Secondary sources
- 1.3.4. Primary research
- 1.3.5. Details of primary research
- 1.4. Information or Data Analysis
- 1.5. Market Formulation & Validation
- 1.6. Model Details
- 1.7. List of Secondary Sources
- 1.8. List of Primary Sources
- 1.9. Objectives
Chapter 2. Executive Summary
- 2.1. Market Outlook
- 2.2. Segment Outlook
- 2.2.1. Type outlook
- 2.2.2. Rated voltage range outlook
- 2.2.3. Case size outlook
- 2.2.4. Dielectric type outlook
- 2.2.5. End-use outlook
- 2.2.6. Regional outlook
- 2.3. Competitive Insights
Chapter 3. Multi-Layer Ceramic Capacitor (MLCC) Market Variables, Trends & Scope
- 3.1. Market Lineage Outlook
- 3.2. Industry Value Chain Analysis
- 3.3. Market Dynamics
- 3.3.1. Market driver analysis
- 3.3.2. Market restraint analysis
- 3.3.3. Market opportunity analysis
- 3.4. Multi-Layer Ceramic Capacitor (MLCC) Market Analysis Tools
- 3.4.1. Industry analysis - Porter's Five Forces
- 3.4.1.1. Supplier power
- 3.4.1.2. Buyer power
- 3.4.1.3. Substitution threat
- 3.4.1.4. Threat of new entrant
- 3.4.1.5. Competitive rivalry
- 3.4.2. PESTEL analysis
- 3.4.2.1. Political landscape
- 3.4.2.2. Technological landscape
- 3.4.2.3. Economic landscape
- 3.4.1. Industry analysis - Porter's Five Forces
Chapter 4. Multi-Layer Ceramic Capacitor (MLCC) Market: Type Estimates & Trend Analysis
- 4.1. Multi-Layer Ceramic Capacitor (MLCC) Market: Key Takeaways
- 4.2. Multi-Layer Ceramic Capacitor (MLCC) Market: Movement & Market Share Analysis, 2022 & 2030
- 4.3. General Capacitor
- 4.3.1. General capacitor market estimates and forecasts, 2017 to 2030 (USD Million)
- 4.4. Array
- 4.4.1. Array market estimates and forecasts, 2017 to 2030 (USD Million)
- 4.5. Serial Construction
- 4.5.1. Serial construction market estimates and forecasts, 2017 to 2030 (USD Million)
- 4.6. Mega Cap
- 4.6.1. Mega cap market estimates and forecasts, 2017 to 2030 (USD Million)
- 4.7. Others
- 4.7.1. Others market estimates and forecasts, 2017 to 2030 (USD Million)
Chapter 5. Multi-Layer Ceramic Capacitor (MLCC) Market: Rated Voltage Range Estimates & Trend Analysis
- 5.1. Multi-Layer Ceramic Capacitor (MLCC) Market: Key Takeaways
- 5.2. Multi-Layer Ceramic Capacitor (MLCC) Market: Movement & Market Share Analysis, 2022 & 2030
- 5.3. Low Range (Up to 50 V)
- 5.3.1. Low range (Up to 50 V) market estimates and forecasts, 2017 to 2030 (USD Million)
- 5.4. Mid-Range (100 V - 630 V)
- 5.4.1. Mid-range (100 V - 630 V) market estimates and forecasts, 2017 to 2030 (USD Million)
- 5.5. High Range (1000 V & above)
- 5.5.1. High range (1000 V & above) market estimates and forecasts, 2017 to 2030 (USD Million)
Chapter 6. Multi-Layer Ceramic Capacitor (MLCC) Market: Case Size Estimates & Trend Analysis
- 6.1. Multi-Layer Ceramic Capacitor (MLCC) Market: Key Takeaways
- 6.2. Multi-Layer Ceramic Capacitor (MLCC) Market: Movement & Market Share Analysis, 2022 & 2030
- 6.3. Less Than 0603 Inches
- 6.3.1. Less than 0603 inches market estimates and forecasts, 2017 to 2030 (USD Million)
- 6.4. 0603-1206 Inches
- 6.4.1. 0603-1206 inches market estimates and forecasts, 2017 to 2030 (USD Million)
- 6.5. More than 1206 Inches
- 6.5.1. More than 1206 inches market estimates and forecasts, 2017 to 2030 (USD Million)
Chapter 7. Multi-Layer Ceramic Capacitor (MLCC) Market: Dielectric Type Estimates & Trend Analysis
- 7.1. Multi-Layer Ceramic Capacitor (MLCC) Market: Key Takeaways
- 7.2. Multi-Layer Ceramic Capacitor (MLCC) Market: Movement & Market Share Analysis, 2022 & 2030
- 7.3. X7R
- 7.3.1. X7R market estimates and forecasts, 2017 to 2030 (USD Million)
- 7.4. X5R
- 7.4.1. X5R market estimates and forecasts, 2017 to 2030 (USD Million)
- 7.5. C0G
- 7.5.1. C0G market estimates and forecasts, 2017 to 2030 (USD Million)
- 7.6. Y5V
- 7.6.1. Y5V market estimates and forecasts, 2017 to 2030 (USD Million)
- 7.7. Others
- 7.7.1. Others market estimates and forecasts, 2017 to 2030 (USD Million)
Chapter 8. Multi-Layer Ceramic Capacitor (MLCC) Market: End-Use Estimates & Trend Analysis
- 8.1. Multi-Layer Ceramic Capacitor (MLCC) Market: Key Takeaways
- 8.2. Multi-Layer Ceramic Capacitor (MLCC) Market: Movement & Market Share Analysis, 2022 & 2030
- 8.3. Electronics
- 8.3.1. Electronics market estimates and forecasts, 2017 to 2030 (USD Million)
- 8.4. Automotive
- 8.4.1. Automotive market estimates and forecasts, 2017 to 2030 (USD Million)
- 8.5. Industrial
- 8.5.1. Industrial market estimates and forecasts, 2017 to 2030 (USD Million)
- 8.6. Telecommunication
- 8.6.1. Telecommunication market estimates and forecasts, 2017 to 2030 (USD Million)
- 8.7. Data Transmission
- 8.7.1. Data transmission market estimates and forecasts, 2017 to 2030 (USD Million)
- 8.8. Others
- 8.8.1. Others market estimates and forecasts, 2017 to 2030 (USD Million)
Chapter 9. Multi-Layer Ceramic Capacitor (MLCC) Market: Regional Estimates & Trend Analysis
- 9.1. Regional Outlook
- 9.2. Multi-Layer Ceramic Capacitor (MLCC) Market by Region: Key Takeaway
- 9.3. North America
- 9.3.1. North America market estimates and forecasts, 2017 to 2030 (Revenue, USD Million)
- 9.3.2. U.S.
- 9.3.2.1. U.S. market estimates and forecasts, 2017 to 2030 (Revenue, USD Million)
- 9.3.3. Canada
- 9.3.3.1. Canada market estimates and forecasts, 2017 to 2030 (Revenue, USD Million)
- 9.4. Europe
- 9.4.1. Europe market estimates and forecasts, 2017 to 2030 (Revenue, USD Million)
- 9.4.2. UK
- 9.4.2.1. UK market estimates and forecasts, 2017 to 2030 (Revenue, USD Million)
- 9.4.3. Germany
- 9.4.3.1. Germany market estimates and forecasts, 2017 to 2030 (Revenue, USD Million)
- 9.4.4. France
- 9.4.4.1. France market estimates and forecasts, 2017 to 2030 (Revenue, USD Million)
- 9.4.5. Spain
- 9.4.5.1. Spain market estimates and forecasts, 2017 to 2030 (Revenue, USD Million)
- 9.4.6. Italy
- 9.4.6.1. Italy market estimates and forecasts, 2017 to 2030 (Revenue, USD Million)
- 9.5. Asia Pacific
- 9.5.1. Asia Pacific market estimates and forecasts, 2017 to 2030 (Revenue, USD Million)
- 9.5.2. China
- 9.5.2.1. China market estimates and forecasts, 2017 to 2030 (Revenue, USD Million)
- 9.5.3. India
- 9.5.3.1. India market estimates and forecasts, 2017 to 2030 (Revenue, USD Million)
- 9.5.4. Japan
- 9.5.4.1. Japan market estimates and forecasts, 2017 to 2030 (Revenue, USD Million)
- 9.5.5. Australia
- 9.5.5.1. Australia market estimates and forecasts, 2017 to 2030 (Revenue, USD Million)
- 9.5.6. South Korea
- 9.5.6.1. South Korea market estimates and forecasts, 2017 to 2030 (Revenue, USD Million)
- 9.6. Latin America
- 9.6.1. Latin America market estimates and forecasts, 2017 to 2030 (Revenue, USD Million)
- 9.6.2. Brazil
- 9.6.2.1. Brazil market estimates and forecasts, 2017 to 2030 (Revenue, USD Million)
- 9.6.3. Mexico
- 9.6.3.1. Mexico market estimates and forecasts, 2017 to 2030 (Revenue, USD Million)
- 9.7. MEA
- 9.7.1. MEA market estimates and forecasts, 2017 to 2030 (Revenue, USD Million)
- 9.7.2. United Aram Emirates (UAE)
- 9.7.2.1. United Aram Emirates (UAE) market estimates and forecasts, 2017 to 2030 (Revenue, USD Million)
- 9.7.3. Saudi Arabia
- 9.7.3.1. Saudi Arabia market estimates and forecasts, 2017 to 2030 (Revenue, USD Million)
- 9.7.4. South Africa
- 9.7.4.1. South Africa market estimates and forecasts, 2017 to 2030 (Revenue, USD Million)
Chapter 10. Competitive Landscape
- 10.1. Recent Developments & Impact Analysis, By Key Market Participants
- 10.2. Market Participant Categorization
- 10.2.1. Murata Manufacturing Co., Ltd.
- 10.2.1.1. Company overview
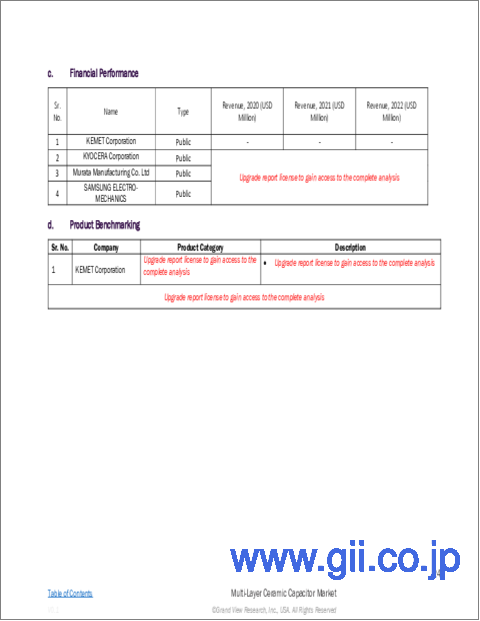
- 10.2.1.2. Financial performance
- 10.2.1.3. Product benchmarking
- 10.2.1.4. Strategic initiatives
- 10.2.2. TAIYO YUDEN CO., LTD.
- 10.2.2.1. Company overview
- 10.2.2.2. Financial performance
- 10.2.2.3. Product benchmarking
- 10.2.2.4. Strategic initiatives
- 10.2.3. KYOCERA Corporation
- 10.2.3.1. Company overview
- 10.2.3.2. Financial performance
- 10.2.3.3. Product benchmarking
- 10.2.3.4. Strategic initiatives
- 10.2.4. YAGEO Group
- 10.2.4.1. Company overview
- 10.2.4.2. Financial performance
- 10.2.4.3. Product benchmarking
- 10.2.4.4. Strategic initiatives
- 10.2.5. Walsin Technology Corporation
- 10.2.5.1. Company overview
- 10.2.5.2. Financial performance
- 10.2.5.3. Product benchmarking
- 10.2.5.4. Strategic initiatives
- 10.2.6. SAMSUNG ELECTRO-MECHANICS
- 10.2.6.1. Company overview
- 10.2.6.2. Financial performance
- 10.2.6.3. Product benchmarking
- 10.2.6.4. Strategic initiatives
- 10.2.7. Future Electronics
- 10.2.7.1. Company overview
- 10.2.7.2. Financial performance
- 10.2.7.3. Product benchmarking
- 10.2.7.4. Strategic initiatives
- 10.2.8. TDK Corporation
- 10.2.8.1. Company overview
- 10.2.8.2. Financial performance
- 10.2.8.3. Product benchmarking
- 10.2.8.4. Strategic initiatives
- 10.2.9. Vishay Intertechnology, Inc.
- 10.2.9.1. Company overview
- 10.2.9.2. Financial performance
- 10.2.9.3. Product benchmarking
- 10.2.9.4. Strategic initiatives
- 10.2.1. Murata Manufacturing Co., Ltd.