
|
市場調査レポート
商品コード
1641726
RTE(Ready-to-Eat)スープの世界市場:製品タイプ別、形態別、包装タイプ別、用途別、流通チャネル別 - 機会分析と産業予測(2024年~2034年)Ready-to-Eat Soup Market By Product Type , By Form By Packaging Type By Application By Distribution Channel : Global Opportunity Analysis and Industry Forecast, 2024-2034 |
||||||
|
|||||||

| RTE(Ready-to-Eat)スープの世界市場:製品タイプ別、形態別、包装タイプ別、用途別、流通チャネル別 - 機会分析と産業予測(2024年~2034年) |
|
出版日: 2024年11月01日
発行: Allied Market Research
ページ情報: 英文 285 Pages
納期: 2~3営業日
|

- 全表示
- 概要
- 目次
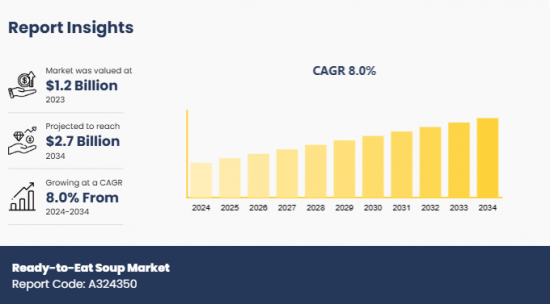
RTE(Ready-to-Eat)スープ市場は2023年に12億米ドルと評価され、2024年から2034年にかけてCAGR 8%で成長し、2034年には27億米ドルに達すると予測されています。
RTEスープとは、消費前に最小限の準備しか必要としない、あるいは準備不要の包装済みスープ製品のことです。これらのスープは缶入り、パウチ入り、カートン入りのものがあり、消費者が少ない労力で温かい食事を楽しめるよう利便性を重視して設計されています。調理済みであることが多く、電子レンジやコンロで温めるだけで済む場合もあります。
RTEスープ市場の成長は、多忙なライフスタイル、女性の社会進出の増加、外出先での食事に対する消費者の嗜好の高まりなどの要因により、力強い成長を目の当たりにしています。加えて、健康的な食事に対する意識の高まりが、健康志向の消費者ニーズの高まりに対応するため、ビタミン、ミネラル、植物性タンパク質を含む強化スープの開発をメーカーに促しています。Expo Westで発表された2023年の調査では、消費者の82%が植物性製品を毎月使用していることが明らかになりました。さらに、55%が過去2年間で摂取量を増やし、63%が今後2年間でさらに使用する予定です。さらに、核家族化や単身世帯の増加により、すぐに食べられる食事への依存度が高まっており、市場の成長を後押ししています。さらに、eコマースプラットフォームの拡大により、RTEスープが世界中の消費者にとってより身近なものとなり、市場成長に大きく寄与しています。持続可能な原料調達方法を採用している企業は、ブランドの信頼とロイヤルティを高めており、これがさらに世界市場の主要な推進力となっています。例えば、2023年のATLAS調査では、消費者の44%が製品を選択する際に成分表示と栄養表示の両方を確認する頻度が増えたと回答しており、これは2020年の35%から増加しています。しかし、新鮮な材料からスープを作るよりも、RTEスープの方がコストが高いため、コスト意識の高い消費者が手に入れやすい価格には限界があります。さらに、保存料が含まれ、ナトリウム含量が高く、新鮮な食材を使用していないため、RTEスープは栄養価が低く、市場成長の大きな妨げとなっています。逆に、電子レンジで温められるパウチ、イージーオープン缶、持続可能なパッケージングといった技術革新は、消費者の使い勝手を向上させ、環境意識の高い購買層にアピールします。このような発展は、予測期間中の世界市場拡大に新たな道を開くと期待されます。
世界のRTEスープ市場は、製品タイプ、形態、包装タイプ、用途、流通チャネル、地域に区分されます。製品タイプによって、市場はトマトのRTEスープ、豆のRTEスープ、チキンのRTEスープ、ビーフのRTEスープ、ミックス野菜のRTEスープ、その他に分類されます。形態別では、ドライスープとウェットスープに分けられます。包装タイプ別では、ボトル、缶、パックに分類されます。用途別では、HoReCa、住宅、その他に分けられます。流通チャネル別では、スーパーマーケット/ハイパーマーケット、コンビニエンスストア、オンライン販売チャネル、その他に細分化されます。地域別では、市場は北米、欧州、アジア太平洋、ラテンアメリカ・中東・アフリカで分析されます。
主な調査結果
製品タイプ別では、トマトのRTEスープ分野が2023年に最も高い市場シェアを占めました。
形態別では、ウェットスープセグメントが2023年の主要セグメントでした。
包装タイプ別では、缶セグメントが2023年に最大シェアを獲得しました。
用途別では、住宅用セグメントが2023年にシェアで市場を独占しました。
流通チャネル別では、スーパーマーケット/ハイパーマーケットセグメントが2023年に最も高いシェアを獲得しました。
地域別では、北米が2023年の主要収益源でした。
本レポートで可能なカスタマイズ
- 規制ガイドライン
- 顧客の関心に応じた企業プロファイルの追加
- 国別または地域別の追加分析 - 市場規模と予測
- ブランドシェア分析
- クリスクロスセグメント分析 - 市場規模と予測
- 企業プロファイルの拡張リスト
- 主要企業の詳細(所在地、連絡先、サプライヤー/ベンダーネットワークなどを含む、エクセル形式)
- 顧客/消費者/原料サプライヤーのリスト - バリューチェーン分析
- 世界/地域/国別レベルでの企業の市場シェア分析
- SWOT分析
目次
第1章 イントロダクション
第2章 エグゼクティブサマリー
第3章 市場情勢
- 市場の定義と範囲
- 主な調査結果
- 主な投資機会
- 主要成功戦略
- ポーターのファイブフォース分析
- 市場力学
- 促進要因
- 抑制要因
- 機会
第4章 RTEスープ市場:製品タイプ別
- 市場概要
- トマトのRTEスープ
- 豆のRTEスープ
- チキンのRTEスープ
- ビーフのRTEスープ
- ミックス野菜のRTEスープ
- その他
第5章 RTEスープ市場:形態別
- 市場概要
- ドライスープ
- ウェットスープ
第6章 RTEスープ市場:包装タイプ別
- 市場概要
- ボトル
- 缶
- パウチ
第7章 RTEスープ市場:用途別
- 市場概要
- HoReCa
- 住宅
- その他
第8章 RTEスープ市場:流通チャネル別
- 市場概要
- スーパーマーケット/ハイパーマーケット
- コンビニエンスストア
- オンライン販売チャネル
- その他
第9章 RTEスープ市場:地域別
- 市場概要
- 北米
- 主要市場動向と機会
- 米国
- カナダ
- メキシコ
- 欧州
- 主要市場動向と機会
- フランス
- ドイツ
- イタリア
- スペイン
- 英国
- ロシア
- その他欧州
- アジア太平洋
- 主要市場動向と機会
- 中国
- 日本
- インド
- 韓国
- オーストラリア
- タイ
- マレーシア
- インドネシア
- その他アジア太平洋
- ラテンアメリカ・中東・アフリカ
- 主要市場動向と機会
- ブラジル
- 南アフリカ
- サウジアラビア
- UAE
- アルゼンチン
- その他のラテンアメリカ・中東・アフリカ
第10章 競合情勢
- イントロダクション
- 主要成功戦略
- 主要企業の製品マッピング
- 競合ダッシュボード
- 競合ヒートマップ
- 主要企業のポジショニング(2023年)
第11章 企業プロファイル
- Campbell Soup Company
- General Mills Inc.
- Amy's Kitchen, Inc
- Nestle S.A.
- Pacific Foods
- Baxters Food Group Limited.
- Conagra Brands, Inc.
- The Kraft Heinz Company
- Hindustan Unilever Limited
- Kettle And Fire
The ready-to-eat soup market was valued at $1.2 billion in 2023, and is projected to reach $2.7 billion by 2034, growing at a CAGR of 8% from 2024 to 2034.
Ready-to-eat soup refers to pre-packaged soup products that require minimal or no preparation before consumption. These soups are available in cans, pouches, or cartons and are designed for convenience, allowing consumers to enjoy a hot meal with little effort. They are often pre-cooked and may only need heating in a microwave or on a stovetop.
The growth of the ready-to-eat soup market is witnessing robust growth due to factors such as busy lifestyles, increase in participation of women in the workforce, and rise in consumer preferences for on-the-go food. In addition, rise in awareness of healthy eating has encouraged manufacturers to develop fortified soups containing vitamins, minerals, and plant-based proteins to cater to the growing needs of health-conscious consumers. A 2023 study launched at Expo West revealed that 82% of consumers use plant-based products monthly. Additionally, 55% increased their intake over the past two years, and 63% plan to use more in the next two years. Moreover, shift towards nuclear families and single-person households has increased reliance on ready-to-eat meals, thus boosting the market growth. Furthermore, expansion of e-commerce platforms has made ready-to-eat soups more accessible to consumers globally, which significantly contributes toward the market growth. Companies adopting sustainable ingredient sourcing practices enhance brand trust and loyalty, which further acts as a key driving force of the global market. For instance, in the 2023 ATLAS study, 44% of consumers reported checking both ingredient and nutrition labels more frequently when selecting products, an increase from 35% in 2020. However, higher cost associated with ready-to-eat soups than preparing soup from fresh ingredients limit their affordability for cost-conscious consumers. Moreover, presence of preservatives, high sodium content, and lack of fresh ingredients in ready-to-eat soups make them less nutritious, which significantly hampers the market growth. On the contrary, innovations like microwaveable pouches, easy-open cans, and sustainable packaging improve consumer experience and appeal to eco-conscious buyers. Such developments are expected to open new avenues for the expansion of the global market during the forecast period.
The global ready-to-eat soup market is segmented into product type, form, packaging type, application, distribution channel, and region. Depending on product type, the market is classified into tomato ready-to-eat soup, beans ready-to-eat soup, chicken ready-to-eat soup, beef ready-to-eat soup, mixed vegetables ready-to-eat , and others. On the basis of form, it is bifurcated into dry soup and wet soup. BY packaging type, it is categorized into bottles, cans, and packets. As per application, it is divided into HoReCa, residential, and others. By distribution channel, it is fragmented into supermarkets/hypermarkets, convenience stores, online sales channel, and others. Region wise, the market is analyzed across North America, Europe, Asia-Pacific, and LAMEA.
Key Findings
Depending on product type, the tomato ready-to-eat soup segment held the highest market share in 2023.
On the basis of form, the wet soup segment was the major shareholder in 2023.
By packaging type, the cans segment acquired the largest share in 2023.
As per application, the residential segment dominated the market, in terms of share, in 2023.
By distribution channel, the supermarkets/hypermarkets segment garnered the highest share in 2023.
Region wise, North America was the major revenue generator in 2023.
Competition Analysis
The major players operating in the global ready-to-eat soup market include Campbell Soup Company, General Mills Inc., Amy's Kitchen, Inc, Nestle S.A., Pacific Foods, Baxters Food Group Limited., Conagra Brands, Inc., The Kraft Heinz Company, Hindustan Unilever Limited, and Kettle & Fire. These major players have adopted various key development strategies such as business expansion, new product launches, and partnerships to sustain the intense competition and gain a strong foothold in the global market.
Additional benefits you will get with this purchase are:
- Quarterly Update and* (only available with a corporate license, on listed price)
- 5 additional Company Profile of client Choice pre- or Post-purchase, as a free update.
- Free Upcoming Version on the Purchase of Five and Enterprise User License.
- 16 analyst hours of support* (post-purchase, if you find additional data requirements upon review of the report, you may receive support amounting to 16 analyst hours to solve questions, and post-sale queries)
- 15% Free Customization* (in case the scope or segment of the report does not match your requirements, 15% is equivalent to 3 working days of free work, applicable once)
- Free data Pack on the Five and Enterprise User License. (Excel version of the report)
- Free Updated report if the report is 6-12 months old or older.
- 24-hour priority response*
- Free Industry updates and white papers.
Possible Customization with this report (with additional cost and timeline, please talk to the sales executive to know more)
- Regulatory Guidelines
- Additional company profiles with specific to client's interest
- Additional country or region analysis- market size and forecast
- Brands Share Analysis
- Criss-cross segment analysis- market size and forecast
- Expanded list for Company Profiles
- Key player details (including location, contact details, supplier/vendor network etc. in excel format)
- List of customers/consumers/raw material suppliers- value chain analysis
- Market share analysis of players at global/region/country level
- SWOT Analysis
Key Market Segments
By Product Type
- Tomato Ready to Eat Soup
- Beans Ready to Eat Soup
- Chicken Ready to Eat Soup
- Beef Ready to Eat Soup
- Mixed Vegetables Ready to Eat Soup
- Others
By Form
- Dry Soup
- Wet Soup
By Packaging Type
- Bottles
- Cans
- Packets
By Application
- HoReCa
- Residential
- Others
By Distribution Channel
- Supermarkets/Hypermarkets
- Convenience Stores
- Online Sales Channel
- Others
By Region
- North America
- U.S.
- Canada
- Mexico
- Europe
- France
- Germany
- Italy
- Spain
- UK
- Russia
- Rest of Europe
- Asia-Pacific
- China
- Japan
- India
- South Korea
- Australia
- Thailand
- Malaysia
- Indonesia
- Rest of Asia-Pacific
- LAMEA
- Brazil
- South Africa
- Saudi Arabia
- UAE
- Argentina
- Rest of LAMEA
Key Market Players:
- Campbell Soup Company
- General Mills Inc.
- Amy's Kitchen, Inc
- Nestle S.A.
- Pacific Foods
- Baxters Food Group Limited.
- Conagra Brands, Inc.
- The Kraft Heinz Company
- Hindustan Unilever Limited
- Kettle & Fire
TABLE OF CONTENTS
CHAPTER 1: INTRODUCTION
- 1.1. Report Description
- 1.2. Key Market Segments
- 1.3. Key Benefits
- 1.4. Research Methodology
- 1.4.1. Primary Research
- 1.4.2. Secondary Research
- 1.4.3. Analyst Tools and Models
CHAPTER 2: EXECUTIVE SUMMARY
- 2.1. CXO Perspective
CHAPTER 3: MARKET LANDSCAPE
- 3.1. Market Definition and Scope
- 3.2. Key Findings
- 3.2.1. Top Investment Pockets
- 3.2.2. Top Winning Strategies
- 3.3. Porter's Five Forces Analysis
- 3.3.1. Bargaining Power of Suppliers
- 3.3.2. Threat of New Entrants
- 3.3.3. Threat of Substitutes
- 3.3.4. Competitive Rivalry
- 3.3.5. Bargaining Power among Buyers
- 3.4. Market Dynamics
- 3.4.1. Drivers
- 3.4.2. Restraints
- 3.4.3. Opportunities
CHAPTER 4: READY-TO-EAT SOUP MARKET, BY PRODUCT TYPE
- 4.1. Market Overview
- 4.1.1 Market Size and Forecast, By Product Type
- 4.2. Tomato Ready To Eat Soup
- 4.2.1. Key Market Trends, Growth Factors and Opportunities
- 4.2.2. Market Size and Forecast, By Region
- 4.2.3. Market Share Analysis, By Country
- 4.3. Beans Ready To Eat Soup
- 4.3.1. Key Market Trends, Growth Factors and Opportunities
- 4.3.2. Market Size and Forecast, By Region
- 4.3.3. Market Share Analysis, By Country
- 4.4. Chicken Ready To Eat Soup
- 4.4.1. Key Market Trends, Growth Factors and Opportunities
- 4.4.2. Market Size and Forecast, By Region
- 4.4.3. Market Share Analysis, By Country
- 4.5. Beef Ready To Eat Soup
- 4.5.1. Key Market Trends, Growth Factors and Opportunities
- 4.5.2. Market Size and Forecast, By Region
- 4.5.3. Market Share Analysis, By Country
- 4.6. Mixed Vegetables Ready To Eat Soup
- 4.6.1. Key Market Trends, Growth Factors and Opportunities
- 4.6.2. Market Size and Forecast, By Region
- 4.6.3. Market Share Analysis, By Country
- 4.7. Others
- 4.7.1. Key Market Trends, Growth Factors and Opportunities
- 4.7.2. Market Size and Forecast, By Region
- 4.7.3. Market Share Analysis, By Country
CHAPTER 5: READY-TO-EAT SOUP MARKET, BY FORM
- 5.1. Market Overview
- 5.1.1 Market Size and Forecast, By Form
- 5.2. Dry Soup
- 5.2.1. Key Market Trends, Growth Factors and Opportunities
- 5.2.2. Market Size and Forecast, By Region
- 5.2.3. Market Share Analysis, By Country
- 5.3. Wet Soup
- 5.3.1. Key Market Trends, Growth Factors and Opportunities
- 5.3.2. Market Size and Forecast, By Region
- 5.3.3. Market Share Analysis, By Country
CHAPTER 6: READY-TO-EAT SOUP MARKET, BY PACKAGING TYPE
- 6.1. Market Overview
- 6.1.1 Market Size and Forecast, By Packaging Type
- 6.2. Bottles
- 6.2.1. Key Market Trends, Growth Factors and Opportunities
- 6.2.2. Market Size and Forecast, By Region
- 6.2.3. Market Share Analysis, By Country
- 6.3. Cans
- 6.3.1. Key Market Trends, Growth Factors and Opportunities
- 6.3.2. Market Size and Forecast, By Region
- 6.3.3. Market Share Analysis, By Country
- 6.4. Packets
- 6.4.1. Key Market Trends, Growth Factors and Opportunities
- 6.4.2. Market Size and Forecast, By Region
- 6.4.3. Market Share Analysis, By Country
CHAPTER 7: READY-TO-EAT SOUP MARKET, BY APPLICATION
- 7.1. Market Overview
- 7.1.1 Market Size and Forecast, By Application
- 7.2. HoReCa
- 7.2.1. Key Market Trends, Growth Factors and Opportunities
- 7.2.2. Market Size and Forecast, By Region
- 7.2.3. Market Share Analysis, By Country
- 7.3. Residential
- 7.3.1. Key Market Trends, Growth Factors and Opportunities
- 7.3.2. Market Size and Forecast, By Region
- 7.3.3. Market Share Analysis, By Country
- 7.4. Others
- 7.4.1. Key Market Trends, Growth Factors and Opportunities
- 7.4.2. Market Size and Forecast, By Region
- 7.4.3. Market Share Analysis, By Country
CHAPTER 8: READY-TO-EAT SOUP MARKET, BY DISTRIBUTION CHANNEL
- 8.1. Market Overview
- 8.1.1 Market Size and Forecast, By Distribution Channel
- 8.2. Supermarkets/Hypermarkets
- 8.2.1. Key Market Trends, Growth Factors and Opportunities
- 8.2.2. Market Size and Forecast, By Region
- 8.2.3. Market Share Analysis, By Country
- 8.3. Convenience Stores
- 8.3.1. Key Market Trends, Growth Factors and Opportunities
- 8.3.2. Market Size and Forecast, By Region
- 8.3.3. Market Share Analysis, By Country
- 8.4. Online Sales Channel
- 8.4.1. Key Market Trends, Growth Factors and Opportunities
- 8.4.2. Market Size and Forecast, By Region
- 8.4.3. Market Share Analysis, By Country
- 8.5. Others
- 8.5.1. Key Market Trends, Growth Factors and Opportunities
- 8.5.2. Market Size and Forecast, By Region
- 8.5.3. Market Share Analysis, By Country
CHAPTER 9: READY-TO-EAT SOUP MARKET, BY REGION
- 9.1. Market Overview
- 9.1.1 Market Size and Forecast, By Region
- 9.2. North America
- 9.2.1. Key Market Trends and Opportunities
- 9.2.2. Market Size and Forecast, By Product Type
- 9.2.3. Market Size and Forecast, By Form
- 9.2.4. Market Size and Forecast, By Packaging Type
- 9.2.5. Market Size and Forecast, By Application
- 9.2.6. Market Size and Forecast, By Distribution Channel
- 9.2.7. Market Size and Forecast, By Country
- 9.2.8. U.S. Ready-to-Eat Soup Market
- 9.2.8.1. Market Size and Forecast, By Product Type
- 9.2.8.2. Market Size and Forecast, By Form
- 9.2.8.3. Market Size and Forecast, By Packaging Type
- 9.2.8.4. Market Size and Forecast, By Application
- 9.2.8.5. Market Size and Forecast, By Distribution Channel
- 9.2.9. Canada Ready-to-Eat Soup Market
- 9.2.9.1. Market Size and Forecast, By Product Type
- 9.2.9.2. Market Size and Forecast, By Form
- 9.2.9.3. Market Size and Forecast, By Packaging Type
- 9.2.9.4. Market Size and Forecast, By Application
- 9.2.9.5. Market Size and Forecast, By Distribution Channel
- 9.2.10. Mexico Ready-to-Eat Soup Market
- 9.2.10.1. Market Size and Forecast, By Product Type
- 9.2.10.2. Market Size and Forecast, By Form
- 9.2.10.3. Market Size and Forecast, By Packaging Type
- 9.2.10.4. Market Size and Forecast, By Application
- 9.2.10.5. Market Size and Forecast, By Distribution Channel
- 9.3. Europe
- 9.3.1. Key Market Trends and Opportunities
- 9.3.2. Market Size and Forecast, By Product Type
- 9.3.3. Market Size and Forecast, By Form
- 9.3.4. Market Size and Forecast, By Packaging Type
- 9.3.5. Market Size and Forecast, By Application
- 9.3.6. Market Size and Forecast, By Distribution Channel
- 9.3.7. Market Size and Forecast, By Country
- 9.3.8. France Ready-to-Eat Soup Market
- 9.3.8.1. Market Size and Forecast, By Product Type
- 9.3.8.2. Market Size and Forecast, By Form
- 9.3.8.3. Market Size and Forecast, By Packaging Type
- 9.3.8.4. Market Size and Forecast, By Application
- 9.3.8.5. Market Size and Forecast, By Distribution Channel
- 9.3.9. Germany Ready-to-Eat Soup Market
- 9.3.9.1. Market Size and Forecast, By Product Type
- 9.3.9.2. Market Size and Forecast, By Form
- 9.3.9.3. Market Size and Forecast, By Packaging Type
- 9.3.9.4. Market Size and Forecast, By Application
- 9.3.9.5. Market Size and Forecast, By Distribution Channel
- 9.3.10. Italy Ready-to-Eat Soup Market
- 9.3.10.1. Market Size and Forecast, By Product Type
- 9.3.10.2. Market Size and Forecast, By Form
- 9.3.10.3. Market Size and Forecast, By Packaging Type
- 9.3.10.4. Market Size and Forecast, By Application
- 9.3.10.5. Market Size and Forecast, By Distribution Channel
- 9.3.11. Spain Ready-to-Eat Soup Market
- 9.3.11.1. Market Size and Forecast, By Product Type
- 9.3.11.2. Market Size and Forecast, By Form
- 9.3.11.3. Market Size and Forecast, By Packaging Type
- 9.3.11.4. Market Size and Forecast, By Application
- 9.3.11.5. Market Size and Forecast, By Distribution Channel
- 9.3.12. UK Ready-to-Eat Soup Market
- 9.3.12.1. Market Size and Forecast, By Product Type
- 9.3.12.2. Market Size and Forecast, By Form
- 9.3.12.3. Market Size and Forecast, By Packaging Type
- 9.3.12.4. Market Size and Forecast, By Application
- 9.3.12.5. Market Size and Forecast, By Distribution Channel
- 9.3.13. Russia Ready-to-Eat Soup Market
- 9.3.13.1. Market Size and Forecast, By Product Type
- 9.3.13.2. Market Size and Forecast, By Form
- 9.3.13.3. Market Size and Forecast, By Packaging Type
- 9.3.13.4. Market Size and Forecast, By Application
- 9.3.13.5. Market Size and Forecast, By Distribution Channel
- 9.3.14. Rest Of Europe Ready-to-Eat Soup Market
- 9.3.14.1. Market Size and Forecast, By Product Type
- 9.3.14.2. Market Size and Forecast, By Form
- 9.3.14.3. Market Size and Forecast, By Packaging Type
- 9.3.14.4. Market Size and Forecast, By Application
- 9.3.14.5. Market Size and Forecast, By Distribution Channel
- 9.4. Asia-Pacific
- 9.4.1. Key Market Trends and Opportunities
- 9.4.2. Market Size and Forecast, By Product Type
- 9.4.3. Market Size and Forecast, By Form
- 9.4.4. Market Size and Forecast, By Packaging Type
- 9.4.5. Market Size and Forecast, By Application
- 9.4.6. Market Size and Forecast, By Distribution Channel
- 9.4.7. Market Size and Forecast, By Country
- 9.4.8. China Ready-to-Eat Soup Market
- 9.4.8.1. Market Size and Forecast, By Product Type
- 9.4.8.2. Market Size and Forecast, By Form
- 9.4.8.3. Market Size and Forecast, By Packaging Type
- 9.4.8.4. Market Size and Forecast, By Application
- 9.4.8.5. Market Size and Forecast, By Distribution Channel
- 9.4.9. Japan Ready-to-Eat Soup Market
- 9.4.9.1. Market Size and Forecast, By Product Type
- 9.4.9.2. Market Size and Forecast, By Form
- 9.4.9.3. Market Size and Forecast, By Packaging Type
- 9.4.9.4. Market Size and Forecast, By Application
- 9.4.9.5. Market Size and Forecast, By Distribution Channel
- 9.4.10. India Ready-to-Eat Soup Market
- 9.4.10.1. Market Size and Forecast, By Product Type
- 9.4.10.2. Market Size and Forecast, By Form
- 9.4.10.3. Market Size and Forecast, By Packaging Type
- 9.4.10.4. Market Size and Forecast, By Application
- 9.4.10.5. Market Size and Forecast, By Distribution Channel
- 9.4.11. South Korea Ready-to-Eat Soup Market
- 9.4.11.1. Market Size and Forecast, By Product Type
- 9.4.11.2. Market Size and Forecast, By Form
- 9.4.11.3. Market Size and Forecast, By Packaging Type
- 9.4.11.4. Market Size and Forecast, By Application
- 9.4.11.5. Market Size and Forecast, By Distribution Channel
- 9.4.12. Australia Ready-to-Eat Soup Market
- 9.4.12.1. Market Size and Forecast, By Product Type
- 9.4.12.2. Market Size and Forecast, By Form
- 9.4.12.3. Market Size and Forecast, By Packaging Type
- 9.4.12.4. Market Size and Forecast, By Application
- 9.4.12.5. Market Size and Forecast, By Distribution Channel
- 9.4.13. Thailand Ready-to-Eat Soup Market
- 9.4.13.1. Market Size and Forecast, By Product Type
- 9.4.13.2. Market Size and Forecast, By Form
- 9.4.13.3. Market Size and Forecast, By Packaging Type
- 9.4.13.4. Market Size and Forecast, By Application
- 9.4.13.5. Market Size and Forecast, By Distribution Channel
- 9.4.14. Malaysia Ready-to-Eat Soup Market
- 9.4.14.1. Market Size and Forecast, By Product Type
- 9.4.14.2. Market Size and Forecast, By Form
- 9.4.14.3. Market Size and Forecast, By Packaging Type
- 9.4.14.4. Market Size and Forecast, By Application
- 9.4.14.5. Market Size and Forecast, By Distribution Channel
- 9.4.15. Indonesia Ready-to-Eat Soup Market
- 9.4.15.1. Market Size and Forecast, By Product Type
- 9.4.15.2. Market Size and Forecast, By Form
- 9.4.15.3. Market Size and Forecast, By Packaging Type
- 9.4.15.4. Market Size and Forecast, By Application
- 9.4.15.5. Market Size and Forecast, By Distribution Channel
- 9.4.16. Rest of Asia-Pacific Ready-to-Eat Soup Market
- 9.4.16.1. Market Size and Forecast, By Product Type
- 9.4.16.2. Market Size and Forecast, By Form
- 9.4.16.3. Market Size and Forecast, By Packaging Type
- 9.4.16.4. Market Size and Forecast, By Application
- 9.4.16.5. Market Size and Forecast, By Distribution Channel
- 9.5. LAMEA
- 9.5.1. Key Market Trends and Opportunities
- 9.5.2. Market Size and Forecast, By Product Type
- 9.5.3. Market Size and Forecast, By Form
- 9.5.4. Market Size and Forecast, By Packaging Type
- 9.5.5. Market Size and Forecast, By Application
- 9.5.6. Market Size and Forecast, By Distribution Channel
- 9.5.7. Market Size and Forecast, By Country
- 9.5.8. Brazil Ready-to-Eat Soup Market
- 9.5.8.1. Market Size and Forecast, By Product Type
- 9.5.8.2. Market Size and Forecast, By Form
- 9.5.8.3. Market Size and Forecast, By Packaging Type
- 9.5.8.4. Market Size and Forecast, By Application
- 9.5.8.5. Market Size and Forecast, By Distribution Channel
- 9.5.9. South Africa Ready-to-Eat Soup Market
- 9.5.9.1. Market Size and Forecast, By Product Type
- 9.5.9.2. Market Size and Forecast, By Form
- 9.5.9.3. Market Size and Forecast, By Packaging Type
- 9.5.9.4. Market Size and Forecast, By Application
- 9.5.9.5. Market Size and Forecast, By Distribution Channel
- 9.5.10. Saudi Arabia Ready-to-Eat Soup Market
- 9.5.10.1. Market Size and Forecast, By Product Type
- 9.5.10.2. Market Size and Forecast, By Form
- 9.5.10.3. Market Size and Forecast, By Packaging Type
- 9.5.10.4. Market Size and Forecast, By Application
- 9.5.10.5. Market Size and Forecast, By Distribution Channel
- 9.5.11. UAE Ready-to-Eat Soup Market
- 9.5.11.1. Market Size and Forecast, By Product Type
- 9.5.11.2. Market Size and Forecast, By Form
- 9.5.11.3. Market Size and Forecast, By Packaging Type
- 9.5.11.4. Market Size and Forecast, By Application
- 9.5.11.5. Market Size and Forecast, By Distribution Channel
- 9.5.12. Argentina Ready-to-Eat Soup Market
- 9.5.12.1. Market Size and Forecast, By Product Type
- 9.5.12.2. Market Size and Forecast, By Form
- 9.5.12.3. Market Size and Forecast, By Packaging Type
- 9.5.12.4. Market Size and Forecast, By Application
- 9.5.12.5. Market Size and Forecast, By Distribution Channel
- 9.5.13. Rest of LAMEA Ready-to-Eat Soup Market
- 9.5.13.1. Market Size and Forecast, By Product Type
- 9.5.13.2. Market Size and Forecast, By Form
- 9.5.13.3. Market Size and Forecast, By Packaging Type
- 9.5.13.4. Market Size and Forecast, By Application
- 9.5.13.5. Market Size and Forecast, By Distribution Channel
CHAPTER 10: COMPETITIVE LANDSCAPE
- 10.1. Introduction
- 10.2. Top Winning Strategies
- 10.3. Product Mapping Of Top 10 Player
- 10.4. Competitive Dashboard
- 10.5. Competitive Heatmap
- 10.6. Top Player Positioning, 2023
CHAPTER 11: COMPANY PROFILES
- 11.1. Campbell Soup Company
- 11.1.1. Company Overview
- 11.1.2. Key Executives
- 11.1.3. Company Snapshot
- 11.1.4. Operating Business Segments
- 11.1.5. Product Portfolio
- 11.1.6. Business Performance
- 11.1.7. Key Strategic Moves and Developments
- 11.2. General Mills Inc.
- 11.2.1. Company Overview
- 11.2.2. Key Executives
- 11.2.3. Company Snapshot
- 11.2.4. Operating Business Segments
- 11.2.5. Product Portfolio
- 11.2.6. Business Performance
- 11.2.7. Key Strategic Moves and Developments
- 11.3. Amy's Kitchen, Inc
- 11.3.1. Company Overview
- 11.3.2. Key Executives
- 11.3.3. Company Snapshot
- 11.3.4. Operating Business Segments
- 11.3.5. Product Portfolio
- 11.3.6. Business Performance
- 11.3.7. Key Strategic Moves and Developments
- 11.4. Nestle S.A.
- 11.4.1. Company Overview
- 11.4.2. Key Executives
- 11.4.3. Company Snapshot
- 11.4.4. Operating Business Segments
- 11.4.5. Product Portfolio
- 11.4.6. Business Performance
- 11.4.7. Key Strategic Moves and Developments
- 11.5. Pacific Foods
- 11.5.1. Company Overview
- 11.5.2. Key Executives
- 11.5.3. Company Snapshot
- 11.5.4. Operating Business Segments
- 11.5.5. Product Portfolio
- 11.5.6. Business Performance
- 11.5.7. Key Strategic Moves and Developments
- 11.6. Baxters Food Group Limited.
- 11.6.1. Company Overview
- 11.6.2. Key Executives
- 11.6.3. Company Snapshot
- 11.6.4. Operating Business Segments
- 11.6.5. Product Portfolio
- 11.6.6. Business Performance
- 11.6.7. Key Strategic Moves and Developments
- 11.7. Conagra Brands, Inc.
- 11.7.1. Company Overview
- 11.7.2. Key Executives
- 11.7.3. Company Snapshot
- 11.7.4. Operating Business Segments
- 11.7.5. Product Portfolio
- 11.7.6. Business Performance
- 11.7.7. Key Strategic Moves and Developments
- 11.8. The Kraft Heinz Company
- 11.8.1. Company Overview
- 11.8.2. Key Executives
- 11.8.3. Company Snapshot
- 11.8.4. Operating Business Segments
- 11.8.5. Product Portfolio
- 11.8.6. Business Performance
- 11.8.7. Key Strategic Moves and Developments
- 11.9. Hindustan Unilever Limited
- 11.9.1. Company Overview
- 11.9.2. Key Executives
- 11.9.3. Company Snapshot
- 11.9.4. Operating Business Segments
- 11.9.5. Product Portfolio
- 11.9.6. Business Performance
- 11.9.7. Key Strategic Moves and Developments
- 11.10. Kettle And Fire
- 11.10.1. Company Overview
- 11.10.2. Key Executives
- 11.10.3. Company Snapshot
- 11.10.4. Operating Business Segments
- 11.10.5. Product Portfolio
- 11.10.6. Business Performance
- 11.10.7. Key Strategic Moves and Developments
