|
|
市場調査レポート
商品コード
1513345
生分解性プラスチック市場:タイプ別、用途別:世界の機会分析と産業予測、2023年~2033年Biodegradable Plastics Market By Type (Polylactic Acid, Polybutylene Adipate Terephthalate, Polybutylene Succinate, Polyhydroxyalkanoates, Starch Blends, Others), By Application : Global Opportunity Analysis and Industry Forecast, 2023-2033 |
||||||
|
|
|||||||
|
|||||||


| 生分解性プラスチック市場:タイプ別、用途別:世界の機会分析と産業予測、2023年~2033年 |
|
出版日: 2024年04月01日
発行: Allied Market Research
ページ情報: 英文 349 Pages
納期: 2~3営業日
|

- 全表示
- 概要
- 図表
- 目次
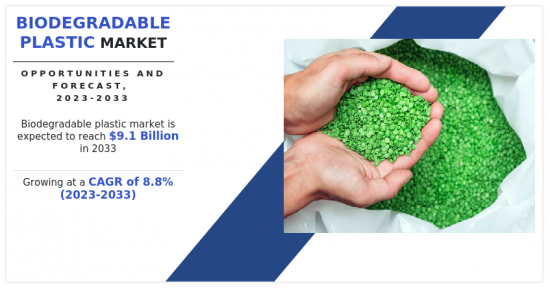
生分解性プラスチックの世界市場規模は2023年に39億米ドル、2033年には91億米ドルに達し、2023年から2033年までのCAGRは8.8%で成長すると予測されています。
生分解性プラスチックとは、微生物による消化のような生物学的プロセスを通じて環境中で自然に分解し、水、二酸化炭素、バイオマスのような単純な物質になる合成ポリマーを指します。何世紀にもわたって環境中に残留する可能性のある従来のプラスチックとは異なり、生分解性プラスチックは比較的短時間で分解されるため、プラスチック廃棄物の蓄積や環境汚染を減らすことができます。生分解性プラスチックは、従来のプラスチックの特性を模倣しつつ、より持続可能な使用済みプラスチックの選択肢を提供するように設計されています。しかし、さまざまな環境下での有効性や完全な分解の時間軸は、温度や水分、特定の微生物の存在などの要因によって変化する可能性があります。
材料科学とバイオテクノロジーにおける継続的な進歩は、特性と性能を向上させた革新的な生分解性プラスチックの開発に貢献しています。研究者たちは、バイオプラスチックの耐久性、強度、生分解性を向上させるために、新しいバイオポリマーの配合、バイオベースの原料、製造プロセスを探求しています。植物由来の糖類、でんぷん、セルロース、微生物発酵などの再生可能資源に由来する生分解性ポリマーは、石油由来のプラスチックに代わる持続可能な選択肢を提供します。生分解性包装材料、コーティング、フィルムにおける画期的な進歩は、食品包装、農業、繊維、生物医療機器など、さまざまな産業での応用を可能にし、市場拡大を後押ししています。
さらに、消費者の嗜好の変化や環境問題に対する意識の高まりが購買決定に影響を与え、生分解性プラスチックを含む環境に優しい製品に対する需要を促進しています。消費者は環境への影響を最小限に抑え、自分の価値観に合った持続可能な代替品を求めており、これが企業に生分解性包装ソリューションや環境に優しい慣行の採用を促しています。企業の持続可能性への取り組みは、評判への懸念、規制遵守、利害関係者からの圧力に後押しされ、サプライチェーンや製品ポートフォリオにおける生分解性プラスチックの採用を後押ししています。持続可能なパッケージングと環境に優しいブランド戦略によるブランドの差別化は、市場競争力と消費者への訴求力を高める。
さらに、都市化、人口増加、持続可能性の課題などの世界のメガトレンドが、地域や業界を超えた市場の拡大と多様化を促進しています。特にアジア太平洋とラテンアメリカの新興国は、可処分所得の増加、都市化、プラスチック汚染に対処するための規制介入により、生分解性プラスチックにとって大きな成長機会となっています。飲食品、化粧品、パーソナルケア産業における生分解性包装ソリューションの採用は、消費者の嗜好と規制遵守に後押しされ、市場の成長と普及を促進しています。世界化、貿易自由化、サプライチェーンの統合は、技術、専門知識、市場機会の交換を促進し、生分解性プラスチック分野における世界の協力と市場開拓を促進します。
生分解性プラスチックを既存の廃棄物管理システムにうまく組み込むには、回収、分別、処理のための適切なインフラが利用できるかどうかが条件となります。しかし、多くの地域では、堆肥化施設や産業用堆肥化サイトなど、生分解性廃棄物を効果的に管理するために必要なインフラが不足しています。
不十分なインフラは、生分解性プラスチックの適切な処分や堆肥化を妨げるだけでなく、生分解性プラスチックと非生分解性プラスチックがしばしば混ざり合い、リサイクル工程を複雑にするため、リサイクルの流れにおける汚染の一因にもなっています。この課題に対処するには、インフラの整備や、生分解性材料に合わせた廃棄物管理方法に多額の投資を行う必要があります。
それとは逆に、気候変動への対応と環境リスクの軽減の必要性から、企業戦略に持続可能性が組み込まれ、業界全体で生分解性プラスチックの採用が広がっています。バイオプラスチックの配合や加工技術の革新などの技術的進歩は、生分解性プラスチックの性能、費用対効果、拡張性を向上させ、市場をさらに強化しています。包装業界では、生分解性プラスチックは従来のプラスチックに代わる持続可能な選択肢を提供し、食品包装、飲料容器、電子機器包装など多様な用途に対応しています。農業分野では、生分解性マルチフィルム、種子コーティング剤、ポットなどが、プラスチック廃棄物を削減しながら、土壌の健全性、水質保全、苗の成長を促進しています。繊維・アパレル分野では、竹や麻のような再生可能な資源に由来する生分解性繊維が採用され、環境への影響を抑えながら通気性と吸湿性に優れた生地を提供しています。自動車メーカーや電子機器メーカーは、内装部品やケーシングに生分解性プラスチックを使用することを検討しており、その軽量で耐久性のある特性を活かして、石油由来のプラスチックへの依存を減らし、環境フットプリントを最小限に抑えています。
生分解性プラスチック市場は、タイプ、用途、地域によって区分されます。タイプ別では、市場はポリ乳酸(PLA)、ポリブチレンアジペートテレフタレート(PBAT)、ポリブチレンサクシネート(PBS)、ポリヒドロキシアルカノエート(PHA)、デンプンブレンド、その他に分類されます。用途別では、包装、農業、耐久消費財、繊維、その他に分けられます。地域別では、北米、欧州、アジア太平洋、LAMEAで調査されています。
利害関係者にとっての主なメリット
- 当レポートは、2023年から2033年までの生分解性プラスチック市場分析の市場セグメント、現在の動向、推定・動向、力学を定量的に分析し、生分解性プラスチック市場の有力な市場機会を特定します。
- 市場促進要因、市場抑制要因、市場機会に関連する情報とともに市場調査を提供します。
- ポーターのファイブフォース分析では、利害関係者が利益重視のビジネス決定を下し、サプライヤーとバイヤーのネットワークを強化できるように、バイヤーとサプライヤーの潜在力を強調します。
- 生分解性プラスチック市場のセグメンテーションを詳細に分析することで、市場機会を見極めることができます。
- 各地域の主要国は、世界市場への収益貢献度に応じてマッピングされています。
- 市場プレイヤーのポジショニングはベンチマーキングを容易にし、市場プレイヤーの現在のポジションを明確に理解することができます。
- 本レポートには、地域別および世界の生分解性プラスチック市場動向、主要企業、市場セグメント、応用分野、市場成長戦略の分析が含まれています。
本レポートで可能なレポートカスタマイズ(追加費用とスケジュールがあります。)
- エンドユーザーの嗜好とペインポイント
- インストールベース分析
- 投資機会
- 技術動向分析
- 主要企業の新製品開発/製品マトリックス
- 国、地域、世界レベルでの患者/疫学データ
- 顧客の関心に応じた追加の企業プロファイル
- 国別または地域別追加分析-市場規模および予測
- クリスクロスセグメント分析-市場規模と予測
- 企業プロファイルの拡張リスト
- 過去の市場データ
- 輸出入分析/データ
- 主要プレーヤーの詳細(所在地、連絡先、サプライヤー/ベンダーネットワークなどを含む、エクセル形式)
- 顧客/消費者/原料サプライヤーのリスト-バリューチェーン分析
- 世界/地域/国別レベルでのプレーヤーの市場シェア分析
- SWOT分析
- 数量市場規模と予測
目次
第1章 イントロダクション
第2章 エグゼクティブサマリー
第3章 市場概要
- 市場の定義と範囲
- 主な調査結果
- 影響要因
- 主な投資機会
- ポーターのファイブフォース分析
- 市場力学
- 促進要因
- 抑制要因
- 機会
- バリューチェーン分析
- 価格分析
- 主要規制分析
- 特許情勢
第4章 生分解性プラスチック市場:タイプ別
- 概要
- ポリ乳酸(PLA)
- ポリブチレンアジペートテレフタレート(PBAT)
- ポリブチレンサクシネート(PBS)
- ポリヒドロキシアルカノエート(PHA)
- スターチブレンド
- その他
第5章 生分解性プラスチック市場:用途別
- 概要
- 包装
- 農業
- 耐久消費財
- 繊維
- その他
第6章 生分解性プラスチック市場:地域別
- 概要
- 北米
- 米国
- カナダ
- メキシコ
- 欧州
- ドイツ
- 英国
- フランス
- スペイン
- イタリア
- その他
- アジア太平洋
- 中国
- インド
- 日本
- 韓国
- オーストラリア
- その他
- ラテンアメリカ・中東・アフリカ
- ブラジル
- サウジアラビア
- 南アフリカ
- その他
第7章 競合情勢
- イントロダクション
- 主要成功戦略
- 主要10社の製品マッピング
- 競合ダッシュボード
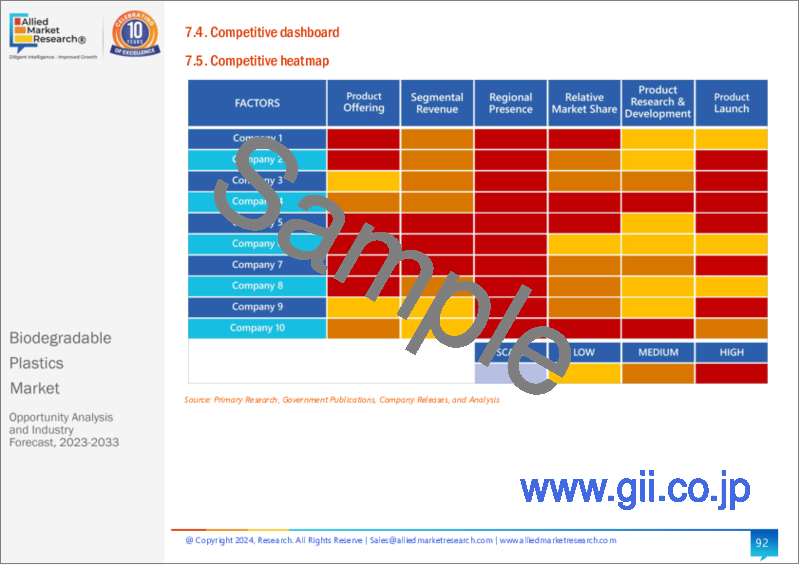
- 競合ヒートマップ
- 主要企業のポジショニング、2023年
第8章 企業プロファイル
- BASF SE
- NatureWorks LLC.
- Total Corbion
- Novamont
- Biome Bioplastics
- Mitsubishi Chemical Holding Corporation
- TORAY INDUSTRIES, INC.
- Plantic Technologies Ltd.
- DaniMer Scientific, LLC
- Fkur Kunstsoff
LIST OF TABLES
- TABLE 01. GLOBAL BIODEGRADABLE PLASTICS MARKET, BY TYPE, 2023-2033 ($MILLION)
- TABLE 02. GLOBAL BIODEGRADABLE PLASTICS MARKET, BY TYPE, 2023-2033 (KILOTON)
- TABLE 03. BIODEGRADABLE PLASTICS MARKET FOR POLYLACTIC ACID (PLA), BY REGION, 2023-2033 ($MILLION)
- TABLE 04. BIODEGRADABLE PLASTICS MARKET FOR POLYLACTIC ACID (PLA), BY REGION, 2023-2033 (KILOTON)
- TABLE 05. BIODEGRADABLE PLASTICS MARKET FOR POLYBUTYLENE ADIPATE TEREPHTHALATE (PBAT), BY REGION, 2023-2033 ($MILLION)
- TABLE 06. BIODEGRADABLE PLASTICS MARKET FOR POLYBUTYLENE ADIPATE TEREPHTHALATE (PBAT), BY REGION, 2023-2033 (KILOTON)
- TABLE 07. BIODEGRADABLE PLASTICS MARKET FOR POLYBUTYLENE SUCCINATE (PBS), BY REGION, 2023-2033 ($MILLION)
- TABLE 08. BIODEGRADABLE PLASTICS MARKET FOR POLYBUTYLENE SUCCINATE (PBS), BY REGION, 2023-2033 (KILOTON)
- TABLE 09. BIODEGRADABLE PLASTICS MARKET FOR POLYHYDROXYALKANOATES (PHA), BY REGION, 2023-2033 ($MILLION)
- TABLE 10. BIODEGRADABLE PLASTICS MARKET FOR POLYHYDROXYALKANOATES (PHA), BY REGION, 2023-2033 (KILOTON)
- TABLE 11. BIODEGRADABLE PLASTICS MARKET FOR STARCH BLENDS, BY REGION, 2023-2033 ($MILLION)
- TABLE 12. BIODEGRADABLE PLASTICS MARKET FOR STARCH BLENDS, BY REGION, 2023-2033 (KILOTON)
- TABLE 13. BIODEGRADABLE PLASTICS MARKET FOR OTHERS, BY REGION, 2023-2033 ($MILLION)
- TABLE 14. BIODEGRADABLE PLASTICS MARKET FOR OTHERS, BY REGION, 2023-2033 (KILOTON)
- TABLE 15. GLOBAL BIODEGRADABLE PLASTICS MARKET, BY APPLICATION, 2023-2033 ($MILLION)
- TABLE 16. GLOBAL BIODEGRADABLE PLASTICS MARKET, BY APPLICATION, 2023-2033 (KILOTON)
- TABLE 17. BIODEGRADABLE PLASTICS MARKET FOR PACKAGING, BY REGION, 2023-2033 ($MILLION)
- TABLE 18. BIODEGRADABLE PLASTICS MARKET FOR PACKAGING, BY REGION, 2023-2033 (KILOTON)
- TABLE 19. BIODEGRADABLE PLASTICS MARKET FOR AGRICULTURE, BY REGION, 2023-2033 ($MILLION)
- TABLE 20. BIODEGRADABLE PLASTICS MARKET FOR AGRICULTURE, BY REGION, 2023-2033 (KILOTON)
- TABLE 21. BIODEGRADABLE PLASTICS MARKET FOR CONSUMER DURABLE, BY REGION, 2023-2033 ($MILLION)
- TABLE 22. BIODEGRADABLE PLASTICS MARKET FOR CONSUMER DURABLE, BY REGION, 2023-2033 (KILOTON)
- TABLE 23. BIODEGRADABLE PLASTICS MARKET FOR TEXTILE, BY REGION, 2023-2033 ($MILLION)
- TABLE 24. BIODEGRADABLE PLASTICS MARKET FOR TEXTILE, BY REGION, 2023-2033 (KILOTON)
- TABLE 25. BIODEGRADABLE PLASTICS MARKET FOR OTHERS, BY REGION, 2023-2033 ($MILLION)
- TABLE 26. BIODEGRADABLE PLASTICS MARKET FOR OTHERS, BY REGION, 2023-2033 (KILOTON)
- TABLE 27. BIODEGRADABLE PLASTICS MARKET, BY REGION, 2023-2033 ($MILLION)
- TABLE 28. BIODEGRADABLE PLASTICS MARKET, BY REGION, 2023-2033 (KILOTON)
- TABLE 29. NORTH AMERICA BIODEGRADABLE PLASTICS MARKET, BY TYPE, 2023-2033 ($MILLION)
- TABLE 30. NORTH AMERICA BIODEGRADABLE PLASTICS MARKET, BY TYPE, 2023-2033 (KILOTON)
- TABLE 31. NORTH AMERICA BIODEGRADABLE PLASTICS MARKET, BY APPLICATION, 2023-2033 ($MILLION)
- TABLE 32. NORTH AMERICA BIODEGRADABLE PLASTICS MARKET, BY APPLICATION, 2023-2033 (KILOTON)
- TABLE 33. NORTH AMERICA BIODEGRADABLE PLASTICS MARKET, BY COUNTRY, 2023-2033 ($MILLION)
- TABLE 34. NORTH AMERICA BIODEGRADABLE PLASTICS MARKET, BY COUNTRY, 2023-2033 (KILOTON)
- TABLE 35. U.S. BIODEGRADABLE PLASTICS MARKET, BY TYPE, 2023-2033 ($MILLION)
- TABLE 36. U.S. BIODEGRADABLE PLASTICS MARKET, BY TYPE, 2023-2033 (KILOTON)
- TABLE 37. U.S. BIODEGRADABLE PLASTICS MARKET, BY APPLICATION, 2023-2033 ($MILLION)
- TABLE 38. U.S. BIODEGRADABLE PLASTICS MARKET, BY APPLICATION, 2023-2033 (KILOTON)
- TABLE 39. CANADA BIODEGRADABLE PLASTICS MARKET, BY TYPE, 2023-2033 ($MILLION)
- TABLE 40. CANADA BIODEGRADABLE PLASTICS MARKET, BY TYPE, 2023-2033 (KILOTON)
- TABLE 41. CANADA BIODEGRADABLE PLASTICS MARKET, BY APPLICATION, 2023-2033 ($MILLION)
- TABLE 42. CANADA BIODEGRADABLE PLASTICS MARKET, BY APPLICATION, 2023-2033 (KILOTON)
- TABLE 43. MEXICO BIODEGRADABLE PLASTICS MARKET, BY TYPE, 2023-2033 ($MILLION)
- TABLE 44. MEXICO BIODEGRADABLE PLASTICS MARKET, BY TYPE, 2023-2033 (KILOTON)
- TABLE 45. MEXICO BIODEGRADABLE PLASTICS MARKET, BY APPLICATION, 2023-2033 ($MILLION)
- TABLE 46. MEXICO BIODEGRADABLE PLASTICS MARKET, BY APPLICATION, 2023-2033 (KILOTON)
- TABLE 47. EUROPE BIODEGRADABLE PLASTICS MARKET, BY TYPE, 2023-2033 ($MILLION)
- TABLE 48. EUROPE BIODEGRADABLE PLASTICS MARKET, BY TYPE, 2023-2033 (KILOTON)
- TABLE 49. EUROPE BIODEGRADABLE PLASTICS MARKET, BY APPLICATION, 2023-2033 ($MILLION)
- TABLE 50. EUROPE BIODEGRADABLE PLASTICS MARKET, BY APPLICATION, 2023-2033 (KILOTON)
- TABLE 51. EUROPE BIODEGRADABLE PLASTICS MARKET, BY COUNTRY, 2023-2033 ($MILLION)
- TABLE 52. EUROPE BIODEGRADABLE PLASTICS MARKET, BY COUNTRY, 2023-2033 (KILOTON)
- TABLE 53. GERMANY BIODEGRADABLE PLASTICS MARKET, BY TYPE, 2023-2033 ($MILLION)
- TABLE 54. GERMANY BIODEGRADABLE PLASTICS MARKET, BY TYPE, 2023-2033 (KILOTON)
- TABLE 55. GERMANY BIODEGRADABLE PLASTICS MARKET, BY APPLICATION, 2023-2033 ($MILLION)
- TABLE 56. GERMANY BIODEGRADABLE PLASTICS MARKET, BY APPLICATION, 2023-2033 (KILOTON)
- TABLE 57. UK BIODEGRADABLE PLASTICS MARKET, BY TYPE, 2023-2033 ($MILLION)
- TABLE 58. UK BIODEGRADABLE PLASTICS MARKET, BY TYPE, 2023-2033 (KILOTON)
- TABLE 59. UK BIODEGRADABLE PLASTICS MARKET, BY APPLICATION, 2023-2033 ($MILLION)
- TABLE 60. UK BIODEGRADABLE PLASTICS MARKET, BY APPLICATION, 2023-2033 (KILOTON)
- TABLE 61. FRANCE BIODEGRADABLE PLASTICS MARKET, BY TYPE, 2023-2033 ($MILLION)
- TABLE 62. FRANCE BIODEGRADABLE PLASTICS MARKET, BY TYPE, 2023-2033 (KILOTON)
- TABLE 63. FRANCE BIODEGRADABLE PLASTICS MARKET, BY APPLICATION, 2023-2033 ($MILLION)
- TABLE 64. FRANCE BIODEGRADABLE PLASTICS MARKET, BY APPLICATION, 2023-2033 (KILOTON)
- TABLE 65. SPAIN BIODEGRADABLE PLASTICS MARKET, BY TYPE, 2023-2033 ($MILLION)
- TABLE 66. SPAIN BIODEGRADABLE PLASTICS MARKET, BY TYPE, 2023-2033 (KILOTON)
- TABLE 67. SPAIN BIODEGRADABLE PLASTICS MARKET, BY APPLICATION, 2023-2033 ($MILLION)
- TABLE 68. SPAIN BIODEGRADABLE PLASTICS MARKET, BY APPLICATION, 2023-2033 (KILOTON)
- TABLE 69. ITALY BIODEGRADABLE PLASTICS MARKET, BY TYPE, 2023-2033 ($MILLION)
- TABLE 70. ITALY BIODEGRADABLE PLASTICS MARKET, BY TYPE, 2023-2033 (KILOTON)
- TABLE 71. ITALY BIODEGRADABLE PLASTICS MARKET, BY APPLICATION, 2023-2033 ($MILLION)
- TABLE 72. ITALY BIODEGRADABLE PLASTICS MARKET, BY APPLICATION, 2023-2033 (KILOTON)
- TABLE 73. REST OF EUROPE BIODEGRADABLE PLASTICS MARKET, BY TYPE, 2023-2033 ($MILLION)
- TABLE 74. REST OF EUROPE BIODEGRADABLE PLASTICS MARKET, BY TYPE, 2023-2033 (KILOTON)
- TABLE 75. REST OF EUROPE BIODEGRADABLE PLASTICS MARKET, BY APPLICATION, 2023-2033 ($MILLION)
- TABLE 76. REST OF EUROPE BIODEGRADABLE PLASTICS MARKET, BY APPLICATION, 2023-2033 (KILOTON)
- TABLE 77. ASIA-PACIFIC BIODEGRADABLE PLASTICS MARKET, BY TYPE, 2023-2033 ($MILLION)
- TABLE 78. ASIA-PACIFIC BIODEGRADABLE PLASTICS MARKET, BY TYPE, 2023-2033 (KILOTON)
- TABLE 79. ASIA-PACIFIC BIODEGRADABLE PLASTICS MARKET, BY APPLICATION, 2023-2033 ($MILLION)
- TABLE 80. ASIA-PACIFIC BIODEGRADABLE PLASTICS MARKET, BY APPLICATION, 2023-2033 (KILOTON)
- TABLE 81. ASIA-PACIFIC BIODEGRADABLE PLASTICS MARKET, BY COUNTRY, 2023-2033 ($MILLION)
- TABLE 82. ASIA-PACIFIC BIODEGRADABLE PLASTICS MARKET, BY COUNTRY, 2023-2033 (KILOTON)
- TABLE 83. CHINA BIODEGRADABLE PLASTICS MARKET, BY TYPE, 2023-2033 ($MILLION)
- TABLE 84. CHINA BIODEGRADABLE PLASTICS MARKET, BY TYPE, 2023-2033 (KILOTON)
- TABLE 85. CHINA BIODEGRADABLE PLASTICS MARKET, BY APPLICATION, 2023-2033 ($MILLION)
- TABLE 86. CHINA BIODEGRADABLE PLASTICS MARKET, BY APPLICATION, 2023-2033 (KILOTON)
- TABLE 87. INDIA BIODEGRADABLE PLASTICS MARKET, BY TYPE, 2023-2033 ($MILLION)
- TABLE 88. INDIA BIODEGRADABLE PLASTICS MARKET, BY TYPE, 2023-2033 (KILOTON)
- TABLE 89. INDIA BIODEGRADABLE PLASTICS MARKET, BY APPLICATION, 2023-2033 ($MILLION)
- TABLE 90. INDIA BIODEGRADABLE PLASTICS MARKET, BY APPLICATION, 2023-2033 (KILOTON)
- TABLE 91. JAPAN BIODEGRADABLE PLASTICS MARKET, BY TYPE, 2023-2033 ($MILLION)
- TABLE 92. JAPAN BIODEGRADABLE PLASTICS MARKET, BY TYPE, 2023-2033 (KILOTON)
- TABLE 93. JAPAN BIODEGRADABLE PLASTICS MARKET, BY APPLICATION, 2023-2033 ($MILLION)
- TABLE 94. JAPAN BIODEGRADABLE PLASTICS MARKET, BY APPLICATION, 2023-2033 (KILOTON)
- TABLE 95. SOUTH KOREA BIODEGRADABLE PLASTICS MARKET, BY TYPE, 2023-2033 ($MILLION)
- TABLE 96. SOUTH KOREA BIODEGRADABLE PLASTICS MARKET, BY TYPE, 2023-2033 (KILOTON)
- TABLE 97. SOUTH KOREA BIODEGRADABLE PLASTICS MARKET, BY APPLICATION, 2023-2033 ($MILLION)
- TABLE 98. SOUTH KOREA BIODEGRADABLE PLASTICS MARKET, BY APPLICATION, 2023-2033 (KILOTON)
- TABLE 99. AUSTRALIA BIODEGRADABLE PLASTICS MARKET, BY TYPE, 2023-2033 ($MILLION)
- TABLE 100. AUSTRALIA BIODEGRADABLE PLASTICS MARKET, BY TYPE, 2023-2033 (KILOTON)
- TABLE 101. AUSTRALIA BIODEGRADABLE PLASTICS MARKET, BY APPLICATION, 2023-2033 ($MILLION)
- TABLE 102. AUSTRALIA BIODEGRADABLE PLASTICS MARKET, BY APPLICATION, 2023-2033 (KILOTON)
- TABLE 103. REST OF ASIA-PACIFIC BIODEGRADABLE PLASTICS MARKET, BY TYPE, 2023-2033 ($MILLION)
- TABLE 104. REST OF ASIA-PACIFIC BIODEGRADABLE PLASTICS MARKET, BY TYPE, 2023-2033 (KILOTON)
- TABLE 105. REST OF ASIA-PACIFIC BIODEGRADABLE PLASTICS MARKET, BY APPLICATION, 2023-2033 ($MILLION)
- TABLE 106. REST OF ASIA-PACIFIC BIODEGRADABLE PLASTICS MARKET, BY APPLICATION, 2023-2033 (KILOTON)
- TABLE 107. LAMEA BIODEGRADABLE PLASTICS MARKET, BY TYPE, 2023-2033 ($MILLION)
- TABLE 108. LAMEA BIODEGRADABLE PLASTICS MARKET, BY TYPE, 2023-2033 (KILOTON)
- TABLE 109. LAMEA BIODEGRADABLE PLASTICS MARKET, BY APPLICATION, 2023-2033 ($MILLION)
- TABLE 110. LAMEA BIODEGRADABLE PLASTICS MARKET, BY APPLICATION, 2023-2033 (KILOTON)
- TABLE 111. LAMEA BIODEGRADABLE PLASTICS MARKET, BY COUNTRY, 2023-2033 ($MILLION)
- TABLE 112. LAMEA BIODEGRADABLE PLASTICS MARKET, BY COUNTRY, 2023-2033 (KILOTON)
- TABLE 113. BRAZIL BIODEGRADABLE PLASTICS MARKET, BY TYPE, 2023-2033 ($MILLION)
- TABLE 114. BRAZIL BIODEGRADABLE PLASTICS MARKET, BY TYPE, 2023-2033 (KILOTON)
- TABLE 115. BRAZIL BIODEGRADABLE PLASTICS MARKET, BY APPLICATION, 2023-2033 ($MILLION)
- TABLE 116. BRAZIL BIODEGRADABLE PLASTICS MARKET, BY APPLICATION, 2023-2033 (KILOTON)
- TABLE 117. SAUDI ARABIA BIODEGRADABLE PLASTICS MARKET, BY TYPE, 2023-2033 ($MILLION)
- TABLE 118. SAUDI ARABIA BIODEGRADABLE PLASTICS MARKET, BY TYPE, 2023-2033 (KILOTON)
- TABLE 119. SAUDI ARABIA BIODEGRADABLE PLASTICS MARKET, BY APPLICATION, 2023-2033 ($MILLION)
- TABLE 120. SAUDI ARABIA BIODEGRADABLE PLASTICS MARKET, BY APPLICATION, 2023-2033 (KILOTON)
- TABLE 121. SOUTH AFRICA BIODEGRADABLE PLASTICS MARKET, BY TYPE, 2023-2033 ($MILLION)
- TABLE 122. SOUTH AFRICA BIODEGRADABLE PLASTICS MARKET, BY TYPE, 2023-2033 (KILOTON)
- TABLE 123. SOUTH AFRICA BIODEGRADABLE PLASTICS MARKET, BY APPLICATION, 2023-2033 ($MILLION)
- TABLE 124. SOUTH AFRICA BIODEGRADABLE PLASTICS MARKET, BY APPLICATION, 2023-2033 (KILOTON)
- TABLE 125. REST OF LAMEA BIODEGRADABLE PLASTICS MARKET, BY TYPE, 2023-2033 ($MILLION)
- TABLE 126. REST OF LAMEA BIODEGRADABLE PLASTICS MARKET, BY TYPE, 2023-2033 (KILOTON)
- TABLE 127. REST OF LAMEA BIODEGRADABLE PLASTICS MARKET, BY APPLICATION, 2023-2033 ($MILLION)
- TABLE 128. REST OF LAMEA BIODEGRADABLE PLASTICS MARKET, BY APPLICATION, 2023-2033 (KILOTON)
- TABLE 129. BASF SE: KEY EXECUTIVES
- TABLE 130. BASF SE: COMPANY SNAPSHOT
- TABLE 131. BASF SE: PRODUCT SEGMENTS
- TABLE 132. BASF SE: SERVICE SEGMENTS
- TABLE 133. BASF SE: PRODUCT PORTFOLIO
- TABLE 134. BASF SE: KEY STRATEGIES
- TABLE 135. NATUREWORKS LLC.: KEY EXECUTIVES
- TABLE 136. NATUREWORKS LLC.: COMPANY SNAPSHOT
- TABLE 137. NATUREWORKS LLC.: PRODUCT SEGMENTS
- TABLE 138. NATUREWORKS LLC.: SERVICE SEGMENTS
- TABLE 139. NATUREWORKS LLC.: PRODUCT PORTFOLIO
- TABLE 140. NATUREWORKS LLC.: KEY STRATEGIES
- TABLE 141. TOTAL CORBION: KEY EXECUTIVES
- TABLE 142. TOTAL CORBION: COMPANY SNAPSHOT
- TABLE 143. TOTAL CORBION: PRODUCT SEGMENTS
- TABLE 144. TOTAL CORBION: SERVICE SEGMENTS
- TABLE 145. TOTAL CORBION: PRODUCT PORTFOLIO
- TABLE 146. TOTAL CORBION: KEY STRATEGIES
- TABLE 147. NOVAMONT: KEY EXECUTIVES
- TABLE 148. NOVAMONT: COMPANY SNAPSHOT
- TABLE 149. NOVAMONT: PRODUCT SEGMENTS
- TABLE 150. NOVAMONT: SERVICE SEGMENTS
- TABLE 151. NOVAMONT: PRODUCT PORTFOLIO
- TABLE 152. NOVAMONT: KEY STRATEGIES
- TABLE 153. BIOME BIOPLASTICS: KEY EXECUTIVES
- TABLE 154. BIOME BIOPLASTICS: COMPANY SNAPSHOT
- TABLE 155. BIOME BIOPLASTICS: PRODUCT SEGMENTS
- TABLE 156. BIOME BIOPLASTICS: SERVICE SEGMENTS
- TABLE 157. BIOME BIOPLASTICS: PRODUCT PORTFOLIO
- TABLE 158. BIOME BIOPLASTICS: KEY STRATEGIES
- TABLE 159. MITSUBISHI CHEMICAL HOLDING CORPORATION: KEY EXECUTIVES
- TABLE 160. MITSUBISHI CHEMICAL HOLDING CORPORATION: COMPANY SNAPSHOT
- TABLE 161. MITSUBISHI CHEMICAL HOLDING CORPORATION: PRODUCT SEGMENTS
- TABLE 162. MITSUBISHI CHEMICAL HOLDING CORPORATION: SERVICE SEGMENTS
- TABLE 163. MITSUBISHI CHEMICAL HOLDING CORPORATION: PRODUCT PORTFOLIO
- TABLE 164. MITSUBISHI CHEMICAL HOLDING CORPORATION: KEY STRATEGIES
- TABLE 165. TORAY INDUSTRIES, INC.: KEY EXECUTIVES
- TABLE 166. TORAY INDUSTRIES, INC.: COMPANY SNAPSHOT
- TABLE 167. TORAY INDUSTRIES, INC.: PRODUCT SEGMENTS
- TABLE 168. TORAY INDUSTRIES, INC.: SERVICE SEGMENTS
- TABLE 169. TORAY INDUSTRIES, INC.: PRODUCT PORTFOLIO
- TABLE 170. TORAY INDUSTRIES, INC.: KEY STRATEGIES
- TABLE 171. PLANTIC TECHNOLOGIES LTD.: KEY EXECUTIVES
- TABLE 172. PLANTIC TECHNOLOGIES LTD.: COMPANY SNAPSHOT
- TABLE 173. PLANTIC TECHNOLOGIES LTD.: PRODUCT SEGMENTS
- TABLE 174. PLANTIC TECHNOLOGIES LTD.: SERVICE SEGMENTS
- TABLE 175. PLANTIC TECHNOLOGIES LTD.: PRODUCT PORTFOLIO
- TABLE 176. PLANTIC TECHNOLOGIES LTD.: KEY STRATEGIES
- TABLE 177. DANIMER SCIENTIFIC, LLC: KEY EXECUTIVES
- TABLE 178. DANIMER SCIENTIFIC, LLC: COMPANY SNAPSHOT
- TABLE 179. DANIMER SCIENTIFIC, LLC: PRODUCT SEGMENTS
- TABLE 180. DANIMER SCIENTIFIC, LLC: SERVICE SEGMENTS
- TABLE 181. DANIMER SCIENTIFIC, LLC: PRODUCT PORTFOLIO
- TABLE 182. DANIMER SCIENTIFIC, LLC: KEY STRATEGIES
- TABLE 183. FKUR KUNSTSOFF: KEY EXECUTIVES
- TABLE 184. FKUR KUNSTSOFF: COMPANY SNAPSHOT
- TABLE 185. FKUR KUNSTSOFF: PRODUCT SEGMENTS
- TABLE 186. FKUR KUNSTSOFF: SERVICE SEGMENTS
- TABLE 187. FKUR KUNSTSOFF: PRODUCT PORTFOLIO
- TABLE 188. FKUR KUNSTSOFF: KEY STRATEGIES
LIST OF FIGURES
- FIGURE 01. BIODEGRADABLE PLASTICS MARKET, 2023-2033
- FIGURE 02. SEGMENTATION OF BIODEGRADABLE PLASTICS MARKET,2023-2033
- FIGURE 03. TOP IMPACTING FACTORS IN BIODEGRADABLE PLASTICS MARKET
- FIGURE 04. TOP INVESTMENT POCKETS IN BIODEGRADABLE PLASTICS MARKET (2023-2033)
- FIGURE 05. BARGAINING POWER OF SUPPLIERS
- FIGURE 06. BARGAINING POWER OF BUYERS
- FIGURE 07. THREAT OF SUBSTITUTION
- FIGURE 08. THREAT OF SUBSTITUTION
- FIGURE 09. COMPETITIVE RIVALRY
- FIGURE 10. GLOBAL BIODEGRADABLE PLASTICS MARKET:DRIVERS, RESTRAINTS AND OPPORTUNITIES
- FIGURE 11. PRICING ANALYSIS: BIODEGRADABLE PLASTICS MARKET 2023 AND 2033
- FIGURE 12. IMPACT OF KEY REGULATION: BIODEGRADABLE PLASTICS MARKET
- FIGURE 13. PATENT ANALYSIS BY COMPANY
- FIGURE 14. PATENT ANALYSIS BY COUNTRY
- FIGURE 15. BIODEGRADABLE PLASTICS MARKET, BY TYPE, 2023 AND 2033(%)
- FIGURE 16. COMPARATIVE SHARE ANALYSIS OF BIODEGRADABLE PLASTICS MARKET FOR POLYLACTIC ACID (PLA), BY COUNTRY 2023 AND 2033(%)
- FIGURE 17. COMPARATIVE SHARE ANALYSIS OF BIODEGRADABLE PLASTICS MARKET FOR POLYBUTYLENE ADIPATE TEREPHTHALATE (PBAT), BY COUNTRY 2023 AND 2033(%)
- FIGURE 18. COMPARATIVE SHARE ANALYSIS OF BIODEGRADABLE PLASTICS MARKET FOR POLYBUTYLENE SUCCINATE (PBS), BY COUNTRY 2023 AND 2033(%)
- FIGURE 19. COMPARATIVE SHARE ANALYSIS OF BIODEGRADABLE PLASTICS MARKET FOR POLYHYDROXYALKANOATES (PHA), BY COUNTRY 2023 AND 2033(%)
- FIGURE 20. COMPARATIVE SHARE ANALYSIS OF BIODEGRADABLE PLASTICS MARKET FOR STARCH BLENDS, BY COUNTRY 2023 AND 2033(%)
- FIGURE 21. COMPARATIVE SHARE ANALYSIS OF BIODEGRADABLE PLASTICS MARKET FOR OTHERS, BY COUNTRY 2023 AND 2033(%)
- FIGURE 22. BIODEGRADABLE PLASTICS MARKET, BY APPLICATION, 2023 AND 2033(%)
- FIGURE 23. COMPARATIVE SHARE ANALYSIS OF BIODEGRADABLE PLASTICS MARKET FOR PACKAGING, BY COUNTRY 2023 AND 2033(%)
- FIGURE 24. COMPARATIVE SHARE ANALYSIS OF BIODEGRADABLE PLASTICS MARKET FOR AGRICULTURE, BY COUNTRY 2023 AND 2033(%)
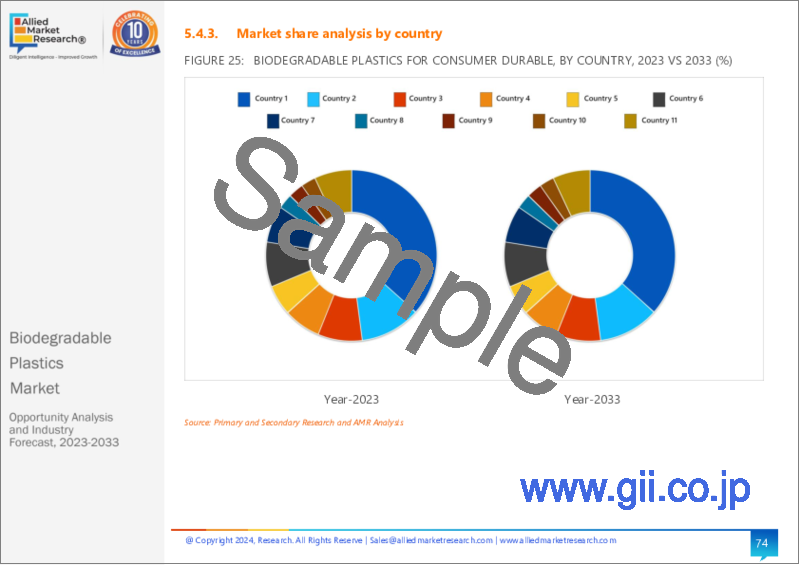
- FIGURE 25. COMPARATIVE SHARE ANALYSIS OF BIODEGRADABLE PLASTICS MARKET FOR CONSUMER DURABLE, BY COUNTRY 2023 AND 2033(%)
- FIGURE 26. COMPARATIVE SHARE ANALYSIS OF BIODEGRADABLE PLASTICS MARKET FOR TEXTILE, BY COUNTRY 2023 AND 2033(%)
- FIGURE 27. COMPARATIVE SHARE ANALYSIS OF BIODEGRADABLE PLASTICS MARKET FOR OTHERS, BY COUNTRY 2023 AND 2033(%)
- FIGURE 28. BIODEGRADABLE PLASTICS MARKET BY REGION, 2023 AND 2033(%)
- FIGURE 29. U.S. BIODEGRADABLE PLASTICS MARKET, 2023-2033 ($MILLION)
- FIGURE 30. CANADA BIODEGRADABLE PLASTICS MARKET, 2023-2033 ($MILLION)
- FIGURE 31. MEXICO BIODEGRADABLE PLASTICS MARKET, 2023-2033 ($MILLION)
- FIGURE 32. GERMANY BIODEGRADABLE PLASTICS MARKET, 2023-2033 ($MILLION)
- FIGURE 33. UK BIODEGRADABLE PLASTICS MARKET, 2023-2033 ($MILLION)
- FIGURE 34. FRANCE BIODEGRADABLE PLASTICS MARKET, 2023-2033 ($MILLION)
- FIGURE 35. SPAIN BIODEGRADABLE PLASTICS MARKET, 2023-2033 ($MILLION)
- FIGURE 36. ITALY BIODEGRADABLE PLASTICS MARKET, 2023-2033 ($MILLION)
- FIGURE 37. REST OF EUROPE BIODEGRADABLE PLASTICS MARKET, 2023-2033 ($MILLION)
- FIGURE 38. CHINA BIODEGRADABLE PLASTICS MARKET, 2023-2033 ($MILLION)
- FIGURE 39. INDIA BIODEGRADABLE PLASTICS MARKET, 2023-2033 ($MILLION)
- FIGURE 40. JAPAN BIODEGRADABLE PLASTICS MARKET, 2023-2033 ($MILLION)
- FIGURE 41. SOUTH KOREA BIODEGRADABLE PLASTICS MARKET, 2023-2033 ($MILLION)
- FIGURE 42. AUSTRALIA BIODEGRADABLE PLASTICS MARKET, 2023-2033 ($MILLION)
- FIGURE 43. REST OF ASIA-PACIFIC BIODEGRADABLE PLASTICS MARKET, 2023-2033 ($MILLION)
- FIGURE 44. BRAZIL BIODEGRADABLE PLASTICS MARKET, 2023-2033 ($MILLION)
- FIGURE 45. SAUDI ARABIA BIODEGRADABLE PLASTICS MARKET, 2023-2033 ($MILLION)
- FIGURE 46. SOUTH AFRICA BIODEGRADABLE PLASTICS MARKET, 2023-2033 ($MILLION)
- FIGURE 47. REST OF LAMEA BIODEGRADABLE PLASTICS MARKET, 2023-2033 ($MILLION)
- FIGURE 48. TOP WINNING STRATEGIES, BY YEAR
- FIGURE 49. TOP WINNING STRATEGIES, BY DEVELOPMENT
- FIGURE 50. TOP WINNING STRATEGIES, BY COMPANY
- FIGURE 51. PRODUCT MAPPING OF TOP 10 PLAYERS
- FIGURE 52. COMPETITIVE DASHBOARD
- FIGURE 53. COMPETITIVE HEATMAP: BIODEGRADABLE PLASTICS MARKET
- FIGURE 54. TOP PLAYER POSITIONING, 2023
The global biodegradable plastics market was valued at $3.9 billion in 2023, and is estimated to reach $9.1 billion by 2033, growing at a CAGR of 8.8% from 2023 to 2033.
Biodegradable plastic refers to synthetic polymers that can decompose naturally in the environment through biological processes, such as microbial digestion, into simpler substances like water, carbon dioxide, and biomass. Unlike traditional plastics, which can persist in the environment for centuries, biodegradable plastics break down relatively quickly, reducing the accumulation of plastic waste and environmental pollution. They are designed to mimic the properties of conventional plastics while offering a more sustainable end-of-life option. However, their effectiveness in various environments and their complete degradation timeline can vary depending on factors like temperature, moisture, and the presence of specific microorganisms.
Ongoing advancements in material science and biotechnology contribute to the development of innovative biodegradable plastics with enhanced properties and performance. Researchers are exploring novel biopolymer formulations, bio-based feedstocks, and manufacturing processes to improve the durability, strength, and biodegradability of bioplastics. Biodegradable polymers derived from renewable resources such as plant-based sugars, starches, cellulose, and microbial fermentation offer sustainable alternatives to petroleum-based plastics. Breakthroughs in biodegradable packaging materials, coatings, and films enable applications across various industries, including food packaging, agriculture, textiles, and biomedical devices, driving market expansion.
Moreover, changing consumer preferences and increasing awareness of environmental issues influence purchasing decisions and drive demand for eco-friendly products, including biodegradable plastics. Consumers seek sustainable alternatives that minimize environmental impact and align with their values, prompting companies to adopt biodegradable packaging solutions and eco-friendly practices. Corporate sustainability initiatives, driven by reputational concerns, regulatory compliance, and stakeholder pressure, propel the adoption of biodegradable plastics in supply chains and product portfolios. Brand differentiation through sustainable packaging and eco-friendly branding strategies enhances market competitiveness and consumer appeal.
Furthermore, global megatrends, including urbanization, population growth, and sustainability agendas, drive market expansion and diversification across regions and industries. Emerging economies, particularly in Asia-Pacific and Latin America, represent significant growth opportunities for biodegradable plastics due to rising disposable incomes, urbanization, and regulatory interventions to address plastic pollution. The adoption of biodegradable packaging solutions in food and beverage, cosmetics, and personal care industries, driven by consumer preferences and regulatory compliance, fuels market growth and penetration. Globalization, trade liberalization, and supply chain integration facilitate the exchange of technology, expertise, and market opportunities, fostering global collaboration and market development in the biodegradable plastics sector..
The successful integration of biodegradable plastics into existing waste management systems is contingent upon the availability of appropriate infrastructure for collection, sorting, and processing. However, many regions lack the necessary infrastructure to effectively manage biodegradable waste, including composting facilities and industrial composting sites.
Inadequate infrastructure not only impedes the proper disposal and composting of biodegradable plastics but also contributes to contamination in recycling streams, as biodegradable and non-biodegradable plastics are often mixed together, complicating recycling processes. Addressing this challenge requires significant investment in infrastructure development and waste management practices tailored to accommodate biodegradable materials.
On the contrary, the integration of sustainability into corporate strategies, driven by the imperative to address climate change and mitigate environmental risks, is driving widespread adoption of biodegradable plastics across industries. Technological advancements, such as innovations in bioplastic formulations and processing techniques, are further bolstering the market by improving performance, cost-effectiveness, and scalability of biodegradable plastics. Within the packaging industry, biodegradable plastics offer a sustainable alternative to traditional plastics, catering to diverse applications including food packaging, beverage containers, and electronic device packaging. In agriculture, biodegradable mulch films, seed coatings, and pots are enhancing soil health, water conservation, and seedling growth while reducing plastic waste. The textile and apparel sector is embracing biodegradable fibers derived from renewable sources like bamboo and hemp, offering breathable, moisture-wicking fabrics with reduced environmental impact. Automotive and electronics manufacturers are exploring biodegradable plastics for interior components and casings, leveraging their lightweight, durable properties to reduce reliance on petroleum-based plastics and minimize environmental footprint.
The biodegradable plastic market is segmented on the basis of type, application, and region. On the basis of type, the market is categorized into Polylactic Acid (PLA), Polybutylene Adipate Terephthalate (PBAT), Polybutylene Succinate (PBS), Polyhydroxyalkanoates (PHA), Starch Blends, and others. By application, the market is divided into packaging, Agriculture, consumer durable, textile, and others. Region-wise, the market is studied across North America, Europe, Asia-Pacific, and LAMEA.
The global biodegradable plastic market profiles leading players that include BASF SE, NatureWorks, Total Corbion, Novamont, Biome Bioplastics, Mitsubishi Chemical Holding Corporation, Toray Industries, Plantic Technologies, Danimer Scientific, and Fkur Kunstsoff. The global biodegradable plastic market report provides in-depth competitive analysis as well as profiles of these major players.
Key Benefits For Stakeholders
- This report provides a quantitative analysis of the market segments, current trends, estimations, and dynamics of the biodegradable plastic market analysis from 2023 to 2033 to identify the prevailing biodegradable plastic market opportunities.
- The market research is offered along with information related to key drivers, restraints, and opportunities.
- Porter's five forces analysis highlights the potency of buyers and suppliers to enable stakeholders make profit-oriented business decisions and strengthen their supplier-buyer network.
- In-depth analysis of the biodegradable plastic market segmentation assists to determine the prevailing market opportunities.
- Major countries in each region are mapped according to their revenue contribution to the global market.
- Market player positioning facilitates benchmarking and provides a clear understanding of the present position of the market players.
- The report includes the analysis of the regional as well as global biodegradable plastic market trends, key players, market segments, application areas, and market growth strategies.
Additional benefits you will get with this purchase are:
- Quarterly Update and* (only available with a corporate license, on listed price)
- 5 additional Company Profile of client Choice pre- or Post-purchase, as a free update.
- Free Upcoming Version on the Purchase of Five and Enterprise User License.
- 16 analyst hours of support* (post-purchase, if you find additional data requirements upon review of the report, you may receive support amounting to 16 analyst hours to solve questions, and post-sale queries)
- 15% Free Customization* (in case the scope or segment of the report does not match your requirements, 15% is equivalent to 3 working days of free work, applicable once)
- Free data Pack on the Five and Enterprise User License. (Excel version of the report)
- Free Updated report if the report is 6-12 months old or older.
- 24-hour priority response*
- Free Industry updates and white papers.
Possible Customization with this report (with additional cost and timeline, please talk to the sales executive to know more)
- End user preferences and pain points
- Installed Base analysis
- Investment Opportunities
- Technology Trend Analysis
- New Product Development/ Product Matrix of Key Players
- Patient/epidemiology data at country, region, global level
- Additional company profiles with specific to client's interest
- Additional country or region analysis- market size and forecast
- Criss-cross segment analysis- market size and forecast
- Expanded list for Company Profiles
- Historic market data
- Import Export Analysis/Data
- Key player details (including location, contact details, supplier/vendor network etc. in excel format)
- List of customers/consumers/raw material suppliers- value chain analysis
- Market share analysis of players at global/region/country level
- SWOT Analysis
- Volume Market Size and Forecast
Key Market Segments
By Type
- Polylactic Acid (PLA)
- Polybutylene Adipate Terephthalate (PBAT)
- Polybutylene Succinate (PBS)
- Polyhydroxyalkanoates (PHA)
- Starch Blends
- Others
By Application
- Packaging
- Agriculture
- Consumer Durable
- Textile
- Others
By Region
- North America
- U.S.
- Canada
- Mexico
- Europe
- Germany
- UK
- France
- Spain
- Italy
- Rest of Europe
- Asia-Pacific
- China
- India
- Japan
- South Korea
- Australia
- Rest of Asia-Pacific
- LAMEA
- Brazil
- Saudi Arabia
- South Africa
- Rest of LAMEA
Key Market Players:
- BASF SE
- NatureWorks LLC.
- Total Corbion
- Novamont
- Biome Bioplastics
- Mitsubishi Chemical Holding Corporation
- TORAY INDUSTRIES, INC.
- Plantic Technologies Ltd.
- DaniMer Scientific, LLC
- Fkur Kunstsoff
TABLE OF CONTENTS
CHAPTER 1: INTRODUCTION
- 1.1. Report description
- 1.2. Key market segments
- 1.3. Key benefits to the stakeholders
- 1.4. Research methodology
- 1.4.1. Primary research
- 1.4.2. Secondary research
- 1.4.3. Analyst tools and models
CHAPTER 2: EXECUTIVE SUMMARY
- 2.1. CXO perspective
CHAPTER 3: MARKET OVERVIEW
- 3.1. Market definition and scope
- 3.2. Key findings
- 3.2.1. Top impacting factors
- 3.2.2. Top investment pockets
- 3.3. Porter's five forces analysis
- 3.4. Market dynamics
- 3.4.1. Drivers
- 3.4.2. Restraints
- 3.4.3. Opportunities
- 3.5. Value Chain Analysis
- 3.6. Pricing Analysis
- 3.7. Key Regulation Analysis
- 3.8. Patent Landscape
CHAPTER 4: BIODEGRADABLE PLASTICS MARKET, BY TYPE
- 4.1. Overview
- 4.1.1. Market size and forecast
- 4.2. Polylactic Acid (PLA)
- 4.2.1. Key market trends, growth factors and opportunities
- 4.2.2. Market size and forecast, by region
- 4.2.3. Market share analysis by country
- 4.3. Polybutylene Adipate Terephthalate (PBAT)
- 4.3.1. Key market trends, growth factors and opportunities
- 4.3.2. Market size and forecast, by region
- 4.3.3. Market share analysis by country
- 4.4. Polybutylene Succinate (PBS)
- 4.4.1. Key market trends, growth factors and opportunities
- 4.4.2. Market size and forecast, by region
- 4.4.3. Market share analysis by country
- 4.5. Polyhydroxyalkanoates (PHA)
- 4.5.1. Key market trends, growth factors and opportunities
- 4.5.2. Market size and forecast, by region
- 4.5.3. Market share analysis by country
- 4.6. Starch Blends
- 4.6.1. Key market trends, growth factors and opportunities
- 4.6.2. Market size and forecast, by region
- 4.6.3. Market share analysis by country
- 4.7. Others
- 4.7.1. Key market trends, growth factors and opportunities
- 4.7.2. Market size and forecast, by region
- 4.7.3. Market share analysis by country
CHAPTER 5: BIODEGRADABLE PLASTICS MARKET, BY APPLICATION
- 5.1. Overview
- 5.1.1. Market size and forecast
- 5.2. Packaging
- 5.2.1. Key market trends, growth factors and opportunities
- 5.2.2. Market size and forecast, by region
- 5.2.3. Market share analysis by country
- 5.3. Agriculture
- 5.3.1. Key market trends, growth factors and opportunities
- 5.3.2. Market size and forecast, by region
- 5.3.3. Market share analysis by country
- 5.4. Consumer Durable
- 5.4.1. Key market trends, growth factors and opportunities
- 5.4.2. Market size and forecast, by region
- 5.4.3. Market share analysis by country
- 5.5. Textile
- 5.5.1. Key market trends, growth factors and opportunities
- 5.5.2. Market size and forecast, by region
- 5.5.3. Market share analysis by country
- 5.6. Others
- 5.6.1. Key market trends, growth factors and opportunities
- 5.6.2. Market size and forecast, by region
- 5.6.3. Market share analysis by country
CHAPTER 6: BIODEGRADABLE PLASTICS MARKET, BY REGION
- 6.1. Overview
- 6.1.1. Market size and forecast By Region
- 6.2. North America
- 6.2.1. Key market trends, growth factors and opportunities
- 6.2.2. Market size and forecast, by Type
- 6.2.3. Market size and forecast, by Application
- 6.2.4. Market size and forecast, by country
- 6.2.4.1. U.S.
- 6.2.4.1.1. Market size and forecast, by Type
- 6.2.4.1.2. Market size and forecast, by Application
- 6.2.4.2. Canada
- 6.2.4.2.1. Market size and forecast, by Type
- 6.2.4.2.2. Market size and forecast, by Application
- 6.2.4.3. Mexico
- 6.2.4.3.1. Market size and forecast, by Type
- 6.2.4.3.2. Market size and forecast, by Application
- 6.3. Europe
- 6.3.1. Key market trends, growth factors and opportunities
- 6.3.2. Market size and forecast, by Type
- 6.3.3. Market size and forecast, by Application
- 6.3.4. Market size and forecast, by country
- 6.3.4.1. Germany
- 6.3.4.1.1. Market size and forecast, by Type
- 6.3.4.1.2. Market size and forecast, by Application
- 6.3.4.2. UK
- 6.3.4.2.1. Market size and forecast, by Type
- 6.3.4.2.2. Market size and forecast, by Application
- 6.3.4.3. France
- 6.3.4.3.1. Market size and forecast, by Type
- 6.3.4.3.2. Market size and forecast, by Application
- 6.3.4.4. Spain
- 6.3.4.4.1. Market size and forecast, by Type
- 6.3.4.4.2. Market size and forecast, by Application
- 6.3.4.5. Italy
- 6.3.4.5.1. Market size and forecast, by Type
- 6.3.4.5.2. Market size and forecast, by Application
- 6.3.4.6. Rest of Europe
- 6.3.4.6.1. Market size and forecast, by Type
- 6.3.4.6.2. Market size and forecast, by Application
- 6.4. Asia-Pacific
- 6.4.1. Key market trends, growth factors and opportunities
- 6.4.2. Market size and forecast, by Type
- 6.4.3. Market size and forecast, by Application
- 6.4.4. Market size and forecast, by country
- 6.4.4.1. China
- 6.4.4.1.1. Market size and forecast, by Type
- 6.4.4.1.2. Market size and forecast, by Application
- 6.4.4.2. India
- 6.4.4.2.1. Market size and forecast, by Type
- 6.4.4.2.2. Market size and forecast, by Application
- 6.4.4.3. Japan
- 6.4.4.3.1. Market size and forecast, by Type
- 6.4.4.3.2. Market size and forecast, by Application
- 6.4.4.4. South Korea
- 6.4.4.4.1. Market size and forecast, by Type
- 6.4.4.4.2. Market size and forecast, by Application
- 6.4.4.5. Australia
- 6.4.4.5.1. Market size and forecast, by Type
- 6.4.4.5.2. Market size and forecast, by Application
- 6.4.4.6. Rest of Asia-Pacific
- 6.4.4.6.1. Market size and forecast, by Type
- 6.4.4.6.2. Market size and forecast, by Application
- 6.5. LAMEA
- 6.5.1. Key market trends, growth factors and opportunities
- 6.5.2. Market size and forecast, by Type
- 6.5.3. Market size and forecast, by Application
- 6.5.4. Market size and forecast, by country
- 6.5.4.1. Brazil
- 6.5.4.1.1. Market size and forecast, by Type
- 6.5.4.1.2. Market size and forecast, by Application
- 6.5.4.2. Saudi Arabia
- 6.5.4.2.1. Market size and forecast, by Type
- 6.5.4.2.2. Market size and forecast, by Application
- 6.5.4.3. South Africa
- 6.5.4.3.1. Market size and forecast, by Type
- 6.5.4.3.2. Market size and forecast, by Application
- 6.5.4.4. Rest of LAMEA
- 6.5.4.4.1. Market size and forecast, by Type
- 6.5.4.4.2. Market size and forecast, by Application
CHAPTER 7: COMPETITIVE LANDSCAPE
- 7.1. Introduction
- 7.2. Top winning strategies
- 7.3. Product mapping of top 10 player
- 7.4. Competitive dashboard
- 7.5. Competitive heatmap
- 7.6. Top player positioning, 2023
CHAPTER 8: COMPANY PROFILES
- 8.1. BASF SE
- 8.1.1. Company overview
- 8.1.2. Key executives
- 8.1.3. Company snapshot
- 8.1.4. Operating business segments
- 8.1.5. Product portfolio
- 8.1.6. Business performance
- 8.1.7. Key strategic moves and developments
- 8.2. NatureWorks LLC.
- 8.2.1. Company overview
- 8.2.2. Key executives
- 8.2.3. Company snapshot
- 8.2.4. Operating business segments
- 8.2.5. Product portfolio
- 8.2.6. Business performance
- 8.2.7. Key strategic moves and developments
- 8.3. Total Corbion
- 8.3.1. Company overview
- 8.3.2. Key executives
- 8.3.3. Company snapshot
- 8.3.4. Operating business segments
- 8.3.5. Product portfolio
- 8.3.6. Business performance
- 8.3.7. Key strategic moves and developments
- 8.4. Novamont
- 8.4.1. Company overview
- 8.4.2. Key executives
- 8.4.3. Company snapshot
- 8.4.4. Operating business segments
- 8.4.5. Product portfolio
- 8.4.6. Business performance
- 8.4.7. Key strategic moves and developments
- 8.5. Biome Bioplastics
- 8.5.1. Company overview
- 8.5.2. Key executives
- 8.5.3. Company snapshot
- 8.5.4. Operating business segments
- 8.5.5. Product portfolio
- 8.5.6. Business performance
- 8.5.7. Key strategic moves and developments
- 8.6. Mitsubishi Chemical Holding Corporation
- 8.6.1. Company overview
- 8.6.2. Key executives
- 8.6.3. Company snapshot
- 8.6.4. Operating business segments
- 8.6.5. Product portfolio
- 8.6.6. Business performance
- 8.6.7. Key strategic moves and developments
- 8.7. TORAY INDUSTRIES, INC.
- 8.7.1. Company overview
- 8.7.2. Key executives
- 8.7.3. Company snapshot
- 8.7.4. Operating business segments
- 8.7.5. Product portfolio
- 8.7.6. Business performance
- 8.7.7. Key strategic moves and developments
- 8.8. Plantic Technologies Ltd.
- 8.8.1. Company overview
- 8.8.2. Key executives
- 8.8.3. Company snapshot
- 8.8.4. Operating business segments
- 8.8.5. Product portfolio
- 8.8.6. Business performance
- 8.8.7. Key strategic moves and developments
- 8.9. DaniMer Scientific, LLC
- 8.9.1. Company overview
- 8.9.2. Key executives
- 8.9.3. Company snapshot
- 8.9.4. Operating business segments
- 8.9.5. Product portfolio
- 8.9.6. Business performance
- 8.9.7. Key strategic moves and developments
- 8.10. Fkur Kunstsoff
- 8.10.1. Company overview
- 8.10.2. Key executives
- 8.10.3. Company snapshot
- 8.10.4. Operating business segments
- 8.10.5. Product portfolio
- 8.10.6. Business performance
- 8.10.7. Key strategic moves and developments
