
|
市場調査レポート
商品コード
1513344
業務用冷蔵庫市場:製品タイプ別、エンドユーザー別:世界の機会分析と産業予測、2024年~2035年Commercial Refrigeration Market By Product Type, By End User : Global Opportunity Analysis and Industry Forecast, 2024-2035 |
||||||
|
|||||||

価格
| 業務用冷蔵庫市場:製品タイプ別、エンドユーザー別:世界の機会分析と産業予測、2024年~2035年 |
|
出版日: 2024年04月01日
発行: Allied Market Research
ページ情報: 英文 250 Pages
納期: 2~3営業日
|

- 全表示
- 概要
- 図表
- 目次
概要
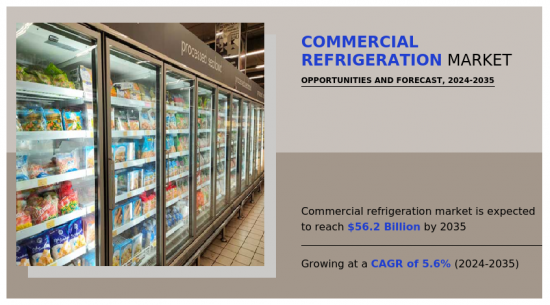
世界の業務用冷蔵庫市場は、2023年には295億7,280万米ドルと評価され、2024年から2035年までのCAGRは5.6%を記録し、2035年には562億1,230万米ドルに達すると予測されています。
 業務用冷蔵庫器は、野菜、果物、肉、その他同様の製品を保存するために使用され、温度を30℃~-40℃に維持することで、製品の保存性を高める。さらに、一部の冷蔵庫器は、高温の食品の温度を90℃前後から30℃まで短時間で下げ、細菌の増殖を抑制するよう特別に設計されています。業務用冷蔵庫器の需要増加は、ライフスタイルの変化や急速な都市化により、消費者の冷凍・冷蔵製品に対するニーズが高まっていることに起因しています。さらに、ハイパーマーケットやスーパーマーケットの増加など、組織化された小売セクターの急速な成長は、業務用冷蔵庫の全体的な売上高を押し上げ、それによって市場の成長を増強します。イノベーションと持続可能性は、将来の業務用冷蔵分野で主要な役割を果たすと予想されます。天然ガスや低GWP代替品など、環境に優しい冷媒の使用は、厳しい環境要件に準拠するために予想される開発の1つです。スマート冷凍システムにおける予測分析とモノのインターネット(IoT)センサーは、エネルギー使用を最適化し、食品の安全性を向上させ、運用コストを節約します。冷蔵輸送ソリューションに対するニーズの高まりは、世界の食品取引と医薬品流通がコールドチェーン・ロジスティクスの需要を促進していると予想されます。さらに、鮮度と持続可能性に対する消費者の期待が変化するにつれて、冷蔵技術の進歩は食品廃棄物の削減、製品品質の向上、賞味期限の延長に集中すると予想されます。しかし、頻繁なメンテナンスの必要性と、適切なメンテナンスの欠如によって生じる潜在的な技術的問題が、世界の商業用冷蔵市場の主な抑制要因として作用します。逆に、自動化の動向の上昇や新興国におけるクイックサービスレストランの急増と相まって、人工知能の統合といった業務用冷蔵庫の進歩は、予測期間中に世界市場の拡大に有益な機会を提供すると期待されています。世界の業務用冷蔵庫市場は、製品、エンドユーザー、地域に区分されます。製品タイプによって、市場はディープフリーザー、ボトルクーラー、ストレージウォータークーラー、業務用キッチン冷蔵、医療用冷蔵、チェスト冷蔵、その他に分類されます。エンドユーザー別では、フルサービスレストラン&ホテル、食品加工業、病院、小売薬局、スーパーマーケット/ハイパーマーケット、コンビニエンスストア、クイックサービスレストラン、その他に細分化されます。その他には、ケータリングサービス、施設向けケータリング、イベントサービス、ベーカリー、バー&パブが含まれます。地域別に見ると、市場は北米、欧州、アジア太平洋、LAMEAにわたって分析されています。世界の商業用冷蔵機器市場の有力企業は、市場における足場を強化するための主要戦略として、戦略的に買収に注力しています。市場で事業を展開している主要企業には、United Technologies Corporation、Daikin Industries Ltd.、Illinois Tool Works Inc.(ITW)、Johnson Controls International Plc、Dover Corporation、AB Electrolux、Panasonic Corporation、Ali Group S.r.l.、Frigoglass S.A.I.C.、Haier Electronics Group Co., Ltdなどがあります。
- 当レポートでは、2023年から2035年までの業務用冷蔵庫市場分析の市場セグメント、現在の動向、推定・動向分析、ダイナミクスを定量的に分析し、一般的な業務用冷蔵庫市場の機会を特定します。
- 市場促進要因、市場抑制要因、市場機会に関連する情報とともに市場調査を提供します。
- ポーターのファイブフォース分析では、利害関係者が利益重視のビジネス決定を下し、サプライヤーとバイヤーのネットワークを強化できるように、バイヤーとサプライヤーの潜在力を強調します。
- 業務用冷蔵庫市場のセグメンテーションを詳細に分析することで、市場機会を見極めることができます。
- 各地域の主要国は、世界市場への収益貢献度に応じてマッピングされています。
- 市場プレイヤーのポジショニングはベンチマーキングを容易にし、市場プレイヤーの現在のポジションを明確に理解することができます。
- 本レポートには、地域および世界の業務用冷蔵庫市場動向、主要企業、市場セグメント、応用分野、市場成長戦略の分析が含まれています。
目次
第1章 イントロダクション
第2章 エグゼクティブサマリー
第3章 市場概要
- 市場の定義と範囲
- 主な調査結果
- 影響要因
- 主な投資機会
- ポーターのファイブフォース分析
- 市場力学
- 促進要因
- 抑制要因
- 機会
第4章 業務用冷蔵庫市場:製品タイプ別
- 概要
- ディープフリーザー
- ボトルクーラー
- 貯水式ウォータークーラー
- 業務用厨房冷蔵庫
- 医療用冷凍庫
- チェスト冷凍
- その他
第5章 業務用冷蔵庫市場:エンドユーザー別
- 概要
- フルサービスレストランおよびホテル
- 食品加工産業
- 病院
- 小売薬局
- スーパーマーケットとハイパーマーケット
- コンビニエンスストア
- クイックサービスレストラン
- その他
第6章 業務用冷蔵庫市場:地域別
- 概要
- 北米
- 米国
- カナダ
- メキシコ
- 欧州
- ドイツ
- フランス
- 英国
- イタリア
- スペイン
- その他
- アジア太平洋
- 中国
- インド
- 日本
- オーストラリア
- その他
- ラテンアメリカ・中東・アフリカ
- ブラジル
- UAE
- サウジアラビア
- その他
第7章 競合情勢
- イントロダクション
- 主要成功戦略
- 主要10社の製品マッピング
- 競合ダッシュボード
- 競合ヒートマップ
- 主要企業のポジショニング、2023年
第8章 企業プロファイル
- AB Electrolux
- ALI GROUP S.R.L.
- DAIKIN INDUSTRIES LTD.
- Dover Corporation
- FRIGOGLASS S.A.I.C.
- HAIER ELECTRONICS GROUP CO., LTD.
- Illinois Tool Works Inc.
- Johnson Controls International PLC
- Panasonic Corporation
- United Technologies Corporation
図表
LIST OF TABLES
- TABLE 01. GLOBAL COMMERCIAL REFRIGERATION MARKET, BY PRODUCT TYPE, 2023-2035 ($MILLION)
- TABLE 02. COMMERCIAL REFRIGERATION MARKET FOR DEEP FREEZERS, BY REGION, 2023-2035 ($MILLION)
- TABLE 03. COMMERCIAL REFRIGERATION MARKET FOR BOTTLE COOLERS, BY REGION, 2023-2035 ($MILLION)
- TABLE 04. COMMERCIAL REFRIGERATION MARKET FOR STORAGE WATER COOLERS, BY REGION, 2023-2035 ($MILLION)
- TABLE 05. COMMERCIAL REFRIGERATION MARKET FOR COMMERCIAL KITCHEN REFRIGERATION, BY REGION, 2023-2035 ($MILLION)
- TABLE 06. COMMERCIAL REFRIGERATION MARKET FOR MEDICAL REFRIGERATION, BY REGION, 2023-2035 ($MILLION)
- TABLE 07. COMMERCIAL REFRIGERATION MARKET FOR CHEST REFRIGERATION, BY REGION, 2023-2035 ($MILLION)
- TABLE 08. COMMERCIAL REFRIGERATION MARKET FOR OTHERS, BY REGION, 2023-2035 ($MILLION)
- TABLE 09. GLOBAL COMMERCIAL REFRIGERATION MARKET, BY END USER, 2023-2035 ($MILLION)
- TABLE 10. COMMERCIAL REFRIGERATION MARKET FOR FULL SERVICE RESTAURANT AND HOTELS, BY REGION, 2023-2035 ($MILLION)
- TABLE 11. COMMERCIAL REFRIGERATION MARKET FOR FOOD PROCESSING INDUSTRY, BY REGION, 2023-2035 ($MILLION)
- TABLE 12. COMMERCIAL REFRIGERATION MARKET FOR HOSPITALS, BY REGION, 2023-2035 ($MILLION)
- TABLE 13. COMMERCIAL REFRIGERATION MARKET FOR RETAIL PHARMACIES, BY REGION, 2023-2035 ($MILLION)
- TABLE 14. COMMERCIAL REFRIGERATION MARKET FOR SUPERMARKET AND HYPERMARKET, BY REGION, 2023-2035 ($MILLION)
- TABLE 15. COMMERCIAL REFRIGERATION MARKET FOR CONVENIENCE STORES, BY REGION, 2023-2035 ($MILLION)
- TABLE 16. COMMERCIAL REFRIGERATION MARKET FOR QUICK SERVICE RESTAURANTS, BY REGION, 2023-2035 ($MILLION)
- TABLE 17. COMMERCIAL REFRIGERATION MARKET FOR OTHERS, BY REGION, 2023-2035 ($MILLION)
- TABLE 18. COMMERCIAL REFRIGERATION MARKET, BY REGION, 2023-2035 ($MILLION)
- TABLE 19. NORTH AMERICA COMMERCIAL REFRIGERATION MARKET, BY PRODUCT TYPE, 2023-2035 ($MILLION)
- TABLE 20. NORTH AMERICA COMMERCIAL REFRIGERATION MARKET, BY END USER, 2023-2035 ($MILLION)
- TABLE 21. NORTH AMERICA COMMERCIAL REFRIGERATION MARKET, BY COUNTRY, 2023-2035 ($MILLION)
- TABLE 22. U.S. COMMERCIAL REFRIGERATION MARKET, BY PRODUCT TYPE, 2023-2035 ($MILLION)
- TABLE 23. U.S. COMMERCIAL REFRIGERATION MARKET, BY END USER, 2023-2035 ($MILLION)
- TABLE 24. CANADA COMMERCIAL REFRIGERATION MARKET, BY PRODUCT TYPE, 2023-2035 ($MILLION)
- TABLE 25. CANADA COMMERCIAL REFRIGERATION MARKET, BY END USER, 2023-2035 ($MILLION)
- TABLE 26. MEXICO COMMERCIAL REFRIGERATION MARKET, BY PRODUCT TYPE, 2023-2035 ($MILLION)
- TABLE 27. MEXICO COMMERCIAL REFRIGERATION MARKET, BY END USER, 2023-2035 ($MILLION)
- TABLE 28. EUROPE COMMERCIAL REFRIGERATION MARKET, BY PRODUCT TYPE, 2023-2035 ($MILLION)
- TABLE 29. EUROPE COMMERCIAL REFRIGERATION MARKET, BY END USER, 2023-2035 ($MILLION)
- TABLE 30. EUROPE COMMERCIAL REFRIGERATION MARKET, BY COUNTRY, 2023-2035 ($MILLION)
- TABLE 31. GERMANY COMMERCIAL REFRIGERATION MARKET, BY PRODUCT TYPE, 2023-2035 ($MILLION)
- TABLE 32. GERMANY COMMERCIAL REFRIGERATION MARKET, BY END USER, 2023-2035 ($MILLION)
- TABLE 33. FRANCE COMMERCIAL REFRIGERATION MARKET, BY PRODUCT TYPE, 2023-2035 ($MILLION)
- TABLE 34. FRANCE COMMERCIAL REFRIGERATION MARKET, BY END USER, 2023-2035 ($MILLION)
- TABLE 35. UK COMMERCIAL REFRIGERATION MARKET, BY PRODUCT TYPE, 2023-2035 ($MILLION)
- TABLE 36. UK COMMERCIAL REFRIGERATION MARKET, BY END USER, 2023-2035 ($MILLION)
- TABLE 37. ITALY COMMERCIAL REFRIGERATION MARKET, BY PRODUCT TYPE, 2023-2035 ($MILLION)
- TABLE 38. ITALY COMMERCIAL REFRIGERATION MARKET, BY END USER, 2023-2035 ($MILLION)
- TABLE 39. SPAIN COMMERCIAL REFRIGERATION MARKET, BY PRODUCT TYPE, 2023-2035 ($MILLION)
- TABLE 40. SPAIN COMMERCIAL REFRIGERATION MARKET, BY END USER, 2023-2035 ($MILLION)
- TABLE 41. REST OF EUROPE COMMERCIAL REFRIGERATION MARKET, BY PRODUCT TYPE, 2023-2035 ($MILLION)
- TABLE 42. REST OF EUROPE COMMERCIAL REFRIGERATION MARKET, BY END USER, 2023-2035 ($MILLION)
- TABLE 43. ASIA-PACIFIC COMMERCIAL REFRIGERATION MARKET, BY PRODUCT TYPE, 2023-2035 ($MILLION)
- TABLE 44. ASIA-PACIFIC COMMERCIAL REFRIGERATION MARKET, BY END USER, 2023-2035 ($MILLION)
- TABLE 45. ASIA-PACIFIC COMMERCIAL REFRIGERATION MARKET, BY COUNTRY, 2023-2035 ($MILLION)
- TABLE 46. CHINA COMMERCIAL REFRIGERATION MARKET, BY PRODUCT TYPE, 2023-2035 ($MILLION)
- TABLE 47. CHINA COMMERCIAL REFRIGERATION MARKET, BY END USER, 2023-2035 ($MILLION)
- TABLE 48. INDIA COMMERCIAL REFRIGERATION MARKET, BY PRODUCT TYPE, 2023-2035 ($MILLION)
- TABLE 49. INDIA COMMERCIAL REFRIGERATION MARKET, BY END USER, 2023-2035 ($MILLION)
- TABLE 50. JAPAN COMMERCIAL REFRIGERATION MARKET, BY PRODUCT TYPE, 2023-2035 ($MILLION)
- TABLE 51. JAPAN COMMERCIAL REFRIGERATION MARKET, BY END USER, 2023-2035 ($MILLION)
- TABLE 52. AUSTRALIA COMMERCIAL REFRIGERATION MARKET, BY PRODUCT TYPE, 2023-2035 ($MILLION)
- TABLE 53. AUSTRALIA COMMERCIAL REFRIGERATION MARKET, BY END USER, 2023-2035 ($MILLION)
- TABLE 54. REST OF ASIA-PACIFIC COMMERCIAL REFRIGERATION MARKET, BY PRODUCT TYPE, 2023-2035 ($MILLION)
- TABLE 55. REST OF ASIA-PACIFIC COMMERCIAL REFRIGERATION MARKET, BY END USER, 2023-2035 ($MILLION)
- TABLE 56. LAMEA COMMERCIAL REFRIGERATION MARKET, BY PRODUCT TYPE, 2023-2035 ($MILLION)
- TABLE 57. LAMEA COMMERCIAL REFRIGERATION MARKET, BY END USER, 2023-2035 ($MILLION)
- TABLE 58. LAMEA COMMERCIAL REFRIGERATION MARKET, BY COUNTRY, 2023-2035 ($MILLION)
- TABLE 59. BRAZIL COMMERCIAL REFRIGERATION MARKET, BY PRODUCT TYPE, 2023-2035 ($MILLION)
- TABLE 60. BRAZIL COMMERCIAL REFRIGERATION MARKET, BY END USER, 2023-2035 ($MILLION)
- TABLE 61. UAE COMMERCIAL REFRIGERATION MARKET, BY PRODUCT TYPE, 2023-2035 ($MILLION)
- TABLE 62. UAE COMMERCIAL REFRIGERATION MARKET, BY END USER, 2023-2035 ($MILLION)
- TABLE 63. SAUDI ARABIA COMMERCIAL REFRIGERATION MARKET, BY PRODUCT TYPE, 2023-2035 ($MILLION)
- TABLE 64. SAUDI ARABIA COMMERCIAL REFRIGERATION MARKET, BY END USER, 2023-2035 ($MILLION)
- TABLE 65. REST OF LAMEA COMMERCIAL REFRIGERATION MARKET, BY PRODUCT TYPE, 2023-2035 ($MILLION)
- TABLE 66. REST OF LAMEA COMMERCIAL REFRIGERATION MARKET, BY END USER, 2023-2035 ($MILLION)
- TABLE 67. AB ELECTROLUX: KEY EXECUTIVES
- TABLE 68. AB ELECTROLUX: COMPANY SNAPSHOT
- TABLE 69. AB ELECTROLUX: PRODUCT SEGMENTS
- TABLE 70. AB ELECTROLUX: SERVICE SEGMENTS
- TABLE 71. AB ELECTROLUX: PRODUCT PORTFOLIO
- TABLE 72. AB ELECTROLUX: KEY STRATEGIES
- TABLE 73. ALI GROUP S.R.L.: KEY EXECUTIVES
- TABLE 74. ALI GROUP S.R.L.: COMPANY SNAPSHOT
- TABLE 75. ALI GROUP S.R.L.: PRODUCT SEGMENTS
- TABLE 76. ALI GROUP S.R.L.: SERVICE SEGMENTS
- TABLE 77. ALI GROUP S.R.L.: PRODUCT PORTFOLIO
- TABLE 78. ALI GROUP S.R.L.: KEY STRATEGIES
- TABLE 79. DAIKIN INDUSTRIES LTD.: KEY EXECUTIVES
- TABLE 80. DAIKIN INDUSTRIES LTD.: COMPANY SNAPSHOT
- TABLE 81. DAIKIN INDUSTRIES LTD.: PRODUCT SEGMENTS
- TABLE 82. DAIKIN INDUSTRIES LTD.: SERVICE SEGMENTS
- TABLE 83. DAIKIN INDUSTRIES LTD.: PRODUCT PORTFOLIO
- TABLE 84. DAIKIN INDUSTRIES LTD.: KEY STRATEGIES
- TABLE 85. DOVER CORPORATION: KEY EXECUTIVES
- TABLE 86. DOVER CORPORATION: COMPANY SNAPSHOT
- TABLE 87. DOVER CORPORATION: PRODUCT SEGMENTS
- TABLE 88. DOVER CORPORATION: SERVICE SEGMENTS
- TABLE 89. DOVER CORPORATION: PRODUCT PORTFOLIO
- TABLE 90. DOVER CORPORATION: KEY STRATEGIES
- TABLE 91. FRIGOGLASS S.A.I.C.: KEY EXECUTIVES
- TABLE 92. FRIGOGLASS S.A.I.C.: COMPANY SNAPSHOT
- TABLE 93. FRIGOGLASS S.A.I.C.: PRODUCT SEGMENTS
- TABLE 94. FRIGOGLASS S.A.I.C.: SERVICE SEGMENTS
- TABLE 95. FRIGOGLASS S.A.I.C.: PRODUCT PORTFOLIO
- TABLE 96. FRIGOGLASS S.A.I.C.: KEY STRATEGIES
- TABLE 97. HAIER ELECTRONICS GROUP CO., LTD.: KEY EXECUTIVES
- TABLE 98. HAIER ELECTRONICS GROUP CO., LTD.: COMPANY SNAPSHOT
- TABLE 99. HAIER ELECTRONICS GROUP CO., LTD.: PRODUCT SEGMENTS
- TABLE 100. HAIER ELECTRONICS GROUP CO., LTD.: SERVICE SEGMENTS
- TABLE 101. HAIER ELECTRONICS GROUP CO., LTD.: PRODUCT PORTFOLIO
- TABLE 102. HAIER ELECTRONICS GROUP CO., LTD.: KEY STRATEGIES
- TABLE 103. ILLINOIS TOOL WORKS INC.: KEY EXECUTIVES
- TABLE 104. ILLINOIS TOOL WORKS INC.: COMPANY SNAPSHOT
- TABLE 105. ILLINOIS TOOL WORKS INC.: PRODUCT SEGMENTS
- TABLE 106. ILLINOIS TOOL WORKS INC.: SERVICE SEGMENTS
- TABLE 107. ILLINOIS TOOL WORKS INC.: PRODUCT PORTFOLIO
- TABLE 108. ILLINOIS TOOL WORKS INC.: KEY STRATEGIES
- TABLE 109. JOHNSON CONTROLS INTERNATIONAL PLC: KEY EXECUTIVES
- TABLE 110. JOHNSON CONTROLS INTERNATIONAL PLC: COMPANY SNAPSHOT
- TABLE 111. JOHNSON CONTROLS INTERNATIONAL PLC: PRODUCT SEGMENTS
- TABLE 112. JOHNSON CONTROLS INTERNATIONAL PLC: SERVICE SEGMENTS
- TABLE 113. JOHNSON CONTROLS INTERNATIONAL PLC: PRODUCT PORTFOLIO
- TABLE 114. JOHNSON CONTROLS INTERNATIONAL PLC: KEY STRATEGIES
- TABLE 115. PANASONIC CORPORATION: KEY EXECUTIVES
- TABLE 116. PANASONIC CORPORATION: COMPANY SNAPSHOT
- TABLE 117. PANASONIC CORPORATION: PRODUCT SEGMENTS
- TABLE 118. PANASONIC CORPORATION: SERVICE SEGMENTS
- TABLE 119. PANASONIC CORPORATION: PRODUCT PORTFOLIO
- TABLE 120. PANASONIC CORPORATION: KEY STRATEGIES
- TABLE 121. UNITED TECHNOLOGIES CORPORATION: KEY EXECUTIVES
- TABLE 122. UNITED TECHNOLOGIES CORPORATION: COMPANY SNAPSHOT
- TABLE 123. UNITED TECHNOLOGIES CORPORATION: PRODUCT SEGMENTS
- TABLE 124. UNITED TECHNOLOGIES CORPORATION: SERVICE SEGMENTS
- TABLE 125. UNITED TECHNOLOGIES CORPORATION: PRODUCT PORTFOLIO
- TABLE 126. UNITED TECHNOLOGIES CORPORATION: KEY STRATEGIES
LIST OF FIGURES
- FIGURE 01. COMMERCIAL REFRIGERATION MARKET, 2023-2035
- FIGURE 02. SEGMENTATION OF COMMERCIAL REFRIGERATION MARKET,2023-2035
- FIGURE 03. TOP IMPACTING FACTORS IN COMMERCIAL REFRIGERATION MARKET
- FIGURE 04. TOP INVESTMENT POCKETS IN COMMERCIAL REFRIGERATION MARKET (2024-2035)
- FIGURE 05. BARGAINING POWER OF SUPPLIERS
- FIGURE 06. BARGAINING POWER OF BUYERS
- FIGURE 07. THREAT OF SUBSTITUTION
- FIGURE 08. THREAT OF SUBSTITUTION
- FIGURE 09. COMPETITIVE RIVALRY
- FIGURE 10. GLOBAL COMMERCIAL REFRIGERATION MARKET:DRIVERS, RESTRAINTS AND OPPORTUNITIES
- FIGURE 11. COMMERCIAL REFRIGERATION MARKET, BY PRODUCT TYPE, 2023 AND 2035(%)
- FIGURE 12. COMPARATIVE SHARE ANALYSIS OF COMMERCIAL REFRIGERATION MARKET FOR DEEP FREEZERS, BY COUNTRY 2023 AND 2035(%)
- FIGURE 13. COMPARATIVE SHARE ANALYSIS OF COMMERCIAL REFRIGERATION MARKET FOR BOTTLE COOLERS, BY COUNTRY 2023 AND 2035(%)
- FIGURE 14. COMPARATIVE SHARE ANALYSIS OF COMMERCIAL REFRIGERATION MARKET FOR STORAGE WATER COOLERS, BY COUNTRY 2023 AND 2035(%)
- FIGURE 15. COMPARATIVE SHARE ANALYSIS OF COMMERCIAL REFRIGERATION MARKET FOR COMMERCIAL KITCHEN REFRIGERATION, BY COUNTRY 2023 AND 2035(%)
- FIGURE 16. COMPARATIVE SHARE ANALYSIS OF COMMERCIAL REFRIGERATION MARKET FOR MEDICAL REFRIGERATION, BY COUNTRY 2023 AND 2035(%)
- FIGURE 17. COMPARATIVE SHARE ANALYSIS OF COMMERCIAL REFRIGERATION MARKET FOR CHEST REFRIGERATION, BY COUNTRY 2023 AND 2035(%)
- FIGURE 18. COMPARATIVE SHARE ANALYSIS OF COMMERCIAL REFRIGERATION MARKET FOR OTHERS, BY COUNTRY 2023 AND 2035(%)
- FIGURE 19. COMMERCIAL REFRIGERATION MARKET, BY END USER, 2023 AND 2035(%)
- FIGURE 20. COMPARATIVE SHARE ANALYSIS OF COMMERCIAL REFRIGERATION MARKET FOR FULL SERVICE RESTAURANT AND HOTELS, BY COUNTRY 2023 AND 2035(%)
- FIGURE 21. COMPARATIVE SHARE ANALYSIS OF COMMERCIAL REFRIGERATION MARKET FOR FOOD PROCESSING INDUSTRY, BY COUNTRY 2023 AND 2035(%)
- FIGURE 22. COMPARATIVE SHARE ANALYSIS OF COMMERCIAL REFRIGERATION MARKET FOR HOSPITALS, BY COUNTRY 2023 AND 2035(%)
- FIGURE 23. COMPARATIVE SHARE ANALYSIS OF COMMERCIAL REFRIGERATION MARKET FOR RETAIL PHARMACIES, BY COUNTRY 2023 AND 2035(%)
- FIGURE 24. COMPARATIVE SHARE ANALYSIS OF COMMERCIAL REFRIGERATION MARKET FOR SUPERMARKET AND HYPERMARKET, BY COUNTRY 2023 AND 2035(%)
- FIGURE 25. COMPARATIVE SHARE ANALYSIS OF COMMERCIAL REFRIGERATION MARKET FOR CONVENIENCE STORES, BY COUNTRY 2023 AND 2035(%)
- FIGURE 26. COMPARATIVE SHARE ANALYSIS OF COMMERCIAL REFRIGERATION MARKET FOR QUICK SERVICE RESTAURANTS, BY COUNTRY 2023 AND 2035(%)
- FIGURE 27. COMPARATIVE SHARE ANALYSIS OF COMMERCIAL REFRIGERATION MARKET FOR OTHERS, BY COUNTRY 2023 AND 2035(%)
- FIGURE 28. COMMERCIAL REFRIGERATION MARKET BY REGION, 2023 AND 2035(%)
- FIGURE 29. U.S. COMMERCIAL REFRIGERATION MARKET, 2023-2035 ($MILLION)
- FIGURE 30. CANADA COMMERCIAL REFRIGERATION MARKET, 2023-2035 ($MILLION)
- FIGURE 31. MEXICO COMMERCIAL REFRIGERATION MARKET, 2023-2035 ($MILLION)
- FIGURE 32. GERMANY COMMERCIAL REFRIGERATION MARKET, 2023-2035 ($MILLION)
- FIGURE 33. FRANCE COMMERCIAL REFRIGERATION MARKET, 2023-2035 ($MILLION)
- FIGURE 34. UK COMMERCIAL REFRIGERATION MARKET, 2023-2035 ($MILLION)
- FIGURE 35. ITALY COMMERCIAL REFRIGERATION MARKET, 2023-2035 ($MILLION)
- FIGURE 36. SPAIN COMMERCIAL REFRIGERATION MARKET, 2023-2035 ($MILLION)
- FIGURE 37. REST OF EUROPE COMMERCIAL REFRIGERATION MARKET, 2023-2035 ($MILLION)
- FIGURE 38. CHINA COMMERCIAL REFRIGERATION MARKET, 2023-2035 ($MILLION)
- FIGURE 39. INDIA COMMERCIAL REFRIGERATION MARKET, 2023-2035 ($MILLION)
- FIGURE 40. JAPAN COMMERCIAL REFRIGERATION MARKET, 2023-2035 ($MILLION)
- FIGURE 41. AUSTRALIA COMMERCIAL REFRIGERATION MARKET, 2023-2035 ($MILLION)
- FIGURE 42. REST OF ASIA-PACIFIC COMMERCIAL REFRIGERATION MARKET, 2023-2035 ($MILLION)
- FIGURE 43. BRAZIL COMMERCIAL REFRIGERATION MARKET, 2023-2035 ($MILLION)
- FIGURE 44. UAE COMMERCIAL REFRIGERATION MARKET, 2023-2035 ($MILLION)
- FIGURE 45. SAUDI ARABIA COMMERCIAL REFRIGERATION MARKET, 2023-2035 ($MILLION)
- FIGURE 46. REST OF LAMEA COMMERCIAL REFRIGERATION MARKET, 2023-2035 ($MILLION)
- FIGURE 47. TOP WINNING STRATEGIES, BY YEAR
- FIGURE 48. TOP WINNING STRATEGIES, BY DEVELOPMENT
- FIGURE 49. TOP WINNING STRATEGIES, BY COMPANY
- FIGURE 50. PRODUCT MAPPING OF TOP 10 PLAYERS
- FIGURE 51. COMPETITIVE DASHBOARD
- FIGURE 52. COMPETITIVE HEATMAP: COMMERCIAL REFRIGERATION MARKET
- FIGURE 53. TOP PLAYER POSITIONING, 2023
目次
Product Code: A05036
The global commercial refrigeration market was valued at $29,572.8 million in 2023, and is projected to reach $56,212.3 million by 2035, registering a CAGR of 5.6% from 2024 to 2035.Key Benefits For Stakeholders
- This report provides a quantitative analysis of the market segments, current trends, estimations, and dynamics of the commercial refrigeration market analysis from 2023 to 2035 to identify the prevailing commercial refrigeration market opportunities.
- The market research is offered along with information related to key drivers, restraints, and opportunities.
- Porter's five forces analysis highlights the potency of buyers and suppliers to enable stakeholders make profit-oriented business decisions and strengthen their supplier-buyer network.
- In-depth analysis of the commercial refrigeration market segmentation assists to determine the prevailing market opportunities.
- Major countries in each region are mapped according to their revenue contribution to the global market.
- Market player positioning facilitates benchmarking and provides a clear understanding of the present position of the market players.
- The report includes the analysis of the regional as well as global commercial refrigeration market trends, key players, market segments, application areas, and market growth strategies.
Additional benefits you will get with this purchase are:
- Quarterly Update and* (only available with a corporate license, on listed price)
- 5 additional Company Profile of client Choice pre- or Post-purchase, as a free update.
- Free Upcoming Version on the Purchase of Five and Enterprise User License.
- 16 analyst hours of support* (post-purchase, if you find additional data requirements upon review of the report, you may receive support amounting to 16 analyst hours to solve questions, and post-sale queries)
- 15% Free Customization* (in case the scope or segment of the report does not match your requirements, 15% is equivalent to 3 working days of free work, applicable once)
- Free data Pack on the Five and Enterprise User License. (Excel version of the report)
- Free Updated report if the report is 6-12 months old or older.
- 24-hour priority response*
- Free Industry updates and white papers.Possible Customization with this report (with additional cost and timeline, please talk to the sales executive to know more)
- Product Benchmarking / Product specification and applications
- Market share analysis of players by products/segments
- New Product Development/ Product Matrix of Key Players
- Additional company profiles with specific to client's interest
- Additional country or region analysis- market size and forecast
- Brands Share Analysis
- Criss-cross segment analysis- market size and forecast
- Expanded list for Company Profiles
- Historic market data
Key Market Segments
By Product Type
- Deep Freezers
- Bottle Coolers
- Storage Water Coolers
- Commercial Kitchen Refrigeration
- Medical Refrigeration
- Chest Refrigeration
- Others
By End User
- Food Processing Industry
- Hospitals
- Retail Pharmacies
- Supermarket and Hypermarket
- Convenience Stores
- Quick Service Restaurants
- Others
- Full Service Restaurant and Hotels
By Region
- North America
- U.S.
- Canada
- Mexico
- Europe
- Germany
- France
- UK
- Italy
- Spain
- Rest of Europe
- Asia-Pacific
- China
- India
- Japan
- Australia
- Rest of Asia-Pacific
- LAMEA
- Brazil
- UAE
- Saudi Arabia
- Rest of LAMEA
Key Market Players:
- AB Electrolux
- ALI GROUP S.R.L.
- DAIKIN INDUSTRIES LTD.
- Dover Corporation
- FRIGOGLASS S.A.I.C.
- HAIER ELECTRONICS GROUP CO., LTD.
- Illinois Tool Works Inc.
- Johnson Controls International PLC
- Panasonic Corporation
- United Technologies Corporation
TABLE OF CONTENTS
CHAPTER 1: INTRODUCTION
- 1.1. Report description
- 1.2. Key market segments
- 1.3. Key benefits to the stakeholders
- 1.4. Research methodology
- 1.4.1. Primary research
- 1.4.2. Secondary research
- 1.4.3. Analyst tools and models
CHAPTER 2: EXECUTIVE SUMMARY
- 2.1. CXO perspective
CHAPTER 3: MARKET OVERVIEW
- 3.1. Market definition and scope
- 3.2. Key findings
- 3.2.1. Top impacting factors
- 3.2.2. Top investment pockets
- 3.3. Porter's five forces analysis
- 3.4. Market dynamics
- 3.4.1. Drivers
- 3.4.2. Restraints
- 3.4.3. Opportunities
CHAPTER 4: COMMERCIAL REFRIGERATION MARKET, BY PRODUCT TYPE
- 4.1. Overview
- 4.1.1. Market size and forecast
- 4.2. Deep Freezers
- 4.2.1. Key market trends, growth factors and opportunities
- 4.2.2. Market size and forecast, by region
- 4.2.3. Market share analysis by country
- 4.3. Bottle Coolers
- 4.3.1. Key market trends, growth factors and opportunities
- 4.3.2. Market size and forecast, by region
- 4.3.3. Market share analysis by country
- 4.4. Storage Water Coolers
- 4.4.1. Key market trends, growth factors and opportunities
- 4.4.2. Market size and forecast, by region
- 4.4.3. Market share analysis by country
- 4.5. Commercial Kitchen Refrigeration
- 4.5.1. Key market trends, growth factors and opportunities
- 4.5.2. Market size and forecast, by region
- 4.5.3. Market share analysis by country
- 4.6. Medical Refrigeration
- 4.6.1. Key market trends, growth factors and opportunities
- 4.6.2. Market size and forecast, by region
- 4.6.3. Market share analysis by country
- 4.7. Chest Refrigeration
- 4.7.1. Key market trends, growth factors and opportunities
- 4.7.2. Market size and forecast, by region
- 4.7.3. Market share analysis by country
- 4.8. Others
- 4.8.1. Key market trends, growth factors and opportunities
- 4.8.2. Market size and forecast, by region
- 4.8.3. Market share analysis by country
CHAPTER 5: COMMERCIAL REFRIGERATION MARKET, BY END USER
- 5.1. Overview
- 5.1.1. Market size and forecast
- 5.2. Full Service Restaurant and Hotels
- 5.2.1. Key market trends, growth factors and opportunities
- 5.2.2. Market size and forecast, by region
- 5.2.3. Market share analysis by country
- 5.3. Food Processing Industry
- 5.3.1. Key market trends, growth factors and opportunities
- 5.3.2. Market size and forecast, by region
- 5.3.3. Market share analysis by country
- 5.4. Hospitals
- 5.4.1. Key market trends, growth factors and opportunities
- 5.4.2. Market size and forecast, by region
- 5.4.3. Market share analysis by country
- 5.5. Retail Pharmacies
- 5.5.1. Key market trends, growth factors and opportunities
- 5.5.2. Market size and forecast, by region
- 5.5.3. Market share analysis by country
- 5.6. Supermarket and Hypermarket
- 5.6.1. Key market trends, growth factors and opportunities
- 5.6.2. Market size and forecast, by region
- 5.6.3. Market share analysis by country
- 5.7. Convenience Stores
- 5.7.1. Key market trends, growth factors and opportunities
- 5.7.2. Market size and forecast, by region
- 5.7.3. Market share analysis by country
- 5.8. Quick Service Restaurants
- 5.8.1. Key market trends, growth factors and opportunities
- 5.8.2. Market size and forecast, by region
- 5.8.3. Market share analysis by country
- 5.9. Others
- 5.9.1. Key market trends, growth factors and opportunities
- 5.9.2. Market size and forecast, by region
- 5.9.3. Market share analysis by country
CHAPTER 6: COMMERCIAL REFRIGERATION MARKET, BY REGION
- 6.1. Overview
- 6.1.1. Market size and forecast By Region
- 6.2. North America
- 6.2.1. Key market trends, growth factors and opportunities
- 6.2.2. Market size and forecast, by Product Type
- 6.2.3. Market size and forecast, by End User
- 6.2.4. Market size and forecast, by country
- 6.2.4.1. U.S.
- 6.2.4.1.1. Market size and forecast, by Product Type
- 6.2.4.1.2. Market size and forecast, by End User
- 6.2.4.2. Canada
- 6.2.4.2.1. Market size and forecast, by Product Type
- 6.2.4.2.2. Market size and forecast, by End User
- 6.2.4.3. Mexico
- 6.2.4.3.1. Market size and forecast, by Product Type
- 6.2.4.3.2. Market size and forecast, by End User
- 6.3. Europe
- 6.3.1. Key market trends, growth factors and opportunities
- 6.3.2. Market size and forecast, by Product Type
- 6.3.3. Market size and forecast, by End User
- 6.3.4. Market size and forecast, by country
- 6.3.4.1. Germany
- 6.3.4.1.1. Market size and forecast, by Product Type
- 6.3.4.1.2. Market size and forecast, by End User
- 6.3.4.2. France
- 6.3.4.2.1. Market size and forecast, by Product Type
- 6.3.4.2.2. Market size and forecast, by End User
- 6.3.4.3. UK
- 6.3.4.3.1. Market size and forecast, by Product Type
- 6.3.4.3.2. Market size and forecast, by End User
- 6.3.4.4. Italy
- 6.3.4.4.1. Market size and forecast, by Product Type
- 6.3.4.4.2. Market size and forecast, by End User
- 6.3.4.5. Spain
- 6.3.4.5.1. Market size and forecast, by Product Type
- 6.3.4.5.2. Market size and forecast, by End User
- 6.3.4.6. Rest of Europe
- 6.3.4.6.1. Market size and forecast, by Product Type
- 6.3.4.6.2. Market size and forecast, by End User
- 6.4. Asia-Pacific
- 6.4.1. Key market trends, growth factors and opportunities
- 6.4.2. Market size and forecast, by Product Type
- 6.4.3. Market size and forecast, by End User
- 6.4.4. Market size and forecast, by country
- 6.4.4.1. China
- 6.4.4.1.1. Market size and forecast, by Product Type
- 6.4.4.1.2. Market size and forecast, by End User
- 6.4.4.2. India
- 6.4.4.2.1. Market size and forecast, by Product Type
- 6.4.4.2.2. Market size and forecast, by End User
- 6.4.4.3. Japan
- 6.4.4.3.1. Market size and forecast, by Product Type
- 6.4.4.3.2. Market size and forecast, by End User
- 6.4.4.4. Australia
- 6.4.4.4.1. Market size and forecast, by Product Type
- 6.4.4.4.2. Market size and forecast, by End User
- 6.4.4.5. Rest of Asia-Pacific
- 6.4.4.5.1. Market size and forecast, by Product Type
- 6.4.4.5.2. Market size and forecast, by End User
- 6.5. LAMEA
- 6.5.1. Key market trends, growth factors and opportunities
- 6.5.2. Market size and forecast, by Product Type
- 6.5.3. Market size and forecast, by End User
- 6.5.4. Market size and forecast, by country
- 6.5.4.1. Brazil
- 6.5.4.1.1. Market size and forecast, by Product Type
- 6.5.4.1.2. Market size and forecast, by End User
- 6.5.4.2. UAE
- 6.5.4.2.1. Market size and forecast, by Product Type
- 6.5.4.2.2. Market size and forecast, by End User
- 6.5.4.3. Saudi Arabia
- 6.5.4.3.1. Market size and forecast, by Product Type
- 6.5.4.3.2. Market size and forecast, by End User
- 6.5.4.4. Rest of LAMEA
- 6.5.4.4.1. Market size and forecast, by Product Type
- 6.5.4.4.2. Market size and forecast, by End User
CHAPTER 7: COMPETITIVE LANDSCAPE
- 7.1. Introduction
- 7.2. Top winning strategies
- 7.3. Product mapping of top 10 player
- 7.4. Competitive dashboard
- 7.5. Competitive heatmap
- 7.6. Top player positioning, 2023
CHAPTER 8: COMPANY PROFILES
- 8.1. AB Electrolux
- 8.1.1. Company overview
- 8.1.2. Key executives
- 8.1.3. Company snapshot
- 8.1.4. Operating business segments
- 8.1.5. Product portfolio
- 8.1.6. Business performance
- 8.1.7. Key strategic moves and developments
- 8.2. ALI GROUP S.R.L.
- 8.2.1. Company overview
- 8.2.2. Key executives
- 8.2.3. Company snapshot
- 8.2.4. Operating business segments
- 8.2.5. Product portfolio
- 8.2.6. Business performance
- 8.2.7. Key strategic moves and developments
- 8.3. DAIKIN INDUSTRIES LTD.
- 8.3.1. Company overview
- 8.3.2. Key executives
- 8.3.3. Company snapshot
- 8.3.4. Operating business segments
- 8.3.5. Product portfolio
- 8.3.6. Business performance
- 8.3.7. Key strategic moves and developments
- 8.4. Dover Corporation
- 8.4.1. Company overview
- 8.4.2. Key executives
- 8.4.3. Company snapshot
- 8.4.4. Operating business segments
- 8.4.5. Product portfolio
- 8.4.6. Business performance
- 8.4.7. Key strategic moves and developments
- 8.5. FRIGOGLASS S.A.I.C.
- 8.5.1. Company overview
- 8.5.2. Key executives
- 8.5.3. Company snapshot
- 8.5.4. Operating business segments
- 8.5.5. Product portfolio
- 8.5.6. Business performance
- 8.5.7. Key strategic moves and developments
- 8.6. HAIER ELECTRONICS GROUP CO., LTD.
- 8.6.1. Company overview
- 8.6.2. Key executives
- 8.6.3. Company snapshot
- 8.6.4. Operating business segments
- 8.6.5. Product portfolio
- 8.6.6. Business performance
- 8.6.7. Key strategic moves and developments
- 8.7. Illinois Tool Works Inc.
- 8.7.1. Company overview
- 8.7.2. Key executives
- 8.7.3. Company snapshot
- 8.7.4. Operating business segments
- 8.7.5. Product portfolio
- 8.7.6. Business performance
- 8.7.7. Key strategic moves and developments
- 8.8. Johnson Controls International PLC
- 8.8.1. Company overview
- 8.8.2. Key executives
- 8.8.3. Company snapshot
- 8.8.4. Operating business segments
- 8.8.5. Product portfolio
- 8.8.6. Business performance
- 8.8.7. Key strategic moves and developments
- 8.9. Panasonic Corporation
- 8.9.1. Company overview
- 8.9.2. Key executives
- 8.9.3. Company snapshot
- 8.9.4. Operating business segments
- 8.9.5. Product portfolio
- 8.9.6. Business performance
- 8.9.7. Key strategic moves and developments
- 8.10. United Technologies Corporation
- 8.10.1. Company overview
- 8.10.2. Key executives
- 8.10.3. Company snapshot
- 8.10.4. Operating business segments
- 8.10.5. Product portfolio
- 8.10.6. Business performance
- 8.10.7. Key strategic moves and developments

お電話でのお問い合わせ
044-952-0102
( 土日・祝日を除く )