
|
市場調査レポート
商品コード
1513338
ビーコン市場:タイプ別、技術別、用途別:世界の機会分析と産業予測、2024年~2032年Beacon Market By Type, By Technology, By Application : Global Opportunity Analysis and Industry Forecast, 2024-2032 |
||||||
|
|||||||

| ビーコン市場:タイプ別、技術別、用途別:世界の機会分析と産業予測、2024年~2032年 |
|
出版日: 2024年04月01日
発行: Allied Market Research
ページ情報: 英文 250 Pages
納期: 2~3営業日
|

- 全表示
- 概要
- 図表
- 目次
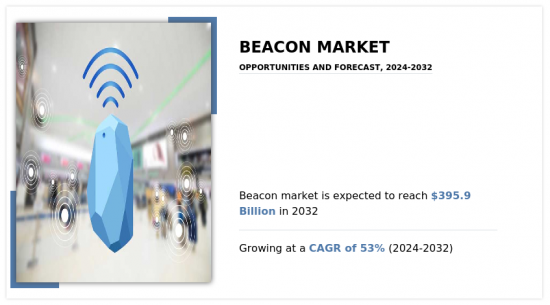
世界のビーコン市場の2023年の市場規模は96億米ドルで、2024年から2032年までのCAGRは53%で、2032年には3,959億米ドルに達すると予測されています。
ビーコンは、近くの携帯電話やタブレット端末に少量のデータを含む無線信号を発信する小型デバイスです。互換性のあるデバイス上のモバイルアプリは、近接エリアのビーコンからの信号をリッスンし、アプリを介してプロモーション通知、クーポン、ビデオ、URLフォームなどを送信するなどの体験をトリガーすることができます。
ビーコンの機能強化は、ビーコン市場の大きな促進要因となっています。ビーコン技術は、従業員や資産のモニタリング、データ生成、リソースの最適化などの機能により、小売、ヘルスケア、旅行・観光、教育など様々な分野で広く採用されています。また、ビーコンは従業員や資産のモニタリングを以前よりも正確かつ容易にしました。ビーコンはジオフェンスを作成し、特定のエリアや場所に出入りするアイテムを追跡するのに役立ちます。さらに、変動履歴も提供されるため、動向調査や予測分析にも利用できます。さらに、ビーコンを利用した名札により、雇用主は従業員をよりよく管理することができ、適切な従業員が適切な時間に適切な場所にいることを保証し、それによって最適なパフォーマンスを確認することができます。同様に、制限区域にビーコンを取り付けると、権限のない人員、顧客、訪問者が制限区域や危険な作業区域に入ったときに自動通知が可能になり、安全性とセキュリティが強化されます。このように、ビーコンのこうした機能強化がビーコン市場を世界的に牽引しています。
一方、組織小売業の急増は、ビーコン市場に魅力的な機会を提供しています。可処分所得の増加、生活水準の向上、消費者主義の台頭、技術的影響、外資系小売業者の参入、企業部門の参入などが、組織小売業の成長に拍車をかけています。さらに、スーパーマーケット、百貨店、ハイパーマーケット、ディスカウントストアなどの組織小売業の増加により、ビーコンは組織小売店舗をよりスマートにするため、ビーコン技術の需要も増加すると予想されます。顧客が小売店舗に設置されたビーコンの近くにスマートフォンで入ると、ビーコンは無線信号を発信して顧客の位置を特定し、関連する小売アプリで情報を更新します。さらに、店舗内や近隣の顧客の位置や動きに基づいて、小売業者は、商品のオファーや割引、顧客が選択可能なブランド、過去の購入履歴に基づく新入荷商品など、ターゲットを絞ったメッセージを送ることができます。このように、商品へのアクセスが容易になることで、ショッピング体験がより楽しいものになります。したがって、組織化された小売業界の急増は、ビーコン市場に数多くの成長機会を提供しています。
しかし、プライバシーやセキュリティに関する懸念の高まりは、ビーコン市場の抑制要因となっています。ビーコン技術は、顧客が特定の場所にどれだけ近いかに基づいてパーソナライズされた広告で潜在顧客をターゲットにし、様々なプロモーション通知を通じて潜在顧客を引き付け、近い将来に購買決定を行う近接マーケティングを通じて、従来のマーケティング・プロセスを変革してきました。さらに、従業員と資産の監視、データ生成、リソースの最適化などの機能が、複数の業界別でビーコンソリューションの採用に拍車をかけています。しかし、ブルートゥースネットワークやIoT(モノのインターネット)からのデータアクセスに関連するデータセキュリティの懸念が、市場成長の妨げになると予想されます。さらに、IoTデバイスを介して組織を標的にするサイバー犯罪者の脅威の増大が、今後の成長を制限すると予想されます。
ビーコン市場は、タイプ、技術、アプリケーション、地域によって区分されます。タイプベースでは、市場はiBeacon、Eddystone、AltBeacon、その他に分けられます。技術ベースでは、市場はBLE、Wi-Fi、超音波、その他に分類されます。アプリケーションベースでは、市場は小売、旅行観光&ホスピタリティ、ヘルスケア、BFSI、その他に分類されます。
地域別では、北米(米国、カナダ、メキシコ)、欧州(英国、ドイツ、フランス、イタリア、その他欧州地域)、アジア太平洋(中国、日本、インド、韓国、その他アジア太平洋地域)、ラテンアメリカ(ブラジル、アルゼンチン、その他アジア太平洋地域)、中東・アフリカ(アラブ首長国連邦、サウジアラビア、カタール、南アフリカ、その他中東・アフリカ地域)で分析されます。
利害関係者にとっての主なメリット
- 当レポートでは、2023年から2032年までのビーコン市場分析の市場セグメント、現在の動向、推定・動向、ダイナミクスを定量的に分析し、優勢なビーコン市場機会を特定します。
- 市場促進要因、市場抑制要因、市場機会に関連する情報とともに市場調査を提供します。
- ポーターのファイブフォース分析では、利害関係者が利益重視のビジネス決定を下し、サプライヤーとバイヤーのネットワークを強化できるよう、バイヤーとサプライヤーの潜在力を明らかにします。
- ビーコン市場セグメンテーションの詳細な分析により、市場機会を見極めることができます。
- 各地域の主要国は、世界市場への収益貢献度に応じてマッピングされています。
- 市場プレイヤーのポジショニングは、ベンチマーキングを容易にし、市場プレイヤーの現在のポジションの明確な理解を提供します。
- この調査レポートは、地域別および世界のビーコン市場動向、主要企業、市場セグメント、応用分野、市場成長戦略の分析を含んでいます。
本レポートで可能なカスタマイズ(追加費用とスケジュールが必要です。)
- 製品ライフサイクル
- 製品/セグメント別のプレイヤーの市場シェア分析
- 国、地域、世界レベルでの患者/疫学データ
- クライアントの関心に応じた追加の企業プロファイル
- 国別または地域別の追加分析-市場規模および予測
- 主要プレーヤーの詳細(所在地、連絡先、サプライヤー/ベンダーネットワークなどを含む、エクセル形式)
- SWOT分析
目次
第1章 イントロダクション
第2章 エグゼクティブサマリー
第3章 市場概要
- 市場の定義と範囲
- 主な調査結果
- 影響要因
- 主な投資機会
- ポーターのファイブフォース分析
- 市場力学
- 促進要因
- 抑制要因
- 機会
第4章 ビーコン市場:タイプ別
- 概要
- iビーコン
- エディストーン
- オルトビーコン
- その他
第5章 ビーコン市場:技術別
- 概要
- BLE
- Wi-Fi
- 超音波
- その他
第6章 ビーコン市場:用途別
- 概要
- 小売
- 旅行・ホスピタリティ
- ヘルスケア
- BFSI
- その他
第7章 ビーコン市場:地域別
- 概要
- 北米
- 米国
- カナダ
- メキシコ
- 欧州
- 英国
- ドイツ
- フランス
- スペイン
- イタリア
- その他
- アジア太平洋
- 中国
- 日本
- インド
- オーストラリア
- 韓国
- その他
- ラテンアメリカ
- ブラジル
- アルゼンチン
- その他ラテンアメリカ
- 中東・アフリカ
- アラブ首長国連邦
- サウジアラビア
- カタール
- その他中東とアフリカ
第8章 競争情勢
- イントロダクション
- 主要成功戦略
- 主要10社の製品マッピング
- 競合ダッシュボード
- 競合ヒートマップ
- 主要企業のポジショニング、2023年
第9章 企業プロファイル
- Kontakt.io
- Apple Inc.
- Estimote Inc.
- BLUECATS
- Hewlett Packard Enterprise Development LP
- Cisco Systems Inc.
- sensorberg GmbH
- Gelo Inc.
- Accent Advanced Systems, SLU.
- Qualcomm Incorporated.
LIST OF TABLES
- TABLE 01. GLOBAL BEACON MARKET, BY TYPE, 2023-2032 ($BILLION)
- TABLE 02. BEACON MARKET FOR IBEACON, BY REGION, 2023-2032 ($BILLION)
- TABLE 03. BEACON MARKET FOR EDDYSTONE, BY REGION, 2023-2032 ($BILLION)
- TABLE 04. BEACON MARKET FOR ALTBEACON, BY REGION, 2023-2032 ($BILLION)
- TABLE 05. BEACON MARKET FOR OTHERS, BY REGION, 2023-2032 ($BILLION)
- TABLE 06. GLOBAL BEACON MARKET, BY TECHNOLOGY, 2023-2032 ($BILLION)
- TABLE 07. BEACON MARKET FOR BLE, BY REGION, 2023-2032 ($BILLION)
- TABLE 08. BEACON MARKET FOR WI-FI, BY REGION, 2023-2032 ($BILLION)
- TABLE 09. BEACON MARKET FOR ULTRASOUND, BY REGION, 2023-2032 ($BILLION)
- TABLE 10. BEACON MARKET FOR OTHERS, BY REGION, 2023-2032 ($BILLION)
- TABLE 11. GLOBAL BEACON MARKET, BY APPLICATION, 2023-2032 ($BILLION)
- TABLE 12. BEACON MARKET FOR RETAIL, BY REGION, 2023-2032 ($BILLION)
- TABLE 13. BEACON MARKET FOR TRAVEL TOURISM AND HOSPITALITY, BY REGION, 2023-2032 ($BILLION)
- TABLE 14. BEACON MARKET FOR HEALTHCARE, BY REGION, 2023-2032 ($BILLION)
- TABLE 15. BEACON MARKET FOR BFSI, BY REGION, 2023-2032 ($BILLION)
- TABLE 16. BEACON MARKET FOR OTHERS, BY REGION, 2023-2032 ($BILLION)
- TABLE 17. BEACON MARKET, BY REGION, 2023-2032 ($BILLION)
- TABLE 18. NORTH AMERICA BEACON MARKET, BY TYPE, 2023-2032 ($BILLION)
- TABLE 19. NORTH AMERICA BEACON MARKET, BY TECHNOLOGY, 2023-2032 ($BILLION)
- TABLE 20. NORTH AMERICA BEACON MARKET, BY APPLICATION, 2023-2032 ($BILLION)
- TABLE 21. NORTH AMERICA BEACON MARKET, BY COUNTRY, 2023-2032 ($BILLION)
- TABLE 22. U.S. BEACON MARKET, BY TYPE, 2023-2032 ($BILLION)
- TABLE 23. U.S. BEACON MARKET, BY TECHNOLOGY, 2023-2032 ($BILLION)
- TABLE 24. U.S. BEACON MARKET, BY APPLICATION, 2023-2032 ($BILLION)
- TABLE 25. CANADA BEACON MARKET, BY TYPE, 2023-2032 ($BILLION)
- TABLE 26. CANADA BEACON MARKET, BY TECHNOLOGY, 2023-2032 ($BILLION)
- TABLE 27. CANADA BEACON MARKET, BY APPLICATION, 2023-2032 ($BILLION)
- TABLE 28. MEXICO BEACON MARKET, BY TYPE, 2023-2032 ($BILLION)
- TABLE 29. MEXICO BEACON MARKET, BY TECHNOLOGY, 2023-2032 ($BILLION)
- TABLE 30. MEXICO BEACON MARKET, BY APPLICATION, 2023-2032 ($BILLION)
- TABLE 31. EUROPE BEACON MARKET, BY TYPE, 2023-2032 ($BILLION)
- TABLE 32. EUROPE BEACON MARKET, BY TECHNOLOGY, 2023-2032 ($BILLION)
- TABLE 33. EUROPE BEACON MARKET, BY APPLICATION, 2023-2032 ($BILLION)
- TABLE 34. EUROPE BEACON MARKET, BY COUNTRY, 2023-2032 ($BILLION)
- TABLE 35. UK BEACON MARKET, BY TYPE, 2023-2032 ($BILLION)
- TABLE 36. UK BEACON MARKET, BY TECHNOLOGY, 2023-2032 ($BILLION)
- TABLE 37. UK BEACON MARKET, BY APPLICATION, 2023-2032 ($BILLION)
- TABLE 38. GERMANY BEACON MARKET, BY TYPE, 2023-2032 ($BILLION)
- TABLE 39. GERMANY BEACON MARKET, BY TECHNOLOGY, 2023-2032 ($BILLION)
- TABLE 40. GERMANY BEACON MARKET, BY APPLICATION, 2023-2032 ($BILLION)
- TABLE 41. FRANCE BEACON MARKET, BY TYPE, 2023-2032 ($BILLION)
- TABLE 42. FRANCE BEACON MARKET, BY TECHNOLOGY, 2023-2032 ($BILLION)
- TABLE 43. FRANCE BEACON MARKET, BY APPLICATION, 2023-2032 ($BILLION)
- TABLE 44. SPAIN BEACON MARKET, BY TYPE, 2023-2032 ($BILLION)
- TABLE 45. SPAIN BEACON MARKET, BY TECHNOLOGY, 2023-2032 ($BILLION)
- TABLE 46. SPAIN BEACON MARKET, BY APPLICATION, 2023-2032 ($BILLION)
- TABLE 47. ITALY BEACON MARKET, BY TYPE, 2023-2032 ($BILLION)
- TABLE 48. ITALY BEACON MARKET, BY TECHNOLOGY, 2023-2032 ($BILLION)
- TABLE 49. ITALY BEACON MARKET, BY APPLICATION, 2023-2032 ($BILLION)
- TABLE 50. REST OF EUROPE BEACON MARKET, BY TYPE, 2023-2032 ($BILLION)
- TABLE 51. REST OF EUROPE BEACON MARKET, BY TECHNOLOGY, 2023-2032 ($BILLION)
- TABLE 52. REST OF EUROPE BEACON MARKET, BY APPLICATION, 2023-2032 ($BILLION)
- TABLE 53. ASIA-PACIFIC BEACON MARKET, BY TYPE, 2023-2032 ($BILLION)
- TABLE 54. ASIA-PACIFIC BEACON MARKET, BY TECHNOLOGY, 2023-2032 ($BILLION)
- TABLE 55. ASIA-PACIFIC BEACON MARKET, BY APPLICATION, 2023-2032 ($BILLION)
- TABLE 56. ASIA-PACIFIC BEACON MARKET, BY COUNTRY, 2023-2032 ($BILLION)
- TABLE 57. CHINA BEACON MARKET, BY TYPE, 2023-2032 ($BILLION)
- TABLE 58. CHINA BEACON MARKET, BY TECHNOLOGY, 2023-2032 ($BILLION)
- TABLE 59. CHINA BEACON MARKET, BY APPLICATION, 2023-2032 ($BILLION)
- TABLE 60. JAPAN BEACON MARKET, BY TYPE, 2023-2032 ($BILLION)
- TABLE 61. JAPAN BEACON MARKET, BY TECHNOLOGY, 2023-2032 ($BILLION)
- TABLE 62. JAPAN BEACON MARKET, BY APPLICATION, 2023-2032 ($BILLION)
- TABLE 63. INDIA BEACON MARKET, BY TYPE, 2023-2032 ($BILLION)
- TABLE 64. INDIA BEACON MARKET, BY TECHNOLOGY, 2023-2032 ($BILLION)
- TABLE 65. INDIA BEACON MARKET, BY APPLICATION, 2023-2032 ($BILLION)
- TABLE 66. AUSTRALIA BEACON MARKET, BY TYPE, 2023-2032 ($BILLION)
- TABLE 67. AUSTRALIA BEACON MARKET, BY TECHNOLOGY, 2023-2032 ($BILLION)
- TABLE 68. AUSTRALIA BEACON MARKET, BY APPLICATION, 2023-2032 ($BILLION)
- TABLE 69. SOUTH KOREA BEACON MARKET, BY TYPE, 2023-2032 ($BILLION)
- TABLE 70. SOUTH KOREA BEACON MARKET, BY TECHNOLOGY, 2023-2032 ($BILLION)
- TABLE 71. SOUTH KOREA BEACON MARKET, BY APPLICATION, 2023-2032 ($BILLION)
- TABLE 72. REST OF ASIA-PACIFIC BEACON MARKET, BY TYPE, 2023-2032 ($BILLION)
- TABLE 73. REST OF ASIA-PACIFIC BEACON MARKET, BY TECHNOLOGY, 2023-2032 ($BILLION)
- TABLE 74. REST OF ASIA-PACIFIC BEACON MARKET, BY APPLICATION, 2023-2032 ($BILLION)
- TABLE 75. LATIN AMERICA BEACON MARKET, BY TYPE, 2023-2032 ($BILLION)
- TABLE 76. LATIN AMERICA BEACON MARKET, BY TECHNOLOGY, 2023-2032 ($BILLION)
- TABLE 77. LATIN AMERICA BEACON MARKET, BY APPLICATION, 2023-2032 ($BILLION)
- TABLE 78. LATIN AMERICA BEACON MARKET, BY COUNTRY, 2023-2032 ($BILLION)
- TABLE 79. BRAZIL BEACON MARKET, BY TYPE, 2023-2032 ($BILLION)
- TABLE 80. BRAZIL BEACON MARKET, BY TECHNOLOGY, 2023-2032 ($BILLION)
- TABLE 81. BRAZIL BEACON MARKET, BY APPLICATION, 2023-2032 ($BILLION)
- TABLE 82. ARGENTINA BEACON MARKET, BY TYPE, 2023-2032 ($BILLION)
- TABLE 83. ARGENTINA BEACON MARKET, BY TECHNOLOGY, 2023-2032 ($BILLION)
- TABLE 84. ARGENTINA BEACON MARKET, BY APPLICATION, 2023-2032 ($BILLION)
- TABLE 85. REST OF LATIN AMERICA BEACON MARKET, BY TYPE, 2023-2032 ($BILLION)
- TABLE 86. REST OF LATIN AMERICA BEACON MARKET, BY TECHNOLOGY, 2023-2032 ($BILLION)
- TABLE 87. REST OF LATIN AMERICA BEACON MARKET, BY APPLICATION, 2023-2032 ($BILLION)
- TABLE 88. MIDDLE EAST AND AFRICA BEACON MARKET, BY TYPE, 2023-2032 ($BILLION)
- TABLE 89. MIDDLE EAST AND AFRICA BEACON MARKET, BY TECHNOLOGY, 2023-2032 ($BILLION)
- TABLE 90. MIDDLE EAST AND AFRICA BEACON MARKET, BY APPLICATION, 2023-2032 ($BILLION)
- TABLE 91. MIDDLE EAST AND AFRICA BEACON MARKET, BY COUNTRY, 2023-2032 ($BILLION)
- TABLE 92. UAE BEACON MARKET, BY TYPE, 2023-2032 ($BILLION)
- TABLE 93. UAE BEACON MARKET, BY TECHNOLOGY, 2023-2032 ($BILLION)
- TABLE 94. UAE BEACON MARKET, BY APPLICATION, 2023-2032 ($BILLION)
- TABLE 95. SAUDI ARABIA BEACON MARKET, BY TYPE, 2023-2032 ($BILLION)
- TABLE 96. SAUDI ARABIA BEACON MARKET, BY TECHNOLOGY, 2023-2032 ($BILLION)
- TABLE 97. SAUDI ARABIA BEACON MARKET, BY APPLICATION, 2023-2032 ($BILLION)
- TABLE 98. QATAR BEACON MARKET, BY TYPE, 2023-2032 ($BILLION)
- TABLE 99. QATAR BEACON MARKET, BY TECHNOLOGY, 2023-2032 ($BILLION)
- TABLE 100. QATAR BEACON MARKET, BY APPLICATION, 2023-2032 ($BILLION)
- TABLE 101. REST OF MIDDLE EAST AND AFRICA BEACON MARKET, BY TYPE, 2023-2032 ($BILLION)
- TABLE 102. REST OF MIDDLE EAST AND AFRICA BEACON MARKET, BY TECHNOLOGY, 2023-2032 ($BILLION)
- TABLE 103. REST OF MIDDLE EAST AND AFRICA BEACON MARKET, BY APPLICATION, 2023-2032 ($BILLION)
- TABLE 104. KONTAKT.IO: KEY EXECUTIVES
- TABLE 105. KONTAKT.IO: COMPANY SNAPSHOT
- TABLE 106. KONTAKT.IO: PRODUCT SEGMENTS
- TABLE 107. KONTAKT.IO: SERVICE SEGMENTS
- TABLE 108. KONTAKT.IO: PRODUCT PORTFOLIO
- TABLE 109. KONTAKT.IO: KEY STRATEGIES
- TABLE 110. APPLE INC.: KEY EXECUTIVES
- TABLE 111. APPLE INC.: COMPANY SNAPSHOT
- TABLE 112. APPLE INC.: PRODUCT SEGMENTS
- TABLE 113. APPLE INC.: SERVICE SEGMENTS
- TABLE 114. APPLE INC.: PRODUCT PORTFOLIO
- TABLE 115. APPLE INC.: KEY STRATEGIES
- TABLE 116. ESTIMOTE INC.: KEY EXECUTIVES
- TABLE 117. ESTIMOTE INC.: COMPANY SNAPSHOT
- TABLE 118. ESTIMOTE INC.: PRODUCT SEGMENTS
- TABLE 119. ESTIMOTE INC.: SERVICE SEGMENTS
- TABLE 120. ESTIMOTE INC.: PRODUCT PORTFOLIO
- TABLE 121. ESTIMOTE INC.: KEY STRATEGIES
- TABLE 122. BLUECATS: KEY EXECUTIVES
- TABLE 123. BLUECATS: COMPANY SNAPSHOT
- TABLE 124. BLUECATS: PRODUCT SEGMENTS
- TABLE 125. BLUECATS: SERVICE SEGMENTS
- TABLE 126. BLUECATS: PRODUCT PORTFOLIO
- TABLE 127. BLUECATS: KEY STRATEGIES
- TABLE 128. HEWLETT PACKARD ENTERPRISE DEVELOPMENT LP: KEY EXECUTIVES
- TABLE 129. HEWLETT PACKARD ENTERPRISE DEVELOPMENT LP: COMPANY SNAPSHOT
- TABLE 130. HEWLETT PACKARD ENTERPRISE DEVELOPMENT LP: PRODUCT SEGMENTS
- TABLE 131. HEWLETT PACKARD ENTERPRISE DEVELOPMENT LP: SERVICE SEGMENTS
- TABLE 132. HEWLETT PACKARD ENTERPRISE DEVELOPMENT LP: PRODUCT PORTFOLIO
- TABLE 133. HEWLETT PACKARD ENTERPRISE DEVELOPMENT LP: KEY STRATEGIES
- TABLE 134. CISCO SYSTEMS INC.: KEY EXECUTIVES
- TABLE 135. CISCO SYSTEMS INC.: COMPANY SNAPSHOT
- TABLE 136. CISCO SYSTEMS INC.: PRODUCT SEGMENTS
- TABLE 137. CISCO SYSTEMS INC.: SERVICE SEGMENTS
- TABLE 138. CISCO SYSTEMS INC.: PRODUCT PORTFOLIO
- TABLE 139. CISCO SYSTEMS INC.: KEY STRATEGIES
- TABLE 140. SENSORBERG GMBH: KEY EXECUTIVES
- TABLE 141. SENSORBERG GMBH: COMPANY SNAPSHOT
- TABLE 142. SENSORBERG GMBH: PRODUCT SEGMENTS
- TABLE 143. SENSORBERG GMBH: SERVICE SEGMENTS
- TABLE 144. SENSORBERG GMBH: PRODUCT PORTFOLIO
- TABLE 145. SENSORBERG GMBH: KEY STRATEGIES
- TABLE 146. GELO INC.: KEY EXECUTIVES
- TABLE 147. GELO INC.: COMPANY SNAPSHOT
- TABLE 148. GELO INC.: PRODUCT SEGMENTS
- TABLE 149. GELO INC.: SERVICE SEGMENTS
- TABLE 150. GELO INC.: PRODUCT PORTFOLIO
- TABLE 151. GELO INC.: KEY STRATEGIES
- TABLE 152. ACCENT ADVANCED SYSTEMS, SLU.: KEY EXECUTIVES
- TABLE 153. ACCENT ADVANCED SYSTEMS, SLU.: COMPANY SNAPSHOT
- TABLE 154. ACCENT ADVANCED SYSTEMS, SLU.: PRODUCT SEGMENTS
- TABLE 155. ACCENT ADVANCED SYSTEMS, SLU.: SERVICE SEGMENTS
- TABLE 156. ACCENT ADVANCED SYSTEMS, SLU.: PRODUCT PORTFOLIO
- TABLE 157. ACCENT ADVANCED SYSTEMS, SLU.: KEY STRATEGIES
- TABLE 158. QUALCOMM INCORPORATED.: KEY EXECUTIVES
- TABLE 159. QUALCOMM INCORPORATED.: COMPANY SNAPSHOT
- TABLE 160. QUALCOMM INCORPORATED.: PRODUCT SEGMENTS
- TABLE 161. QUALCOMM INCORPORATED.: SERVICE SEGMENTS
- TABLE 162. QUALCOMM INCORPORATED.: PRODUCT PORTFOLIO
- TABLE 163. QUALCOMM INCORPORATED.: KEY STRATEGIES
LIST OF FIGURES
- FIGURE 01. BEACON MARKET, 2023-2032
- FIGURE 02. SEGMENTATION OF BEACON MARKET,2023-2032
- FIGURE 03. TOP IMPACTING FACTORS IN BEACON MARKET
- FIGURE 04. TOP INVESTMENT POCKETS IN BEACON MARKET (2024-2032)
- FIGURE 05. BARGAINING POWER OF SUPPLIERS
- FIGURE 06. BARGAINING POWER OF BUYERS
- FIGURE 07. THREAT OF SUBSTITUTION
- FIGURE 08. THREAT OF SUBSTITUTION
- FIGURE 09. COMPETITIVE RIVALRY
- FIGURE 10. GLOBAL BEACON MARKET:DRIVERS, RESTRAINTS AND OPPORTUNITIES
- FIGURE 11. BEACON MARKET, BY TYPE, 2023 AND 2032(%)
- FIGURE 12. COMPARATIVE SHARE ANALYSIS OF BEACON MARKET FOR IBEACON, BY COUNTRY 2023 AND 2032(%)
- FIGURE 13. COMPARATIVE SHARE ANALYSIS OF BEACON MARKET FOR EDDYSTONE, BY COUNTRY 2023 AND 2032(%)
- FIGURE 14. COMPARATIVE SHARE ANALYSIS OF BEACON MARKET FOR ALTBEACON, BY COUNTRY 2023 AND 2032(%)
- FIGURE 15. COMPARATIVE SHARE ANALYSIS OF BEACON MARKET FOR OTHERS, BY COUNTRY 2023 AND 2032(%)
- FIGURE 16. BEACON MARKET, BY TECHNOLOGY, 2023 AND 2032(%)
- FIGURE 17. COMPARATIVE SHARE ANALYSIS OF BEACON MARKET FOR BLE, BY COUNTRY 2023 AND 2032(%)
- FIGURE 18. COMPARATIVE SHARE ANALYSIS OF BEACON MARKET FOR WI-FI, BY COUNTRY 2023 AND 2032(%)
- FIGURE 19. COMPARATIVE SHARE ANALYSIS OF BEACON MARKET FOR ULTRASOUND, BY COUNTRY 2023 AND 2032(%)
- FIGURE 20. COMPARATIVE SHARE ANALYSIS OF BEACON MARKET FOR OTHERS, BY COUNTRY 2023 AND 2032(%)
- FIGURE 21. BEACON MARKET, BY APPLICATION, 2023 AND 2032(%)
- FIGURE 22. COMPARATIVE SHARE ANALYSIS OF BEACON MARKET FOR RETAIL, BY COUNTRY 2023 AND 2032(%)
- FIGURE 23. COMPARATIVE SHARE ANALYSIS OF BEACON MARKET FOR TRAVEL TOURISM AND HOSPITALITY, BY COUNTRY 2023 AND 2032(%)
- FIGURE 24. COMPARATIVE SHARE ANALYSIS OF BEACON MARKET FOR HEALTHCARE, BY COUNTRY 2023 AND 2032(%)
- FIGURE 25. COMPARATIVE SHARE ANALYSIS OF BEACON MARKET FOR BFSI, BY COUNTRY 2023 AND 2032(%)
- FIGURE 26. COMPARATIVE SHARE ANALYSIS OF BEACON MARKET FOR OTHERS, BY COUNTRY 2023 AND 2032(%)
- FIGURE 27. BEACON MARKET BY REGION, 2023 AND 2032(%)
- FIGURE 28. U.S. BEACON MARKET, 2023-2032 ($BILLION)
- FIGURE 29. CANADA BEACON MARKET, 2023-2032 ($BILLION)
- FIGURE 30. MEXICO BEACON MARKET, 2023-2032 ($BILLION)
- FIGURE 31. UK BEACON MARKET, 2023-2032 ($BILLION)
- FIGURE 32. GERMANY BEACON MARKET, 2023-2032 ($BILLION)
- FIGURE 33. FRANCE BEACON MARKET, 2023-2032 ($BILLION)
- FIGURE 34. SPAIN BEACON MARKET, 2023-2032 ($BILLION)
- FIGURE 35. ITALY BEACON MARKET, 2023-2032 ($BILLION)
- FIGURE 36. REST OF EUROPE BEACON MARKET, 2023-2032 ($BILLION)
- FIGURE 37. CHINA BEACON MARKET, 2023-2032 ($BILLION)
- FIGURE 38. JAPAN BEACON MARKET, 2023-2032 ($BILLION)
- FIGURE 39. INDIA BEACON MARKET, 2023-2032 ($BILLION)
- FIGURE 40. AUSTRALIA BEACON MARKET, 2023-2032 ($BILLION)
- FIGURE 41. SOUTH KOREA BEACON MARKET, 2023-2032 ($BILLION)
- FIGURE 42. REST OF ASIA-PACIFIC BEACON MARKET, 2023-2032 ($BILLION)
- FIGURE 43. BRAZIL BEACON MARKET, 2023-2032 ($BILLION)
- FIGURE 44. ARGENTINA BEACON MARKET, 2023-2032 ($BILLION)
- FIGURE 45. REST OF LATIN AMERICA BEACON MARKET, 2023-2032 ($BILLION)
- FIGURE 46. UAE BEACON MARKET, 2023-2032 ($BILLION)
- FIGURE 47. SAUDI ARABIA BEACON MARKET, 2023-2032 ($BILLION)
- FIGURE 48. QATAR BEACON MARKET, 2023-2032 ($BILLION)
- FIGURE 49. REST OF MIDDLE EAST AND AFRICA BEACON MARKET, 2023-2032 ($BILLION)
- FIGURE 50. TOP WINNING STRATEGIES, BY YEAR
- FIGURE 51. TOP WINNING STRATEGIES, BY DEVELOPMENT
- FIGURE 52. TOP WINNING STRATEGIES, BY COMPANY
- FIGURE 53. PRODUCT MAPPING OF TOP 10 PLAYERS
- FIGURE 54. COMPETITIVE DASHBOARD
- FIGURE 55. COMPETITIVE HEATMAP: BEACON MARKET
- FIGURE 56. TOP PLAYER POSITIONING, 2023
The Global Beacon Market was valued at $9.6 billion in 2023, and is projected to reach $395.9 billion by 2032, growing at a CAGR of 53% from 2024 to 2032.. Beacon is a small device that sends out radio signals to nearby mobile phones and tablets, containing a small amount of data. Mobile apps on compatible devices can listen for signals from beacons on proximity area and then trigger an experience such as sending a promotional notification, coupon, video, URL form and others via the app.
The enhanced feature of beacon represents a significant driving factor for the beacon market. Beacon technology is widely being adopted in various sectors such as retail, healthcare, travel & tourism, and education among others, owing to its features such as employee & asset monitoring, data generation, resource optimization and others. In addition, beacon has made employee and asset monitoring more accurate and easier than before. Beacons create geofences to help track item in and out of specific area or locations. Further, it also provides history of movement which can be used to study trend lines and predictive analysis. Furthermore, beacons enabled name badges enable employers to better manage their workforce, ensuring that the right employees are at the right place at the right time, thereby ascertaining optimal performance. Similarly, beacon attached to restricted area enables automatic notification when unauthorized personnel, customers, or visitors enter the restricted or dangerous work zone, which in turn enhances safety and security. Thus, these enhanced features of beacons are driving the beacon market globally.
On the other hand, upsurge in organized retailing presents a compelling opportunity for the beacon market. Rise in disposable income, improved living standard, rise of consumerism, technological impact, entry of foreign retailers, and entry of corporate sector are fueling the growth of organized retail industry. Further, with the rise in organized retail such as supermarkets, departmental stores, hypermarkets and discounters among others the demand of beacon technology is also expected to rise as beacon makes organized retail store smarter. When a customer enters proximity of the beacons fixed in retail store with smart phone, it emits radio signal to locate the customer and update the information with the associated retail app. Further, based on location and movement of the customer inside the store or nearby, retailer can send targeted message such as offer & discounts on products, available brands on customer choice, new arrivals based on previous purchasing history, and others. Thus, easier access to the products makes the shopping experience more enjoyable. Hence, upsurge of organized retail industry provides numerous growth opportunities for the beacon market.
However, growing concerns regarding privacy and security is a restraint factor for the beacon market. Beacon technology has transformed the traditional marketing process through proximity marketing where it targets potential customers with personalized advertisements based on how near a customer is close to a particular location and attracting them through various promotional notification to make purchasing decisions in the near future. Further, features such as employee & asset monitoring, data generation, resource optimization and others, are fueling the adoption of beacon solution among several industry verticals. However, data security concerns related to data access from Bluetooth networks and IoT (Internet of Things) are expected to hinder the market growth. Furthermore, the increasing threat of cybercriminals targeting organizations via IoT devices is expected to limit the growth in coming years.
The beacon market is segmented on the basis of type, technology, application and region. On the basis of type, the market is divided into iBeacon, Eddystone, AltBeacon, and others. On the basis of technology, the market is classified into BLE, Wi-Fi, ultrasound, and others. On the basis of application, the market is classified into retail, travel tourism & hospitality, healthcare, BFSI, and others.
On the basis of region, it is analyzed across North America (the U.S., Canada, and Mexico), Europe (the UK, Germany, France, Italy, and the rest of Europe), Asia-Pacific (China, Japan, India, South Korea, and rest of Asia-Pacific), Latin America (Brazil, Argentina, and rest of Latin America), and Middle East and Africa (UAE, Saudi Arabia, Qatar, South Africa, and rest of Middle East & Africa).
The key players profiled in the report include Kontakt.io, Apple Inc., Estimote Inc., BlueCats, Aruba Networks Inc., Blue Sense Networks, Glimworm Beacon, Gelo Inc., Sensorberg GmbH, Accent Advanced Systems, SLU are provided in this report. These key players have adopted strategies such as product portfolio expansion, mergers & acquisitions, agreements, geographical expansion, and collaborations to enhance their market penetration
Key Benefits For Stakeholders
- This report provides a quantitative analysis of the market segments, current trends, estimations, and dynamics of the beacon market analysis from 2023 to 2032 to identify the prevailing beacon market opportunities.
- The market research is offered along with information related to key drivers, restraints, and opportunities.
- Porter's five forces analysis highlights the potency of buyers and suppliers to enable stakeholders make profit-oriented business decisions and strengthen their supplier-buyer network.
- In-depth analysis of the beacon market segmentation assists to determine the prevailing market opportunities.
- Major countries in each region are mapped according to their revenue contribution to the global market.
- Market player positioning facilitates benchmarking and provides a clear understanding of the present position of the market players.
- The report includes the analysis of the regional as well as global beacon market trends, key players, market segments, application areas, and market growth strategies.
Additional benefits you will get with this purchase are:
- Quarterly Update and* (only available with a corporate license, on listed price)
- 5 additional Company Profile of client Choice pre- or Post-purchase, as a free update.
- Free Upcoming Version on the Purchase of Five and Enterprise User License.
- 16 analyst hours of support* (post-purchase, if you find additional data requirements upon review of the report, you may receive support amounting to 16 analyst hours to solve questions, and post-sale queries)
- 15% Free Customization* (in case the scope or segment of the report does not match your requirements, 15% is equivalent to 3 working days of free work, applicable once)
- Free data Pack on the Five and Enterprise User License. (Excel version of the report)
- Free Updated report if the report is 6-12 months old or older.
- 24-hour priority response*
- Free Industry updates and white papers.
Possible Customization with this report (with additional cost and timeline, please talk to the sales executive to know more)
- Product Life Cycle
- Market share analysis of players by products/segments
- Patient/epidemiology data at country, region, global level
- Additional company profiles with specific to client's interest
- Additional country or region analysis- market size and forecast
- Key player details (including location, contact details, supplier/vendor network etc. in excel format)
- SWOT Analysis
Key Market Segments
By Technology
- Others
- BLE
- Wi-Fi
- Ultrasound
By Type
- iBeacon
- Eddystone
- AltBeacon
- Others
By Application
- Retail
- Travel tourism and hospitality
- Healthcare
- BFSI
- Others
By Region
- North America
- U.S.
- Canada
- Mexico
- Europe
- UK
- Germany
- France
- Spain
- Italy
- Rest of Europe
- Asia-Pacific
- China
- Japan
- India
- Australia
- South Korea
- Rest of Asia-Pacific
- Latin America
- Brazil
- Argentina
- Rest of Latin America
- Middle East and Africa
- UAE
- Saudi Arabia
- Qatar
- Rest of Middle East And Africa
Key Market Players:
- Kontakt.io
- Apple Inc.
- Estimote Inc.
- BLUECATS
- Hewlett Packard Enterprise Development LP
- Cisco Systems Inc.
- sensorberg gmbh
- Gelo Inc.
- Accent Advanced Systems, SLU.
- Qualcomm Incorporated.
TABLE OF CONTENTS
CHAPTER 1: INTRODUCTION
- 1.1. Report description
- 1.2. Key market segments
- 1.3. Key benefits to the stakeholders
- 1.4. Research methodology
- 1.4.1. Primary research
- 1.4.2. Secondary research
- 1.4.3. Analyst tools and models
CHAPTER 2: EXECUTIVE SUMMARY
- 2.1. CXO perspective
CHAPTER 3: MARKET OVERVIEW
- 3.1. Market definition and scope
- 3.2. Key findings
- 3.2.1. Top impacting factors
- 3.2.2. Top investment pockets
- 3.3. Porter's five forces analysis
- 3.4. Market dynamics
- 3.4.1. Drivers
- 3.4.2. Restraints
- 3.4.3. Opportunities
CHAPTER 4: BEACON MARKET, BY TYPE
- 4.1. Overview
- 4.1.1. Market size and forecast
- 4.2. iBeacon
- 4.2.1. Key market trends, growth factors and opportunities
- 4.2.2. Market size and forecast, by region
- 4.2.3. Market share analysis by country
- 4.3. Eddystone
- 4.3.1. Key market trends, growth factors and opportunities
- 4.3.2. Market size and forecast, by region
- 4.3.3. Market share analysis by country
- 4.4. AltBeacon
- 4.4.1. Key market trends, growth factors and opportunities
- 4.4.2. Market size and forecast, by region
- 4.4.3. Market share analysis by country
- 4.5. Others
- 4.5.1. Key market trends, growth factors and opportunities
- 4.5.2. Market size and forecast, by region
- 4.5.3. Market share analysis by country
CHAPTER 5: BEACON MARKET, BY TECHNOLOGY
- 5.1. Overview
- 5.1.1. Market size and forecast
- 5.2. BLE
- 5.2.1. Key market trends, growth factors and opportunities
- 5.2.2. Market size and forecast, by region
- 5.2.3. Market share analysis by country
- 5.3. Wi-Fi
- 5.3.1. Key market trends, growth factors and opportunities
- 5.3.2. Market size and forecast, by region
- 5.3.3. Market share analysis by country
- 5.4. Ultrasound
- 5.4.1. Key market trends, growth factors and opportunities
- 5.4.2. Market size and forecast, by region
- 5.4.3. Market share analysis by country
- 5.5. Others
- 5.5.1. Key market trends, growth factors and opportunities
- 5.5.2. Market size and forecast, by region
- 5.5.3. Market share analysis by country
CHAPTER 6: BEACON MARKET, BY APPLICATION
- 6.1. Overview
- 6.1.1. Market size and forecast
- 6.2. Retail
- 6.2.1. Key market trends, growth factors and opportunities
- 6.2.2. Market size and forecast, by region
- 6.2.3. Market share analysis by country
- 6.3. Travel tourism and hospitality
- 6.3.1. Key market trends, growth factors and opportunities
- 6.3.2. Market size and forecast, by region
- 6.3.3. Market share analysis by country
- 6.4. Healthcare
- 6.4.1. Key market trends, growth factors and opportunities
- 6.4.2. Market size and forecast, by region
- 6.4.3. Market share analysis by country
- 6.5. BFSI
- 6.5.1. Key market trends, growth factors and opportunities
- 6.5.2. Market size and forecast, by region
- 6.5.3. Market share analysis by country
- 6.6. Others
- 6.6.1. Key market trends, growth factors and opportunities
- 6.6.2. Market size and forecast, by region
- 6.6.3. Market share analysis by country
CHAPTER 7: BEACON MARKET, BY REGION
- 7.1. Overview
- 7.1.1. Market size and forecast By Region
- 7.2. North America
- 7.2.1. Key market trends, growth factors and opportunities
- 7.2.2. Market size and forecast, by Type
- 7.2.3. Market size and forecast, by Technology
- 7.2.4. Market size and forecast, by Application
- 7.2.5. Market size and forecast, by country
- 7.2.5.1. U.S.
- 7.2.5.1.1. Market size and forecast, by Type
- 7.2.5.1.2. Market size and forecast, by Technology
- 7.2.5.1.3. Market size and forecast, by Application
- 7.2.5.2. Canada
- 7.2.5.2.1. Market size and forecast, by Type
- 7.2.5.2.2. Market size and forecast, by Technology
- 7.2.5.2.3. Market size and forecast, by Application
- 7.2.5.3. Mexico
- 7.2.5.3.1. Market size and forecast, by Type
- 7.2.5.3.2. Market size and forecast, by Technology
- 7.2.5.3.3. Market size and forecast, by Application
- 7.3. Europe
- 7.3.1. Key market trends, growth factors and opportunities
- 7.3.2. Market size and forecast, by Type
- 7.3.3. Market size and forecast, by Technology
- 7.3.4. Market size and forecast, by Application
- 7.3.5. Market size and forecast, by country
- 7.3.5.1. UK
- 7.3.5.1.1. Market size and forecast, by Type
- 7.3.5.1.2. Market size and forecast, by Technology
- 7.3.5.1.3. Market size and forecast, by Application
- 7.3.5.2. Germany
- 7.3.5.2.1. Market size and forecast, by Type
- 7.3.5.2.2. Market size and forecast, by Technology
- 7.3.5.2.3. Market size and forecast, by Application
- 7.3.5.3. France
- 7.3.5.3.1. Market size and forecast, by Type
- 7.3.5.3.2. Market size and forecast, by Technology
- 7.3.5.3.3. Market size and forecast, by Application
- 7.3.5.4. Spain
- 7.3.5.4.1. Market size and forecast, by Type
- 7.3.5.4.2. Market size and forecast, by Technology
- 7.3.5.4.3. Market size and forecast, by Application
- 7.3.5.5. Italy
- 7.3.5.5.1. Market size and forecast, by Type
- 7.3.5.5.2. Market size and forecast, by Technology
- 7.3.5.5.3. Market size and forecast, by Application
- 7.3.5.6. Rest of Europe
- 7.3.5.6.1. Market size and forecast, by Type
- 7.3.5.6.2. Market size and forecast, by Technology
- 7.3.5.6.3. Market size and forecast, by Application
- 7.4. Asia-Pacific
- 7.4.1. Key market trends, growth factors and opportunities
- 7.4.2. Market size and forecast, by Type
- 7.4.3. Market size and forecast, by Technology
- 7.4.4. Market size and forecast, by Application
- 7.4.5. Market size and forecast, by country
- 7.4.5.1. China
- 7.4.5.1.1. Market size and forecast, by Type
- 7.4.5.1.2. Market size and forecast, by Technology
- 7.4.5.1.3. Market size and forecast, by Application
- 7.4.5.2. Japan
- 7.4.5.2.1. Market size and forecast, by Type
- 7.4.5.2.2. Market size and forecast, by Technology
- 7.4.5.2.3. Market size and forecast, by Application
- 7.4.5.3. India
- 7.4.5.3.1. Market size and forecast, by Type
- 7.4.5.3.2. Market size and forecast, by Technology
- 7.4.5.3.3. Market size and forecast, by Application
- 7.4.5.4. Australia
- 7.4.5.4.1. Market size and forecast, by Type
- 7.4.5.4.2. Market size and forecast, by Technology
- 7.4.5.4.3. Market size and forecast, by Application
- 7.4.5.5. South Korea
- 7.4.5.5.1. Market size and forecast, by Type
- 7.4.5.5.2. Market size and forecast, by Technology
- 7.4.5.5.3. Market size and forecast, by Application
- 7.4.5.6. Rest of Asia-Pacific
- 7.4.5.6.1. Market size and forecast, by Type
- 7.4.5.6.2. Market size and forecast, by Technology
- 7.4.5.6.3. Market size and forecast, by Application
- 7.5. Latin America
- 7.5.1. Key market trends, growth factors and opportunities
- 7.5.2. Market size and forecast, by Type
- 7.5.3. Market size and forecast, by Technology
- 7.5.4. Market size and forecast, by Application
- 7.5.5. Market size and forecast, by country
- 7.5.5.1. Brazil
- 7.5.5.1.1. Market size and forecast, by Type
- 7.5.5.1.2. Market size and forecast, by Technology
- 7.5.5.1.3. Market size and forecast, by Application
- 7.5.5.2. Argentina
- 7.5.5.2.1. Market size and forecast, by Type
- 7.5.5.2.2. Market size and forecast, by Technology
- 7.5.5.2.3. Market size and forecast, by Application
- 7.5.5.3. Rest of Latin America
- 7.5.5.3.1. Market size and forecast, by Type
- 7.5.5.3.2. Market size and forecast, by Technology
- 7.5.5.3.3. Market size and forecast, by Application
- 7.6. Middle East and Africa
- 7.6.1. Key market trends, growth factors and opportunities
- 7.6.2. Market size and forecast, by Type
- 7.6.3. Market size and forecast, by Technology
- 7.6.4. Market size and forecast, by Application
- 7.6.5. Market size and forecast, by country
- 7.6.5.1. UAE
- 7.6.5.1.1. Market size and forecast, by Type
- 7.6.5.1.2. Market size and forecast, by Technology
- 7.6.5.1.3. Market size and forecast, by Application
- 7.6.5.2. Saudi Arabia
- 7.6.5.2.1. Market size and forecast, by Type
- 7.6.5.2.2. Market size and forecast, by Technology
- 7.6.5.2.3. Market size and forecast, by Application
- 7.6.5.3. Qatar
- 7.6.5.3.1. Market size and forecast, by Type
- 7.6.5.3.2. Market size and forecast, by Technology
- 7.6.5.3.3. Market size and forecast, by Application
- 7.6.5.4. Rest of Middle East And Africa
- 7.6.5.4.1. Market size and forecast, by Type
- 7.6.5.4.2. Market size and forecast, by Technology
- 7.6.5.4.3. Market size and forecast, by Application
CHAPTER 8: COMPETITIVE LANDSCAPE
- 8.1. Introduction
- 8.2. Top winning strategies
- 8.3. Product mapping of top 10 player
- 8.4. Competitive dashboard
- 8.5. Competitive heatmap
- 8.6. Top player positioning, 2023
CHAPTER 9: COMPANY PROFILES
- 9.1. Kontakt.io
- 9.1.1. Company overview
- 9.1.2. Key executives
- 9.1.3. Company snapshot
- 9.1.4. Operating business segments
- 9.1.5. Product portfolio
- 9.1.6. Business performance
- 9.1.7. Key strategic moves and developments
- 9.2. Apple Inc.
- 9.2.1. Company overview
- 9.2.2. Key executives
- 9.2.3. Company snapshot
- 9.2.4. Operating business segments
- 9.2.5. Product portfolio
- 9.2.6. Business performance
- 9.2.7. Key strategic moves and developments
- 9.3. Estimote Inc.
- 9.3.1. Company overview
- 9.3.2. Key executives
- 9.3.3. Company snapshot
- 9.3.4. Operating business segments
- 9.3.5. Product portfolio
- 9.3.6. Business performance
- 9.3.7. Key strategic moves and developments
- 9.4. BLUECATS
- 9.4.1. Company overview
- 9.4.2. Key executives
- 9.4.3. Company snapshot
- 9.4.4. Operating business segments
- 9.4.5. Product portfolio
- 9.4.6. Business performance
- 9.4.7. Key strategic moves and developments
- 9.5. Hewlett Packard Enterprise Development LP
- 9.5.1. Company overview
- 9.5.2. Key executives
- 9.5.3. Company snapshot
- 9.5.4. Operating business segments
- 9.5.5. Product portfolio
- 9.5.6. Business performance
- 9.5.7. Key strategic moves and developments
- 9.6. Cisco Systems Inc.
- 9.6.1. Company overview
- 9.6.2. Key executives
- 9.6.3. Company snapshot
- 9.6.4. Operating business segments
- 9.6.5. Product portfolio
- 9.6.6. Business performance
- 9.6.7. Key strategic moves and developments
- 9.7. sensorberg GmbH
- 9.7.1. Company overview
- 9.7.2. Key executives
- 9.7.3. Company snapshot
- 9.7.4. Operating business segments
- 9.7.5. Product portfolio
- 9.7.6. Business performance
- 9.7.7. Key strategic moves and developments
- 9.8. Gelo Inc.
- 9.8.1. Company overview
- 9.8.2. Key executives
- 9.8.3. Company snapshot
- 9.8.4. Operating business segments
- 9.8.5. Product portfolio
- 9.8.6. Business performance
- 9.8.7. Key strategic moves and developments
- 9.9. Accent Advanced Systems, SLU.
- 9.9.1. Company overview
- 9.9.2. Key executives
- 9.9.3. Company snapshot
- 9.9.4. Operating business segments
- 9.9.5. Product portfolio
- 9.9.6. Business performance
- 9.9.7. Key strategic moves and developments
- 9.10. Qualcomm Incorporated.
- 9.10.1. Company overview
- 9.10.2. Key executives
- 9.10.3. Company snapshot
- 9.10.4. Operating business segments
- 9.10.5. Product portfolio
- 9.10.6. Business performance
- 9.10.7. Key strategic moves and developments
