
|
市場調査レポート
商品コード
1472408
バターブロック市場:タイプ別、用途別、流通チャネル別:世界の機会分析と産業予測、2023年~2032年Butter Blocks Market By Type, By Application, By Distribution Channel : Global Opportunity Analysis and Industry Forecast, 2023-2032 |
||||||
|
|||||||

| バターブロック市場:タイプ別、用途別、流通チャネル別:世界の機会分析と産業予測、2023年~2032年 |
|
出版日: 2024年04月01日
発行: Allied Market Research
ページ情報: 英文 310 Pages
納期: 2~3営業日
|

- 全表示
- 概要
- 図表
- 目次
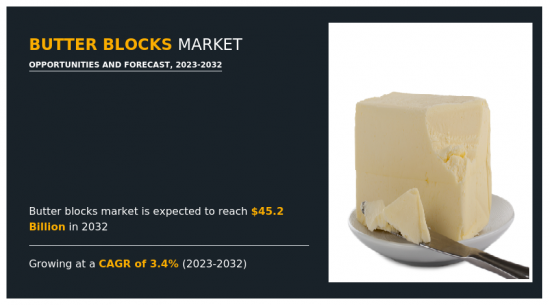
世界のバターブロック市場は、2023年から2032年にかけてCAGR 3.4%で2022年の324億1,570万米ドルから成長し、2032年には451億4,890万米ドルに達すると予測されています。
バターブロックは乳製品業界の市場セグメントのひとつで、牛乳から作られるバターの固形ブロックまたはレンガを指します。これらのブロックは通常、牛乳やクリームを撹拌し、バターミルクから脂肪分を分離し、固形のブロックに成形する工程を経て作られます。バター・ブロックは、乳源、加工方法、添加成分などの要因によって、色、味、組成が異なります。バター・ブロック市場は、多様な消費者の嗜好や食生活のニーズに応える幅広い製品を包含しています。伝統的な牛乳バターから、水牛、ヤク、羊、ヤギの乳から作られる特殊な品種まで、市場は様々な料理用途や文化的嗜好に合った選択肢を提供しています。さらに、加工技術や成分配合の革新により、フレーバーバター、オーガニックバター、植物性バターが開発され、健康志向の消費者や食事制限のある消費者への訴求力が拡大しています。
バターに含まれる天然脂肪、ビタミン、ミネラルが健康に良いという認識が広まり、健全で栄養価の高い食事の選択肢としてバター・ブロックに対する消費者の需要が高まっています。さらに、バター・ブロックは、ベーキング、調理、スプレッドなどの料理用途に広く使われる万能食材です。ホームベーカリー、職人料理、グルメ料理の人気は、独特の風味と食感を持つ高品質のバターブロックの需要を押し上げています。また、メーカー各社は、進化する消費者の嗜好や食事動向に対応するため、フレーバー・バター・ブロック、オーガニック・バター・ブロック、植物性バター・ブロックといった革新的な製品バリエーションを投入しており、バター・ブロック市場の成長を牽引しています。
バターブロック業界は、その成長と収益性を妨げると予想されるいくつかの重大な阻害要因に直面しています。例えば、牛乳やクリームなどの乳製品の価格変動は、バターブロックメーカーにとって課題となります。これらの価格の変動は、サプライチェーンの混乱や世界の需要などの要因に影響され、生産コストに直接影響を与え、利益率を圧迫し、バターブロック生産の経済的実行可能性に影響を与えます。さらに、法規制の課題もバターブロックメーカーに複雑さをもたらしています。厳しい食品安全規制や表示要件を遵守するためには、コンプライアンス対策や品質管理プロトコルに継続的に投資する必要があります。これらの基準を満たすことができなければ、罰金や製品回収、ブランドの評判を落とすことになりかねないです。こうした要因が、予測期間中のバターブロック市場シェアの妨げになると予想されます。
革新的な製品開拓、環境に優しいパッケージング、市場拡大は、予測期間中、バターブロック市場の機会にプラスの影響を与えると予想されます。ユニークな料理体験やより健康的なオプションに対する需要の増加は、バター生産者が新製品や品種を導入する機会を創出します。ハーブやスパイス、栄養補助食品で味付けしたもの、ホイップしたもの、機能性を高めたものなどのイノベーションは、消費者の嗜好や食生活の変化に対応しています。加えて、トリュフ入りや蜂蜜とラベンダーのブレンドのようなユニークな風味を持つ職人的バターや特殊バターは、プレミアムでカスタマイズされた料理体験を提供し、消費者の関心を高め、市場範囲を拡大します。さらに、環境の持続可能性に関する消費者の意識は高まっており、バター生産者は環境に優しい包装材料や審美的に美しいデザインを模索しています。密封可能なパッケージは鮮度と利便性を高め、エレガントでミニマルなデザインは棚で目立ち、環境意識の高い消費者を惹きつける。持続可能なパッケージングを採用することで、バターメーカーは環境意識の高い消費者にアピールし、市場での製品の差別化を図ることができます。
利害関係者にとっての主なメリット
- 当レポートでは、2022年から2032年までのバターブロック市場分析の市場セグメント、現在の動向、推定・動向分析を定量的に提供し、有力なバターブロック市場機会を特定します。
- 市場促進要因、市場抑制要因、市場機会に関連する情報とともに市場調査を提供します。
- ポーターのファイブフォース分析では、利害関係者が利益重視のビジネス決定を下し、サプライヤーとバイヤーのネットワークを強化できるよう、バイヤーとサプライヤーの潜在力を明らかにします。
- バターブロックの市場セグメンテーションを詳細に分析することで、市場機会を見極めることができます。
- 各地域の主要国は、世界市場への収益貢献度に応じてマッピングされています。
- 市場プレイヤーのポジショニングは、ベンチマーキングを容易にし、市場プレイヤーの現在のポジションの明確な理解を提供します。
- 本レポートには、地域および世界のバターブロック市場動向、主要企業、市場セグメント、応用分野、市場成長戦略の分析が含まれています。
本レポートで可能なカスタマイズ(追加費用とスケジュールがあります。)
- 消費者の購買行動分析
- 投資機会
- 製品ベンチマーク/製品仕様と用途
- 地域別新規参入企業
- 技術動向分析
- 消費者の嗜好と製品仕様
- 製品/セグメント別の市場セグメンテーション
- 新製品開発/主要メーカーの製品マトリックス
- ペインポイント分析
- 規制ガイドライン
- 戦略的提言
- クライアントの関心に特化した追加企業プロファイル
- 国別または地域別追加分析-市場規模と予測
- ブランドシェア分析
- クリスクロス・セグメント分析-市場規模と予測
- 企業プロファイルの拡張リスト
- 過去の市場データ
- 主要プレーヤーの詳細(所在地、連絡先、サプライヤー/ベンダーネットワークなどを含む、エクセル形式)
- 世界/地域/国別レベルでのプレーヤーの市場シェア分析
- SWOT分析
目次
第1章 イントロダクション
第2章 エグゼクティブサマリー
第3章 市場概要
- 市場の定義と範囲
- 主な調査結果
- 影響要因
- 主な投資機会
- ポーターのファイブフォース分析
- 市場力学
- 促進要因
- 抑制要因
- 機会
- 市場シェア分析
- ブランドシェア分析
- バリューチェーン分析
- 主要プレーヤーの詳細
- 規制ガイドライン
- 特許状況
第4章 バターブロック市場:タイプ別
- 概要
- 有塩
- 無塩
- その他
第5章 バターブロック市場:用途別
- 概要
- ベーキング
- 調理用
- スプレッド
- 風味付け
第6章 バターブロック市場:流通チャネル別
- 概要
- スーパーマーケット/ハイパーマーケット
- 百貨店
- コンビニエンスストア
- オンラインストア
第7章 バターブロック市場:地域別
- 概要
- 北米
- 米国
- カナダ
- メキシコ
- 欧州
- ドイツ
- 英国
- フランス
- スペイン
- イタリア
- その他
- アジア太平洋
- 中国
- 日本
- インド
- 韓国
- オーストラリア
- その他
- ラテンアメリカ・中東・アフリカ
- ブラジル
- サウジアラビア
- アラブ首長国連邦
- 南アフリカ
- その他
第8章 競争情勢
- イントロダクション
- 主要成功戦略
- 主要10社の製品マッピング
- 競合ダッシュボード
- 競合ヒートマップ
- 主要企業のポジショニング、2022年
第9章 企業プロファイル
- Fonterra Co-operative Group Limited
- Lactalis Group
- Danone S.A
- Nestle S.A.
- Arla Foods amba
- Kerry Group
- land o'lakes, inc.
- Dean Foods
- FrieslandCampina
- Megmilk Snow Brand Co., Ltd
- Grassland Dairy Products, Inc.
LIST OF TABLES
- TABLE 01. GLOBAL BUTTER BLOCKS MARKET, BY TYPE, 2022-2032 ($MILLION)
- TABLE 02. BUTTER BLOCKS MARKET FOR SALTED, BY REGION, 2022-2032 ($MILLION)
- TABLE 03. BUTTER BLOCKS MARKET FOR UNSALTED, BY REGION, 2022-2032 ($MILLION)
- TABLE 04. BUTTER BLOCKS MARKET FOR OTHERS, BY REGION, 2022-2032 ($MILLION)
- TABLE 05. GLOBAL BUTTER BLOCKS MARKET, BY APPLICATION, 2022-2032 ($MILLION)
- TABLE 06. BUTTER BLOCKS MARKET FOR BAKING, BY REGION, 2022-2032 ($MILLION)
- TABLE 07. BUTTER BLOCKS MARKET FOR COOKING, BY REGION, 2022-2032 ($MILLION)
- TABLE 08. BUTTER BLOCKS MARKET FOR SPREADING, BY REGION, 2022-2032 ($MILLION)
- TABLE 09. BUTTER BLOCKS MARKET FOR FLAVORING, BY REGION, 2022-2032 ($MILLION)
- TABLE 10. GLOBAL BUTTER BLOCKS MARKET, BY DISTRIBUTION CHANNEL, 2022-2032 ($MILLION)
- TABLE 11. BUTTER BLOCKS MARKET FOR SUPERMARKETS/HYPERMARKETS, BY REGION, 2022-2032 ($MILLION)
- TABLE 12. BUTTER BLOCKS MARKET FOR DEPARTMENTAL STORES, BY REGION, 2022-2032 ($MILLION)
- TABLE 13. BUTTER BLOCKS MARKET FOR CONVENIENCE STORES, BY REGION, 2022-2032 ($MILLION)
- TABLE 14. BUTTER BLOCKS MARKET FOR ONLINE STORES, BY REGION, 2022-2032 ($MILLION)
- TABLE 15. BUTTER BLOCKS MARKET, BY REGION, 2022-2032 ($MILLION)
- TABLE 16. NORTH AMERICA BUTTER BLOCKS MARKET, BY TYPE, 2022-2032 ($MILLION)
- TABLE 17. NORTH AMERICA BUTTER BLOCKS MARKET, BY APPLICATION, 2022-2032 ($MILLION)
- TABLE 18. NORTH AMERICA BUTTER BLOCKS MARKET, BY DISTRIBUTION CHANNEL, 2022-2032 ($MILLION)
- TABLE 19. NORTH AMERICA BUTTER BLOCKS MARKET, BY COUNTRY, 2022-2032 ($MILLION)
- TABLE 20. U.S. BUTTER BLOCKS MARKET, BY TYPE, 2022-2032 ($MILLION)
- TABLE 21. U.S. BUTTER BLOCKS MARKET, BY APPLICATION, 2022-2032 ($MILLION)
- TABLE 22. U.S. BUTTER BLOCKS MARKET, BY DISTRIBUTION CHANNEL, 2022-2032 ($MILLION)
- TABLE 23. CANADA BUTTER BLOCKS MARKET, BY TYPE, 2022-2032 ($MILLION)
- TABLE 24. CANADA BUTTER BLOCKS MARKET, BY APPLICATION, 2022-2032 ($MILLION)
- TABLE 25. CANADA BUTTER BLOCKS MARKET, BY DISTRIBUTION CHANNEL, 2022-2032 ($MILLION)
- TABLE 26. MEXICO BUTTER BLOCKS MARKET, BY TYPE, 2022-2032 ($MILLION)
- TABLE 27. MEXICO BUTTER BLOCKS MARKET, BY APPLICATION, 2022-2032 ($MILLION)
- TABLE 28. MEXICO BUTTER BLOCKS MARKET, BY DISTRIBUTION CHANNEL, 2022-2032 ($MILLION)
- TABLE 29. EUROPE BUTTER BLOCKS MARKET, BY TYPE, 2022-2032 ($MILLION)
- TABLE 30. EUROPE BUTTER BLOCKS MARKET, BY APPLICATION, 2022-2032 ($MILLION)
- TABLE 31. EUROPE BUTTER BLOCKS MARKET, BY DISTRIBUTION CHANNEL, 2022-2032 ($MILLION)
- TABLE 32. EUROPE BUTTER BLOCKS MARKET, BY COUNTRY, 2022-2032 ($MILLION)
- TABLE 33. GERMANY BUTTER BLOCKS MARKET, BY TYPE, 2022-2032 ($MILLION)
- TABLE 34. GERMANY BUTTER BLOCKS MARKET, BY APPLICATION, 2022-2032 ($MILLION)
- TABLE 35. GERMANY BUTTER BLOCKS MARKET, BY DISTRIBUTION CHANNEL, 2022-2032 ($MILLION)
- TABLE 36. UK BUTTER BLOCKS MARKET, BY TYPE, 2022-2032 ($MILLION)
- TABLE 37. UK BUTTER BLOCKS MARKET, BY APPLICATION, 2022-2032 ($MILLION)
- TABLE 38. UK BUTTER BLOCKS MARKET, BY DISTRIBUTION CHANNEL, 2022-2032 ($MILLION)
- TABLE 39. FRANCE BUTTER BLOCKS MARKET, BY TYPE, 2022-2032 ($MILLION)
- TABLE 40. FRANCE BUTTER BLOCKS MARKET, BY APPLICATION, 2022-2032 ($MILLION)
- TABLE 41. FRANCE BUTTER BLOCKS MARKET, BY DISTRIBUTION CHANNEL, 2022-2032 ($MILLION)
- TABLE 42. SPAIN BUTTER BLOCKS MARKET, BY TYPE, 2022-2032 ($MILLION)
- TABLE 43. SPAIN BUTTER BLOCKS MARKET, BY APPLICATION, 2022-2032 ($MILLION)
- TABLE 44. SPAIN BUTTER BLOCKS MARKET, BY DISTRIBUTION CHANNEL, 2022-2032 ($MILLION)
- TABLE 45. ITALY BUTTER BLOCKS MARKET, BY TYPE, 2022-2032 ($MILLION)
- TABLE 46. ITALY BUTTER BLOCKS MARKET, BY APPLICATION, 2022-2032 ($MILLION)
- TABLE 47. ITALY BUTTER BLOCKS MARKET, BY DISTRIBUTION CHANNEL, 2022-2032 ($MILLION)
- TABLE 48. REST OF EUROPE BUTTER BLOCKS MARKET, BY TYPE, 2022-2032 ($MILLION)
- TABLE 49. REST OF EUROPE BUTTER BLOCKS MARKET, BY APPLICATION, 2022-2032 ($MILLION)
- TABLE 50. REST OF EUROPE BUTTER BLOCKS MARKET, BY DISTRIBUTION CHANNEL, 2022-2032 ($MILLION)
- TABLE 51. ASIA-PACIFIC BUTTER BLOCKS MARKET, BY TYPE, 2022-2032 ($MILLION)
- TABLE 52. ASIA-PACIFIC BUTTER BLOCKS MARKET, BY APPLICATION, 2022-2032 ($MILLION)
- TABLE 53. ASIA-PACIFIC BUTTER BLOCKS MARKET, BY DISTRIBUTION CHANNEL, 2022-2032 ($MILLION)
- TABLE 54. ASIA-PACIFIC BUTTER BLOCKS MARKET, BY COUNTRY, 2022-2032 ($MILLION)
- TABLE 55. CHINA BUTTER BLOCKS MARKET, BY TYPE, 2022-2032 ($MILLION)
- TABLE 56. CHINA BUTTER BLOCKS MARKET, BY APPLICATION, 2022-2032 ($MILLION)
- TABLE 57. CHINA BUTTER BLOCKS MARKET, BY DISTRIBUTION CHANNEL, 2022-2032 ($MILLION)
- TABLE 58. JAPAN BUTTER BLOCKS MARKET, BY TYPE, 2022-2032 ($MILLION)
- TABLE 59. JAPAN BUTTER BLOCKS MARKET, BY APPLICATION, 2022-2032 ($MILLION)
- TABLE 60. JAPAN BUTTER BLOCKS MARKET, BY DISTRIBUTION CHANNEL, 2022-2032 ($MILLION)
- TABLE 61. INDIA BUTTER BLOCKS MARKET, BY TYPE, 2022-2032 ($MILLION)
- TABLE 62. INDIA BUTTER BLOCKS MARKET, BY APPLICATION, 2022-2032 ($MILLION)
- TABLE 63. INDIA BUTTER BLOCKS MARKET, BY DISTRIBUTION CHANNEL, 2022-2032 ($MILLION)
- TABLE 64. SOUTH KOREA BUTTER BLOCKS MARKET, BY TYPE, 2022-2032 ($MILLION)
- TABLE 65. SOUTH KOREA BUTTER BLOCKS MARKET, BY APPLICATION, 2022-2032 ($MILLION)
- TABLE 66. SOUTH KOREA BUTTER BLOCKS MARKET, BY DISTRIBUTION CHANNEL, 2022-2032 ($MILLION)
- TABLE 67. AUSTRALIA BUTTER BLOCKS MARKET, BY TYPE, 2022-2032 ($MILLION)
- TABLE 68. AUSTRALIA BUTTER BLOCKS MARKET, BY APPLICATION, 2022-2032 ($MILLION)
- TABLE 69. AUSTRALIA BUTTER BLOCKS MARKET, BY DISTRIBUTION CHANNEL, 2022-2032 ($MILLION)
- TABLE 70. REST OF ASIA-PACIFIC BUTTER BLOCKS MARKET, BY TYPE, 2022-2032 ($MILLION)
- TABLE 71. REST OF ASIA-PACIFIC BUTTER BLOCKS MARKET, BY APPLICATION, 2022-2032 ($MILLION)
- TABLE 72. REST OF ASIA-PACIFIC BUTTER BLOCKS MARKET, BY DISTRIBUTION CHANNEL, 2022-2032 ($MILLION)
- TABLE 73. LAMEA BUTTER BLOCKS MARKET, BY TYPE, 2022-2032 ($MILLION)
- TABLE 74. LAMEA BUTTER BLOCKS MARKET, BY APPLICATION, 2022-2032 ($MILLION)
- TABLE 75. LAMEA BUTTER BLOCKS MARKET, BY DISTRIBUTION CHANNEL, 2022-2032 ($MILLION)
- TABLE 76. LAMEA BUTTER BLOCKS MARKET, BY COUNTRY, 2022-2032 ($MILLION)
- TABLE 77. BRAZIL BUTTER BLOCKS MARKET, BY TYPE, 2022-2032 ($MILLION)
- TABLE 78. BRAZIL BUTTER BLOCKS MARKET, BY APPLICATION, 2022-2032 ($MILLION)
- TABLE 79. BRAZIL BUTTER BLOCKS MARKET, BY DISTRIBUTION CHANNEL, 2022-2032 ($MILLION)
- TABLE 80. SAUDI ARABIA BUTTER BLOCKS MARKET, BY TYPE, 2022-2032 ($MILLION)
- TABLE 81. SAUDI ARABIA BUTTER BLOCKS MARKET, BY APPLICATION, 2022-2032 ($MILLION)
- TABLE 82. SAUDI ARABIA BUTTER BLOCKS MARKET, BY DISTRIBUTION CHANNEL, 2022-2032 ($MILLION)
- TABLE 83. UNITED ARAB EMIRATES BUTTER BLOCKS MARKET, BY TYPE, 2022-2032 ($MILLION)
- TABLE 84. UNITED ARAB EMIRATES BUTTER BLOCKS MARKET, BY APPLICATION, 2022-2032 ($MILLION)
- TABLE 85. UNITED ARAB EMIRATES BUTTER BLOCKS MARKET, BY DISTRIBUTION CHANNEL, 2022-2032 ($MILLION)
- TABLE 86. SOUTH AFRICA BUTTER BLOCKS MARKET, BY TYPE, 2022-2032 ($MILLION)
- TABLE 87. SOUTH AFRICA BUTTER BLOCKS MARKET, BY APPLICATION, 2022-2032 ($MILLION)
- TABLE 88. SOUTH AFRICA BUTTER BLOCKS MARKET, BY DISTRIBUTION CHANNEL, 2022-2032 ($MILLION)
- TABLE 89. REST OF LAMEA BUTTER BLOCKS MARKET, BY TYPE, 2022-2032 ($MILLION)
- TABLE 90. REST OF LAMEA BUTTER BLOCKS MARKET, BY APPLICATION, 2022-2032 ($MILLION)
- TABLE 91. REST OF LAMEA BUTTER BLOCKS MARKET, BY DISTRIBUTION CHANNEL, 2022-2032 ($MILLION)
- TABLE 92. FONTERRA CO-OPERATIVE GROUP LIMITED: KEY EXECUTIVES
- TABLE 93. FONTERRA CO-OPERATIVE GROUP LIMITED: COMPANY SNAPSHOT
- TABLE 94. FONTERRA CO-OPERATIVE GROUP LIMITED: PRODUCT SEGMENTS
- TABLE 95. FONTERRA CO-OPERATIVE GROUP LIMITED: SERVICE SEGMENTS
- TABLE 96. FONTERRA CO-OPERATIVE GROUP LIMITED: PRODUCT PORTFOLIO
- TABLE 97. FONTERRA CO-OPERATIVE GROUP LIMITED: KEY STRATERGIES
- TABLE 98. LACTALIS GROUP: KEY EXECUTIVES
- TABLE 99. LACTALIS GROUP: COMPANY SNAPSHOT
- TABLE 100. LACTALIS GROUP: PRODUCT SEGMENTS
- TABLE 101. LACTALIS GROUP: SERVICE SEGMENTS
- TABLE 102. LACTALIS GROUP: PRODUCT PORTFOLIO
- TABLE 103. LACTALIS GROUP: KEY STRATERGIES
- TABLE 104. DANONE S.A: KEY EXECUTIVES
- TABLE 105. DANONE S.A: COMPANY SNAPSHOT
- TABLE 106. DANONE S.A: PRODUCT SEGMENTS
- TABLE 107. DANONE S.A: SERVICE SEGMENTS
- TABLE 108. DANONE S.A: PRODUCT PORTFOLIO
- TABLE 109. DANONE S.A: KEY STRATERGIES
- TABLE 110. NESTLE S.A.: KEY EXECUTIVES
- TABLE 111. NESTLE S.A.: COMPANY SNAPSHOT
- TABLE 112. NESTLE S.A.: PRODUCT SEGMENTS
- TABLE 113. NESTLE S.A.: SERVICE SEGMENTS
- TABLE 114. NESTLE S.A.: PRODUCT PORTFOLIO
- TABLE 115. NESTLE S.A.: KEY STRATERGIES
- TABLE 116. ARLA FOODS AMBA: KEY EXECUTIVES
- TABLE 117. ARLA FOODS AMBA: COMPANY SNAPSHOT
- TABLE 118. ARLA FOODS AMBA: PRODUCT SEGMENTS
- TABLE 119. ARLA FOODS AMBA: SERVICE SEGMENTS
- TABLE 120. ARLA FOODS AMBA: PRODUCT PORTFOLIO
- TABLE 121. ARLA FOODS AMBA: KEY STRATERGIES
- TABLE 122. KERRY GROUP: KEY EXECUTIVES
- TABLE 123. KERRY GROUP: COMPANY SNAPSHOT
- TABLE 124. KERRY GROUP: PRODUCT SEGMENTS
- TABLE 125. KERRY GROUP: SERVICE SEGMENTS
- TABLE 126. KERRY GROUP: PRODUCT PORTFOLIO
- TABLE 127. KERRY GROUP: KEY STRATERGIES
- TABLE 128. LAND O'LAKES, INC.: KEY EXECUTIVES
- TABLE 129. LAND O'LAKES, INC.: COMPANY SNAPSHOT
- TABLE 130. LAND O'LAKES, INC.: PRODUCT SEGMENTS
- TABLE 131. LAND O'LAKES, INC.: SERVICE SEGMENTS
- TABLE 132. LAND O'LAKES, INC.: PRODUCT PORTFOLIO
- TABLE 133. LAND O'LAKES, INC.: KEY STRATERGIES
- TABLE 134. DEAN FOODS: KEY EXECUTIVES
- TABLE 135. DEAN FOODS: COMPANY SNAPSHOT
- TABLE 136. DEAN FOODS: PRODUCT SEGMENTS
- TABLE 137. DEAN FOODS: SERVICE SEGMENTS
- TABLE 138. DEAN FOODS: PRODUCT PORTFOLIO
- TABLE 139. DEAN FOODS: KEY STRATERGIES
- TABLE 140. FRIESLANDCAMPINA: KEY EXECUTIVES
- TABLE 141. FRIESLANDCAMPINA: COMPANY SNAPSHOT
- TABLE 142. FRIESLANDCAMPINA: PRODUCT SEGMENTS
- TABLE 143. FRIESLANDCAMPINA: SERVICE SEGMENTS
- TABLE 144. FRIESLANDCAMPINA: PRODUCT PORTFOLIO
- TABLE 145. FRIESLANDCAMPINA: KEY STRATERGIES
- TABLE 146. MEGMILK SNOW BRAND CO., LTD: KEY EXECUTIVES
- TABLE 147. MEGMILK SNOW BRAND CO., LTD: COMPANY SNAPSHOT
- TABLE 148. MEGMILK SNOW BRAND CO., LTD: PRODUCT SEGMENTS
- TABLE 149. MEGMILK SNOW BRAND CO., LTD: SERVICE SEGMENTS
- TABLE 150. MEGMILK SNOW BRAND CO., LTD: PRODUCT PORTFOLIO
- TABLE 151. MEGMILK SNOW BRAND CO., LTD: KEY STRATERGIES
- TABLE 152. GRASSLAND DAIRY PRODUCTS, INC.: KEY EXECUTIVES
- TABLE 153. GRASSLAND DAIRY PRODUCTS, INC.: COMPANY SNAPSHOT
- TABLE 154. GRASSLAND DAIRY PRODUCTS, INC.: PRODUCT SEGMENTS
- TABLE 155. GRASSLAND DAIRY PRODUCTS, INC.: SERVICE SEGMENTS
- TABLE 156. GRASSLAND DAIRY PRODUCTS, INC.: PRODUCT PORTFOLIO
- TABLE 157. GRASSLAND DAIRY PRODUCTS, INC.: KEY STRATERGIES
LIST OF FIGURES
- FIGURE 01. BUTTER BLOCKS MARKET, 2022-2032
- FIGURE 02. SEGMENTATION OF BUTTER BLOCKS MARKET,2022-2032
- FIGURE 03. TOP IMPACTING FACTORS IN BUTTER BLOCKS MARKET
- FIGURE 04. TOP INVESTMENT POCKETS IN BUTTER BLOCKS MARKET (2023-2032)
- FIGURE 05. BARGAINING POWER OF SUPPLIERS
- FIGURE 06. BARGAINING POWER OF BUYERS
- FIGURE 07. THREAT OF SUBSTITUTION
- FIGURE 08. THREAT OF SUBSTITUTION
- FIGURE 09. COMPETITIVE RIVALRY
- FIGURE 10. GLOBAL BUTTER BLOCKS MARKET:DRIVERS, RESTRAINTS AND OPPORTUNITIES
- FIGURE 11. PATENT ANALYSIS BY COMPANY
- FIGURE 12. PATENT ANALYSIS BY COUNTRY
- FIGURE 13. BUTTER BLOCKS MARKET, BY TYPE, 2022 AND 2032(%)
- FIGURE 14. COMPARATIVE SHARE ANALYSIS OF BUTTER BLOCKS MARKET FOR SALTED, BY COUNTRY 2022 AND 2032(%)
- FIGURE 15. COMPARATIVE SHARE ANALYSIS OF BUTTER BLOCKS MARKET FOR UNSALTED, BY COUNTRY 2022 AND 2032(%)
- FIGURE 16. COMPARATIVE SHARE ANALYSIS OF BUTTER BLOCKS MARKET FOR OTHERS, BY COUNTRY 2022 AND 2032(%)
- FIGURE 17. BUTTER BLOCKS MARKET, BY APPLICATION, 2022 AND 2032(%)
- FIGURE 18. COMPARATIVE SHARE ANALYSIS OF BUTTER BLOCKS MARKET FOR BAKING, BY COUNTRY 2022 AND 2032(%)
- FIGURE 19. COMPARATIVE SHARE ANALYSIS OF BUTTER BLOCKS MARKET FOR COOKING, BY COUNTRY 2022 AND 2032(%)
- FIGURE 20. COMPARATIVE SHARE ANALYSIS OF BUTTER BLOCKS MARKET FOR SPREADING, BY COUNTRY 2022 AND 2032(%)
- FIGURE 21. COMPARATIVE SHARE ANALYSIS OF BUTTER BLOCKS MARKET FOR FLAVORING, BY COUNTRY 2022 AND 2032(%)
- FIGURE 22. BUTTER BLOCKS MARKET, BY DISTRIBUTION CHANNEL, 2022 AND 2032(%)
- FIGURE 23. COMPARATIVE SHARE ANALYSIS OF BUTTER BLOCKS MARKET FOR SUPERMARKETS/HYPERMARKETS, BY COUNTRY 2022 AND 2032(%)
- FIGURE 24. COMPARATIVE SHARE ANALYSIS OF BUTTER BLOCKS MARKET FOR DEPARTMENTAL STORES, BY COUNTRY 2022 AND 2032(%)
- FIGURE 25. COMPARATIVE SHARE ANALYSIS OF BUTTER BLOCKS MARKET FOR CONVENIENCE STORES, BY COUNTRY 2022 AND 2032(%)
- FIGURE 26. COMPARATIVE SHARE ANALYSIS OF BUTTER BLOCKS MARKET FOR ONLINE STORES, BY COUNTRY 2022 AND 2032(%)
- FIGURE 27. BUTTER BLOCKS MARKET BY REGION, 2022 AND 2032(%)
- FIGURE 28. U.S. BUTTER BLOCKS MARKET, 2022-2032 ($MILLION)
- FIGURE 29. CANADA BUTTER BLOCKS MARKET, 2022-2032 ($MILLION)
- FIGURE 30. MEXICO BUTTER BLOCKS MARKET, 2022-2032 ($MILLION)
- FIGURE 31. GERMANY BUTTER BLOCKS MARKET, 2022-2032 ($MILLION)
- FIGURE 32. UK BUTTER BLOCKS MARKET, 2022-2032 ($MILLION)
- FIGURE 33. FRANCE BUTTER BLOCKS MARKET, 2022-2032 ($MILLION)
- FIGURE 34. SPAIN BUTTER BLOCKS MARKET, 2022-2032 ($MILLION)
- FIGURE 35. ITALY BUTTER BLOCKS MARKET, 2022-2032 ($MILLION)
- FIGURE 36. REST OF EUROPE BUTTER BLOCKS MARKET, 2022-2032 ($MILLION)
- FIGURE 37. CHINA BUTTER BLOCKS MARKET, 2022-2032 ($MILLION)
- FIGURE 38. JAPAN BUTTER BLOCKS MARKET, 2022-2032 ($MILLION)
- FIGURE 39. INDIA BUTTER BLOCKS MARKET, 2022-2032 ($MILLION)
- FIGURE 40. SOUTH KOREA BUTTER BLOCKS MARKET, 2022-2032 ($MILLION)
- FIGURE 41. AUSTRALIA BUTTER BLOCKS MARKET, 2022-2032 ($MILLION)
- FIGURE 42. REST OF ASIA-PACIFIC BUTTER BLOCKS MARKET, 2022-2032 ($MILLION)
- FIGURE 43. BRAZIL BUTTER BLOCKS MARKET, 2022-2032 ($MILLION)
- FIGURE 44. SAUDI ARABIA BUTTER BLOCKS MARKET, 2022-2032 ($MILLION)
- FIGURE 45. UNITED ARAB EMIRATES BUTTER BLOCKS MARKET, 2022-2032 ($MILLION)
- FIGURE 46. SOUTH AFRICA BUTTER BLOCKS MARKET, 2022-2032 ($MILLION)
- FIGURE 47. REST OF LAMEA BUTTER BLOCKS MARKET, 2022-2032 ($MILLION)
- FIGURE 48. TOP WINNING STRATEGIES, BY YEAR
- FIGURE 49. TOP WINNING STRATEGIES, BY DEVELOPMENT
- FIGURE 50. TOP WINNING STRATEGIES, BY COMPANY
- FIGURE 51. PRODUCT MAPPING OF TOP 10 PLAYERS
- FIGURE 52. COMPETITIVE DASHBOARD
- FIGURE 53. COMPETITIVE HEATMAP: BUTTER BLOCKS MARKET
- FIGURE 54. TOP PLAYER POSITIONING, 2022
The global butter blocks market is anticipated to reach $45,148.9 million by 2032, growing from $32,415.7 million in 2022 at a CAGR of 3.4% from 2023 to 2032.
Butter blocks are a market segment within the dairy industry, referring to solid blocks or bricks of butter derived from milk. These blocks are typically made through the process of churning milk or cream, separating the fat from the buttermilk, and forming it into solid blocks. Butter blocks can vary in color, taste, and composition depending on factors such as the source of milk, processing methods, and added ingredients. The butter blocks market encompasses a wide range of products catering to diverse consumer preferences and dietary needs. From traditional cow's milk butter to specialized varieties made from buffalo, yak, sheep, or goat's milk, the market offers options to suit various culinary applications and cultural preferences. In addition, innovations in processing techniques and ingredient formulations have led to the development of flavored, organic, and plant-based butter blocks, expanding the market's appeal to health-conscious consumers and those with dietary restrictions.
Growing awareness regarding the health benefits of natural fats, vitamins, and minerals found in butter has led to increased consumer demand for butter blocks as a wholesome and nutritious dietary option. In addition, butter blocks are a versatile ingredient widely used in culinary applications such as baking, cooking, and spreading. The popularity of home baking, artisanal cooking, and gourmet cuisine has boosted the demand for high-quality butter blocks with distinct flavors and textures. Also, the manufacturers are introducing innovative product variants such as flavored butter blocks, organic butter blocks, and plant-based butter blocks to cater to evolving consumer preferences and dietary trends, thereby driving the butter blocks market growth.
The butter blocks industry faces several significant restraints that are anticipated to hinder its growth and profitability. For instance, price volatility in dairy commodities, such as milk and cream, poses a challenge for butter block manufacturers. Fluctuations in these prices, influenced by factors like supply chain disruptions and global demand, directly impact production costs, squeezing profit margins and affecting the economic viability of butter block production. In addition, regulatory challenges add another layer of complexity for butter block manufacturers. Compliance with stringent food safety regulations and labeling requirements requires ongoing investment in compliance measures and quality control protocols. Failure to meet these standards can result in fines, product recalls, and damage to brand reputation. These factors are anticipated to hamper the butter blocks market share during the forecast period.
The innovative product development, eco-friendly packaging, and market expansion are anticipated to have a positive impact on the butter blocks market opportunities during the forecast period. The increasing demand for unique culinary experiences and healthier options creates opportunities for butter producers to introduce new products and varieties. Innovations such as flavored, whipped, and functional variations enriched with herbs, spices, or nutritional supplements cater to changing consumer tastes and dietary preferences. In addition, artisanal and specialty butter with unique flavor profiles like truffle-infused or honey-lavender blends offer premium and customized culinary experiences, driving consumer interest and expanding market reach. In addition, consumer awareness regarding environmental sustainability is growing, prompting butter producers to explore eco-friendly packaging materials and aesthetically pleasing designs. Resealable packaging enhances freshness and convenience, while elegant, minimalist designs stand out on shelves, attracting environmentally conscious consumers. By adopting sustainable packaging practices, butter manufacturers can appeal to eco-conscious consumers and differentiate their products in the market.
The key players profiled in this report include Fonterra Co-operative Group Limited Lactalis Group, Danone S.A., Nestle S.A., Arla Foods amba, Kerry Group, Land O'Lakes, Inc., Dean Foods, FrieslandCampina, Megmilk Snow Brand Co., Ltd., and Grassland Dairy Products, Inc. The market players are continuously striving to achieve a dominant position in this competitive market using strategies such as acquisition, partnerships, and business expansion.
Key Benefits For Stakeholders
- This report provides a quantitative analysis of the market segments, current trends, estimations, and dynamics of the butter blocks market analysis from 2022 to 2032 to identify the prevailing butter blocks market opportunities.
- The market research is offered along with information related to key drivers, restraints, and opportunities.
- Porter's five forces analysis highlights the potency of buyers and suppliers to enable stakeholders make profit-oriented business decisions and strengthen their supplier-buyer network.
- In-depth analysis of the butter blocks market segmentation assists to determine the prevailing market opportunities.
- Major countries in each region are mapped according to their revenue contribution to the global market.
- Market player positioning facilitates benchmarking and provides a clear understanding of the present position of the market players.
- The report includes the analysis of the regional as well as global butter blocks market trends, key players, market segments, application areas, and market growth strategies.
Additional benefits you will get with this purchase are:
- Quarterly Update and* (only available with a corporate license, on listed price)
- 5 additional Company Profile of client Choice pre- or Post-purchase, as a free update.
- Free Upcoming Version on the Purchase of Five and Enterprise User License.
- 16 analyst hours of support* (post-purchase, if you find additional data requirements upon review of the report, you may receive support amounting to 16 analyst hours to solve questions, and post-sale queries)
- 15% Free Customization* (in case the scope or segment of the report does not match your requirements, 15% is equivalent to 3 working days of free work, applicable once)
- Free data Pack on the Five and Enterprise User License. (Excel version of the report)
- Free Updated report if the report is 6-12 months old or older.
- 24-hour priority response*
- Free Industry updates and white papers.
Possible Customization with this report (with additional cost and timeline, please talk to the sales executive to know more)
- Consumer Buying Behavior Analysis
- Investment Opportunities
- Product Benchmarking / Product specification and applications
- Upcoming/New Entrant by Regions
- Technology Trend Analysis
- Consumer Preference and Product Specifications
- Market share analysis of players by products/segments
- New Product Development/ Product Matrix of Key Players
- Pain Point Analysis
- Regulatory Guidelines
- Strategic Recommendations
- Additional company profiles with specific to client's interest
- Additional country or region analysis- market size and forecast
- Brands Share Analysis
- Criss-cross segment analysis- market size and forecast
- Expanded list for Company Profiles
- Historic market data
- Key player details (including location, contact details, supplier/vendor network etc. in excel format)
- Market share analysis of players at global/region/country level
- SWOT Analysis
Key Market Segments
By Distribution Channel
- Online Stores
- Supermarkets/Hypermarkets
- Departmental Stores
- Convenience Stores
By Type
- Salted
- Unsalted
- Others
By Application
- Baking
- Cooking
- Spreading
- Flavoring
By Region
- North America
- U.S.
- Canada
- Mexico
- Europe
- Germany
- UK
- France
- Spain
- Italy
- Rest of Europe
- Asia-Pacific
- China
- Japan
- India
- South Korea
- Australia
- Rest of Asia-Pacific
- LAMEA
- Brazil
- Saudi Arabia
- United Arab Emirates
- South Africa
- Rest of LAMEA
Key Market Players:
- Fonterra Co-operative Group Limited
- Lactalis Group
- Danone S.A
- Nestle S.A.
- Arla Foods amba
- Kerry Group
- land o'lakes, inc.
- Dean Foods
- FrieslandCampina
- Megmilk Snow Brand Co., Ltd
- Grassland Dairy Products, Inc.
TABLE OF CONTENTS
CHAPTER 1: INTRODUCTION
- 1.1. Report description
- 1.2. Key market segments
- 1.3. Key benefits to the stakeholders
- 1.4. Research methodology
- 1.4.1. Primary research
- 1.4.2. Secondary research
- 1.4.3. Analyst tools and models
CHAPTER 2: EXECUTIVE SUMMARY
- 2.1. CXO perspective
CHAPTER 3: MARKET OVERVIEW
- 3.1. Market definition and scope
- 3.2. Key findings
- 3.2.1. Top impacting factors
- 3.2.2. Top investment pockets
- 3.3. Porter's five forces analysis
- 3.4. Market dynamics
- 3.4.1. Drivers
- 3.4.2. Restraints
- 3.4.3. Opportunities
- 3.5. Market Share Analysis
- 3.6. Brand Share Analysis
- 3.7. Value Chain Analysis
- 3.8. Key Players Details
- 3.9. Regulatory Guidelines
- 3.10. Patent Landscape
CHAPTER 4: BUTTER BLOCKS MARKET, BY TYPE
- 4.1. Overview
- 4.1.1. Market size and forecast
- 4.2. Salted
- 4.2.1. Key market trends, growth factors and opportunities
- 4.2.2. Market size and forecast, by region
- 4.2.3. Market share analysis by country
- 4.3. Unsalted
- 4.3.1. Key market trends, growth factors and opportunities
- 4.3.2. Market size and forecast, by region
- 4.3.3. Market share analysis by country
- 4.4. Others
- 4.4.1. Key market trends, growth factors and opportunities
- 4.4.2. Market size and forecast, by region
- 4.4.3. Market share analysis by country
CHAPTER 5: BUTTER BLOCKS MARKET, BY APPLICATION
- 5.1. Overview
- 5.1.1. Market size and forecast
- 5.2. Baking
- 5.2.1. Key market trends, growth factors and opportunities
- 5.2.2. Market size and forecast, by region
- 5.2.3. Market share analysis by country
- 5.3. Cooking
- 5.3.1. Key market trends, growth factors and opportunities
- 5.3.2. Market size and forecast, by region
- 5.3.3. Market share analysis by country
- 5.4. Spreading
- 5.4.1. Key market trends, growth factors and opportunities
- 5.4.2. Market size and forecast, by region
- 5.4.3. Market share analysis by country
- 5.5. Flavoring
- 5.5.1. Key market trends, growth factors and opportunities
- 5.5.2. Market size and forecast, by region
- 5.5.3. Market share analysis by country
CHAPTER 6: BUTTER BLOCKS MARKET, BY DISTRIBUTION CHANNEL
- 6.1. Overview
- 6.1.1. Market size and forecast
- 6.2. Supermarkets/Hypermarkets
- 6.2.1. Key market trends, growth factors and opportunities
- 6.2.2. Market size and forecast, by region
- 6.2.3. Market share analysis by country
- 6.3. Departmental Stores
- 6.3.1. Key market trends, growth factors and opportunities
- 6.3.2. Market size and forecast, by region
- 6.3.3. Market share analysis by country
- 6.4. Convenience Stores
- 6.4.1. Key market trends, growth factors and opportunities
- 6.4.2. Market size and forecast, by region
- 6.4.3. Market share analysis by country
- 6.5. Online Stores
- 6.5.1. Key market trends, growth factors and opportunities
- 6.5.2. Market size and forecast, by region
- 6.5.3. Market share analysis by country
CHAPTER 7: BUTTER BLOCKS MARKET, BY REGION
- 7.1. Overview
- 7.1.1. Market size and forecast By Region
- 7.2. North America
- 7.2.1. Key market trends, growth factors and opportunities
- 7.2.2. Market size and forecast, by Type
- 7.2.3. Market size and forecast, by Application
- 7.2.4. Market size and forecast, by Distribution Channel
- 7.2.5. Market size and forecast, by country
- 7.2.5.1. U.S.
- 7.2.5.1.1. Market size and forecast, by Type
- 7.2.5.1.2. Market size and forecast, by Application
- 7.2.5.1.3. Market size and forecast, by Distribution Channel
- 7.2.5.2. Canada
- 7.2.5.2.1. Market size and forecast, by Type
- 7.2.5.2.2. Market size and forecast, by Application
- 7.2.5.2.3. Market size and forecast, by Distribution Channel
- 7.2.5.3. Mexico
- 7.2.5.3.1. Market size and forecast, by Type
- 7.2.5.3.2. Market size and forecast, by Application
- 7.2.5.3.3. Market size and forecast, by Distribution Channel
- 7.3. Europe
- 7.3.1. Key market trends, growth factors and opportunities
- 7.3.2. Market size and forecast, by Type
- 7.3.3. Market size and forecast, by Application
- 7.3.4. Market size and forecast, by Distribution Channel
- 7.3.5. Market size and forecast, by country
- 7.3.5.1. Germany
- 7.3.5.1.1. Market size and forecast, by Type
- 7.3.5.1.2. Market size and forecast, by Application
- 7.3.5.1.3. Market size and forecast, by Distribution Channel
- 7.3.5.2. UK
- 7.3.5.2.1. Market size and forecast, by Type
- 7.3.5.2.2. Market size and forecast, by Application
- 7.3.5.2.3. Market size and forecast, by Distribution Channel
- 7.3.5.3. France
- 7.3.5.3.1. Market size and forecast, by Type
- 7.3.5.3.2. Market size and forecast, by Application
- 7.3.5.3.3. Market size and forecast, by Distribution Channel
- 7.3.5.4. Spain
- 7.3.5.4.1. Market size and forecast, by Type
- 7.3.5.4.2. Market size and forecast, by Application
- 7.3.5.4.3. Market size and forecast, by Distribution Channel
- 7.3.5.5. Italy
- 7.3.5.5.1. Market size and forecast, by Type
- 7.3.5.5.2. Market size and forecast, by Application
- 7.3.5.5.3. Market size and forecast, by Distribution Channel
- 7.3.5.6. Rest of Europe
- 7.3.5.6.1. Market size and forecast, by Type
- 7.3.5.6.2. Market size and forecast, by Application
- 7.3.5.6.3. Market size and forecast, by Distribution Channel
- 7.4. Asia-Pacific
- 7.4.1. Key market trends, growth factors and opportunities
- 7.4.2. Market size and forecast, by Type
- 7.4.3. Market size and forecast, by Application
- 7.4.4. Market size and forecast, by Distribution Channel
- 7.4.5. Market size and forecast, by country
- 7.4.5.1. China
- 7.4.5.1.1. Market size and forecast, by Type
- 7.4.5.1.2. Market size and forecast, by Application
- 7.4.5.1.3. Market size and forecast, by Distribution Channel
- 7.4.5.2. Japan
- 7.4.5.2.1. Market size and forecast, by Type
- 7.4.5.2.2. Market size and forecast, by Application
- 7.4.5.2.3. Market size and forecast, by Distribution Channel
- 7.4.5.3. India
- 7.4.5.3.1. Market size and forecast, by Type
- 7.4.5.3.2. Market size and forecast, by Application
- 7.4.5.3.3. Market size and forecast, by Distribution Channel
- 7.4.5.4. South Korea
- 7.4.5.4.1. Market size and forecast, by Type
- 7.4.5.4.2. Market size and forecast, by Application
- 7.4.5.4.3. Market size and forecast, by Distribution Channel
- 7.4.5.5. Australia
- 7.4.5.5.1. Market size and forecast, by Type
- 7.4.5.5.2. Market size and forecast, by Application
- 7.4.5.5.3. Market size and forecast, by Distribution Channel
- 7.4.5.6. Rest of Asia-Pacific
- 7.4.5.6.1. Market size and forecast, by Type
- 7.4.5.6.2. Market size and forecast, by Application
- 7.4.5.6.3. Market size and forecast, by Distribution Channel
- 7.5. LAMEA
- 7.5.1. Key market trends, growth factors and opportunities
- 7.5.2. Market size and forecast, by Type
- 7.5.3. Market size and forecast, by Application
- 7.5.4. Market size and forecast, by Distribution Channel
- 7.5.5. Market size and forecast, by country
- 7.5.5.1. Brazil
- 7.5.5.1.1. Market size and forecast, by Type
- 7.5.5.1.2. Market size and forecast, by Application
- 7.5.5.1.3. Market size and forecast, by Distribution Channel
- 7.5.5.2. Saudi Arabia
- 7.5.5.2.1. Market size and forecast, by Type
- 7.5.5.2.2. Market size and forecast, by Application
- 7.5.5.2.3. Market size and forecast, by Distribution Channel
- 7.5.5.3. United Arab Emirates
- 7.5.5.3.1. Market size and forecast, by Type
- 7.5.5.3.2. Market size and forecast, by Application
- 7.5.5.3.3. Market size and forecast, by Distribution Channel
- 7.5.5.4. South Africa
- 7.5.5.4.1. Market size and forecast, by Type
- 7.5.5.4.2. Market size and forecast, by Application
- 7.5.5.4.3. Market size and forecast, by Distribution Channel
- 7.5.5.5. Rest of LAMEA
- 7.5.5.5.1. Market size and forecast, by Type
- 7.5.5.5.2. Market size and forecast, by Application
- 7.5.5.5.3. Market size and forecast, by Distribution Channel
CHAPTER 8: COMPETITIVE LANDSCAPE
- 8.1. Introduction
- 8.2. Top winning strategies
- 8.3. Product mapping of top 10 player
- 8.4. Competitive dashboard
- 8.5. Competitive heatmap
- 8.6. Top player positioning, 2022
CHAPTER 9: COMPANY PROFILES
- 9.1. Fonterra Co-operative Group Limited
- 9.1.1. Company overview
- 9.1.2. Key executives
- 9.1.3. Company snapshot
- 9.1.4. Operating business segments
- 9.1.5. Product portfolio
- 9.1.6. Business performance
- 9.1.7. Key strategic moves and developments
- 9.2. Lactalis Group
- 9.2.1. Company overview
- 9.2.2. Key executives
- 9.2.3. Company snapshot
- 9.2.4. Operating business segments
- 9.2.5. Product portfolio
- 9.2.6. Business performance
- 9.2.7. Key strategic moves and developments
- 9.3. Danone S.A
- 9.3.1. Company overview
- 9.3.2. Key executives
- 9.3.3. Company snapshot
- 9.3.4. Operating business segments
- 9.3.5. Product portfolio
- 9.3.6. Business performance
- 9.3.7. Key strategic moves and developments
- 9.4. Nestle S.A.
- 9.4.1. Company overview
- 9.4.2. Key executives
- 9.4.3. Company snapshot
- 9.4.4. Operating business segments
- 9.4.5. Product portfolio
- 9.4.6. Business performance
- 9.4.7. Key strategic moves and developments
- 9.5. Arla Foods amba
- 9.5.1. Company overview
- 9.5.2. Key executives
- 9.5.3. Company snapshot
- 9.5.4. Operating business segments
- 9.5.5. Product portfolio
- 9.5.6. Business performance
- 9.5.7. Key strategic moves and developments
- 9.6. Kerry Group
- 9.6.1. Company overview
- 9.6.2. Key executives
- 9.6.3. Company snapshot
- 9.6.4. Operating business segments
- 9.6.5. Product portfolio
- 9.6.6. Business performance
- 9.6.7. Key strategic moves and developments
- 9.7. land o'lakes, inc.
- 9.7.1. Company overview
- 9.7.2. Key executives
- 9.7.3. Company snapshot
- 9.7.4. Operating business segments
- 9.7.5. Product portfolio
- 9.7.6. Business performance
- 9.7.7. Key strategic moves and developments
- 9.8. Dean Foods
- 9.8.1. Company overview
- 9.8.2. Key executives
- 9.8.3. Company snapshot
- 9.8.4. Operating business segments
- 9.8.5. Product portfolio
- 9.8.6. Business performance
- 9.8.7. Key strategic moves and developments
- 9.9. FrieslandCampina
- 9.9.1. Company overview
- 9.9.2. Key executives
- 9.9.3. Company snapshot
- 9.9.4. Operating business segments
- 9.9.5. Product portfolio
- 9.9.6. Business performance
- 9.9.7. Key strategic moves and developments
- 9.10. Megmilk Snow Brand Co., Ltd
- 9.10.1. Company overview
- 9.10.2. Key executives
- 9.10.3. Company snapshot
- 9.10.4. Operating business segments
- 9.10.5. Product portfolio
- 9.10.6. Business performance
- 9.10.7. Key strategic moves and developments
- 9.11. Grassland Dairy Products, Inc.
- 9.11.1. Company overview
- 9.11.2. Key executives
- 9.11.3. Company snapshot
- 9.11.4. Operating business segments
- 9.11.5. Product portfolio
- 9.11.6. Business performance
- 9.11.7. Key strategic moves and developments
