|
|
市場調査レポート
商品コード
1472383
冷凍マグロ市場:タイプ別、用途別:世界の機会分析と産業予測、2023年~2032年Frozen Tuna Market By Type, By Application : Global Opportunity Analysis and Industry Forecast, 2023-2032 |
||||||
|
|
|||||||
|
|||||||


| 冷凍マグロ市場:タイプ別、用途別:世界の機会分析と産業予測、2023年~2032年 |
|
出版日: 2024年03月01日
発行: Allied Market Research
ページ情報: 英文 310 Pages
納期: 2~3営業日
|

- 全表示
- 概要
- 図表
- 目次
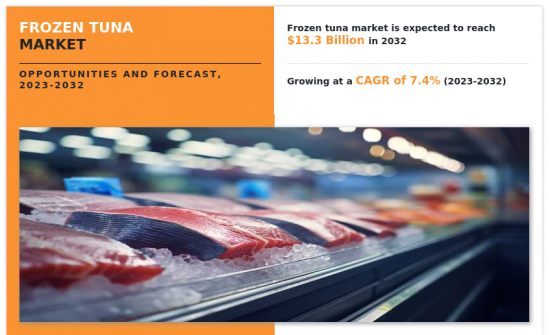
世界の冷凍マグロ市場は、2023年から2032年までのCAGRが7.4%で、2022年の65億7,900万米ドルから成長し、2032年には133億4,280万米ドルに達すると予測されます。
「冷凍マグロ」は通常、保存のために冷凍されたマグロのことを指します。まぐろは人気の高い魚介類であり、冷凍は保存期間を延長し鮮度を維持するための一般的な方法です。マグロを急速冷凍することで、腐敗の原因となるバクテリアやその他の微生物の繁殖を抑えることができます。冷凍マグロは、刺身や寿司など様々な料理によく使われます。さらに、冷凍することで食感や風味が保たれ、魚の品質を保つことができます。さらに、冷凍マグロは保存や輸送に便利なため、生鮮マグロが旬の時期でも一年中利用できます。
冷凍まぐろは、たんぱく質、オメガ3脂肪酸、ビタミン、ミネラルを豊富に含み、その栄養価の高さが認められています。消費者は健康志向を高め、全身の健康に寄与する食品を求めるようになっています。マグロに含まれるオメガ3脂肪酸は、心臓の健康と認知機能をサポートすることで特に知られています。マグロをはじめとする魚介類の栄養価の高さについての認識が高まるにつれて、消費者はより多くの魚を食生活に取り入れるようになっています。魚介類は赤身肉に代わるヘルシーな食材として宣伝されることが多く、マグロの栄養価の高さはこの動向に合致しています。冷凍まぐろは長期保存が可能なため、消費者に利便性を提供し、食事の計画を立てやすくし、食料品の買い物の頻度を減らすことができます。さらに、冷凍まぐろはさまざまな料理用途に使われるため、多様で便利な食事の選択肢を求める消費者にとって万能な選択肢となります。世界化が進み、消費者は数種類のまぐろを含む多種多様な水産物を手に入れることができます。そのため、消費者の選択肢が広がり、さまざまなまぐろ製品に接する機会が増え、発展に寄与しています。さらに、消費者は食品の持続可能性に関心を持っています。持続可能で責任ある漁業を重視するマグロ漁業やブランドは、環境意識の高い消費者を惹きつけています。海洋管理協議会(MSC)のような認証は購買決定に影響を与え、持続可能な方法で調達された冷凍マグロへの需要を後押ししています。
しかし、世界的にマグロの個体数は乱獲の脅威にさらされており、マグロの捕獲率が自然繁殖率を上回っています。これはマグロ資源の枯渇につながり、海洋生態系のバランスを崩し、マグロに依存している他の海洋生物種にも影響を及ぼすと予想されます。マグロ漁では、混獲として知られる非対象種が意図せず捕獲されることが多いです。混獲には絶滅危惧種や非商業種も含まれ、生物多様性の損失や海洋生態系の崩壊につながります。従って、混獲への対応は持続可能なマグロ漁法にとって極めて重要です。巻き網漁や延縄漁など、特定のマグロ漁法は生息地の破壊を引き起こします。例えば、巻き網漁における集魚装置(FAD)の使用は非対象種の巻き込みにつながり、延縄漁は海底の損傷を引き起こします。こうした行為は、海洋生息地の劣化に顕著に寄与しています。政府や国際機関は、持続可能な漁業を推進し、漁業が環境に与える影響を軽減するため、厳しい規制を実施しています。こうした規制を遵守することは、持続可能で責任ある漁業を実践していない冷凍マグロ市場関係者にとって課題となります。MSCのような認証制度は、持続可能で適切に管理された漁業のための基準を定めています。これらの認証要件を満たすことは、冷凍まぐろ市場のプレーヤーにとっては制約となるが、消費者の信頼を得、特定の市場に参入するためには重要です。
逆に、消費者の嗜好の変化により、冷凍マグロに対する需要は世界的に高まっています。マグロは、筋肉の発達、組織の修復、健康全般に不可欠な高品質のタンパク源を豊富に含んでいます。たんぱく質が豊富な食生活が重視されるなか、冷凍まぐろは、たんぱく質の必要量を満たそうとする消費者にとって、便利で汎用性の高い選択肢として位置づけられています。マグロにはオメガ3脂肪酸、特に心臓の健康に役立つことで知られるEPAとDHAが豊富に含まれています。冷凍マグロをこうした必須脂肪酸の天然源として売り出せば、心臓血管の健康をサポートする食品を求める健康志向の消費者を引きつけることができます。マグロは低カロリー・低脂肪であるため、体重管理や健康的な食生活の維持に重点を置く消費者にも適しています。さらに、冷凍マグロは栄養価を損なうことなく長期保存が可能で、利便性が高いです。多忙なライフスタイルの中で、消費者は手早く簡単な食事の解決策を求めています。したがって、冷凍マグロを時間節約と栄養密度の高い蛋白源として宣伝することは、手間がかからず健康的な食事の選択肢を探している消費者の共感を得ることになります。消費者は持続可能で責任ある水産物の調達に大きな関心を寄せています。そのため、冷凍マグロ市場の各ブランドは、環境にやさしい漁法や透明性の高いサプライチェーンを強調することで競争力を高めると予想されます。
利害関係者にとっての主なメリット
- 当レポートは、2022年から2032年までの冷凍マグロ市場分析の市場セグメント、現在の動向、推定・動向分析の定量的分析を提供し、一般的な冷凍マグロ市場の機会を特定します。
- 市場促進要因、市場抑制要因、市場機会に関連する情報とともに市場調査を提供します。
- ポーターのファイブフォース分析では、利害関係者が利益重視のビジネス決定を下し、サプライヤーとバイヤーのネットワークを強化できるよう、バイヤーとサプライヤーの潜在力を明らかにします。
- 冷凍マグロ市場のセグメンテーションを詳細に分析することで、市場機会を見極めることができます。
- 各地域の主要国は、世界市場への収益貢献度に応じてマッピングされています。
- 市場プレイヤーのポジショニングはベンチマークを容易にし、市場プレイヤーの現在のポジションを明確に理解することができます。
- 本レポートには、地域別および世界の冷凍マグロ市場動向、主要企業、市場セグメント、応用分野、市場成長戦略の分析が含まれています。
本レポートで可能なレポートカスタマイズ(追加費用とスケジュールがあります。)
- 消費者の購買行動分析
- エンドユーザーの嗜好とペインポイント
- 投資機会
- 地域別新規参入企業
- 技術動向分析
- 市場参入戦略
- 製品/セグメント別の市場セグメンテーション
- ペインポイント分析
- 規制ガイドライン
- 戦略的提言
- クライアントの関心に特化した追加企業プロファイル
- 国別または地域別追加分析-市場規模と予測
- クリスクロス・セグメント分析-市場規模と予測
- 企業プロファイルの拡張リスト
- 過去の市場データ
- 主要プレーヤーの詳細(所在地、連絡先、サプライヤー/ベンダーネットワークなどを含む、エクセル形式)
- 世界/地域/国別レベルでのプレーヤーの市場シェア分析
目次
第1章 イントロダクション
第2章 エグゼクティブサマリー
第3章 市場概要
- 市場の定義と範囲
- 主な調査結果
- 影響要因
- 主な投資機会
- ポーターのファイブフォース分析
- 市場力学
- 促進要因
- 抑制要因
- 機会
- 平均販売価格
- 市場シェア分析
- ブランドシェア分析
- 貿易データ分析
- 製品消費
- バリューチェーン分析
- 規制ガイドライン
- 主要規制分析
- 償還シナリオ
- 特許情勢
第4章 冷凍マグロ市場:タイプ別
- 概要
- 冷凍ビンナガ
- 冷凍メバチ・アヒ
- 冷凍クロマグロ
- 冷凍スキップジャック
- 冷凍キハダマグロ
第5章 冷凍マグロ市場:用途別
- 概要
- スーパーマーケット/ハイパーマーケット
- コンビニエンスストア
- 専門店
- オンライン小売
第6章 冷凍マグロ市場:地域別
- 概要
- 北米
- 米国
- カナダ
- メキシコ
- 欧州
- ドイツ
- 英国
- ロシア
- デンマーク
- ノルウェー
- その他
- アジア太平洋
- 中国
- 日本
- インド
- 台湾
- インドネシア
- その他
- ラテンアメリカ・中東・アフリカ
- ブラジル
- UAE
- チリ
- 南アフリカ
- その他
第7章 競合情勢
- イントロダクション
- 主要成功戦略
- 主要10社の製品マッピング
- 競合ダッシュボード
- 競合ヒートマップ
- 主要企業のポジショニング、2022年
第8章 企業プロファイル
- Brig-Star LLC
- chicken of the sea
- Dongwon Enterprise Company
- High Liner Foods
- Marine Harvest
- Nippon Suisan Kaisha aka Nissui
- Pescanova SA
- SalMar ASA
- Zoneco Group
- Tassal Group
LIST OF TABLES
- TABLE 01. GLOBAL FROZEN TUNA MARKET, BY TYPE, 2022-2032 ($MILLION)
- TABLE 02. FROZEN TUNA MARKET FOR FROZEN ALBACORE, BY REGION, 2022-2032 ($MILLION)
- TABLE 03. FROZEN TUNA MARKET FOR FROZEN BIG EYE AHI, BY REGION, 2022-2032 ($MILLION)
- TABLE 04. FROZEN TUNA MARKET FOR FROZEN BLUEFIN TUNA, BY REGION, 2022-2032 ($MILLION)
- TABLE 05. FROZEN TUNA MARKET FOR FROZEN SKIPJACK, BY REGION, 2022-2032 ($MILLION)
- TABLE 06. FROZEN TUNA MARKET FOR FROZEN YELLOWFIN TUNA, BY REGION, 2022-2032 ($MILLION)
- TABLE 07. GLOBAL FROZEN TUNA MARKET, BY APPLICATION, 2022-2032 ($MILLION)
- TABLE 08. FROZEN TUNA MARKET FOR SUPERMARKETS/ HYPERMARKETS, BY REGION, 2022-2032 ($MILLION)
- TABLE 09. FROZEN TUNA MARKET FOR CONVENIENCE STORES, BY REGION, 2022-2032 ($MILLION)
- TABLE 10. FROZEN TUNA MARKET FOR SPECIALTY STORES, BY REGION, 2022-2032 ($MILLION)
- TABLE 11. FROZEN TUNA MARKET FOR ONLINE RETAIL, BY REGION, 2022-2032 ($MILLION)
- TABLE 12. FROZEN TUNA MARKET, BY REGION, 2022-2032 ($MILLION)
- TABLE 13. NORTH AMERICA FROZEN TUNA MARKET, BY TYPE, 2022-2032 ($MILLION)
- TABLE 14. NORTH AMERICA FROZEN TUNA MARKET, BY APPLICATION, 2022-2032 ($MILLION)
- TABLE 15. NORTH AMERICA FROZEN TUNA MARKET, BY COUNTRY, 2022-2032 ($MILLION)
- TABLE 16. U.S. FROZEN TUNA MARKET, BY TYPE, 2022-2032 ($MILLION)
- TABLE 17. U.S. FROZEN TUNA MARKET, BY APPLICATION, 2022-2032 ($MILLION)
- TABLE 18. CANADA FROZEN TUNA MARKET, BY TYPE, 2022-2032 ($MILLION)
- TABLE 19. CANADA FROZEN TUNA MARKET, BY APPLICATION, 2022-2032 ($MILLION)
- TABLE 20. MEXICO FROZEN TUNA MARKET, BY TYPE, 2022-2032 ($MILLION)
- TABLE 21. MEXICO FROZEN TUNA MARKET, BY APPLICATION, 2022-2032 ($MILLION)
- TABLE 22. EUROPE FROZEN TUNA MARKET, BY TYPE, 2022-2032 ($MILLION)
- TABLE 23. EUROPE FROZEN TUNA MARKET, BY APPLICATION, 2022-2032 ($MILLION)
- TABLE 24. EUROPE FROZEN TUNA MARKET, BY COUNTRY, 2022-2032 ($MILLION)
- TABLE 25. GERMANY FROZEN TUNA MARKET, BY TYPE, 2022-2032 ($MILLION)
- TABLE 26. GERMANY FROZEN TUNA MARKET, BY APPLICATION, 2022-2032 ($MILLION)
- TABLE 27. UK FROZEN TUNA MARKET, BY TYPE, 2022-2032 ($MILLION)
- TABLE 28. UK FROZEN TUNA MARKET, BY APPLICATION, 2022-2032 ($MILLION)
- TABLE 29. RUSSIA FROZEN TUNA MARKET, BY TYPE, 2022-2032 ($MILLION)
- TABLE 30. RUSSIA FROZEN TUNA MARKET, BY APPLICATION, 2022-2032 ($MILLION)
- TABLE 31. DENMARK FROZEN TUNA MARKET, BY TYPE, 2022-2032 ($MILLION)
- TABLE 32. DENMARK FROZEN TUNA MARKET, BY APPLICATION, 2022-2032 ($MILLION)
- TABLE 33. NORWAY FROZEN TUNA MARKET, BY TYPE, 2022-2032 ($MILLION)
- TABLE 34. NORWAY FROZEN TUNA MARKET, BY APPLICATION, 2022-2032 ($MILLION)
- TABLE 35. REST OF EUROPE FROZEN TUNA MARKET, BY TYPE, 2022-2032 ($MILLION)
- TABLE 36. REST OF EUROPE FROZEN TUNA MARKET, BY APPLICATION, 2022-2032 ($MILLION)
- TABLE 37. ASIA-PACIFIC FROZEN TUNA MARKET, BY TYPE, 2022-2032 ($MILLION)
- TABLE 38. ASIA-PACIFIC FROZEN TUNA MARKET, BY APPLICATION, 2022-2032 ($MILLION)
- TABLE 39. ASIA-PACIFIC FROZEN TUNA MARKET, BY COUNTRY, 2022-2032 ($MILLION)
- TABLE 40. CHINA FROZEN TUNA MARKET, BY TYPE, 2022-2032 ($MILLION)
- TABLE 41. CHINA FROZEN TUNA MARKET, BY APPLICATION, 2022-2032 ($MILLION)
- TABLE 42. JAPAN FROZEN TUNA MARKET, BY TYPE, 2022-2032 ($MILLION)
- TABLE 43. JAPAN FROZEN TUNA MARKET, BY APPLICATION, 2022-2032 ($MILLION)
- TABLE 44. INDIA FROZEN TUNA MARKET, BY TYPE, 2022-2032 ($MILLION)
- TABLE 45. INDIA FROZEN TUNA MARKET, BY APPLICATION, 2022-2032 ($MILLION)
- TABLE 46. TAIWAN FROZEN TUNA MARKET, BY TYPE, 2022-2032 ($MILLION)
- TABLE 47. TAIWAN FROZEN TUNA MARKET, BY APPLICATION, 2022-2032 ($MILLION)
- TABLE 48. INDONESIA FROZEN TUNA MARKET, BY TYPE, 2022-2032 ($MILLION)
- TABLE 49. INDONESIA FROZEN TUNA MARKET, BY APPLICATION, 2022-2032 ($MILLION)
- TABLE 50. REST OF ASIA-PACIFIC FROZEN TUNA MARKET, BY TYPE, 2022-2032 ($MILLION)
- TABLE 51. REST OF ASIA-PACIFIC FROZEN TUNA MARKET, BY APPLICATION, 2022-2032 ($MILLION)
- TABLE 52. LAMEA FROZEN TUNA MARKET, BY TYPE, 2022-2032 ($MILLION)
- TABLE 53. LAMEA FROZEN TUNA MARKET, BY APPLICATION, 2022-2032 ($MILLION)
- TABLE 54. LAMEA FROZEN TUNA MARKET, BY COUNTRY, 2022-2032 ($MILLION)
- TABLE 55. BRAZIL FROZEN TUNA MARKET, BY TYPE, 2022-2032 ($MILLION)
- TABLE 56. BRAZIL FROZEN TUNA MARKET, BY APPLICATION, 2022-2032 ($MILLION)
- TABLE 57. UAE FROZEN TUNA MARKET, BY TYPE, 2022-2032 ($MILLION)
- TABLE 58. UAE FROZEN TUNA MARKET, BY APPLICATION, 2022-2032 ($MILLION)
- TABLE 59. CHILE FROZEN TUNA MARKET, BY TYPE, 2022-2032 ($MILLION)
- TABLE 60. CHILE FROZEN TUNA MARKET, BY APPLICATION, 2022-2032 ($MILLION)
- TABLE 61. SOUTH AFRICA FROZEN TUNA MARKET, BY TYPE, 2022-2032 ($MILLION)
- TABLE 62. SOUTH AFRICA FROZEN TUNA MARKET, BY APPLICATION, 2022-2032 ($MILLION)
- TABLE 63. REST OF LAMEA FROZEN TUNA MARKET, BY TYPE, 2022-2032 ($MILLION)
- TABLE 64. REST OF LAMEA FROZEN TUNA MARKET, BY APPLICATION, 2022-2032 ($MILLION)
- TABLE 65. BRIG-STAR LLC: KEY EXECUTIVES
- TABLE 66. BRIG-STAR LLC: COMPANY SNAPSHOT
- TABLE 67. BRIG-STAR LLC: PRODUCT SEGMENTS
- TABLE 68. BRIG-STAR LLC: SERVICE SEGMENTS
- TABLE 69. BRIG-STAR LLC: PRODUCT PORTFOLIO
- TABLE 70. BRIG-STAR LLC: KEY STRATERGIES
- TABLE 71. CHICKEN OF THE SEA: KEY EXECUTIVES
- TABLE 72. CHICKEN OF THE SEA: COMPANY SNAPSHOT
- TABLE 73. CHICKEN OF THE SEA: PRODUCT SEGMENTS
- TABLE 74. CHICKEN OF THE SEA: SERVICE SEGMENTS
- TABLE 75. CHICKEN OF THE SEA: PRODUCT PORTFOLIO
- TABLE 76. CHICKEN OF THE SEA: KEY STRATERGIES
- TABLE 77. DONGWON ENTERPRISE COMPANY: KEY EXECUTIVES
- TABLE 78. DONGWON ENTERPRISE COMPANY: COMPANY SNAPSHOT
- TABLE 79. DONGWON ENTERPRISE COMPANY: PRODUCT SEGMENTS
- TABLE 80. DONGWON ENTERPRISE COMPANY: SERVICE SEGMENTS
- TABLE 81. DONGWON ENTERPRISE COMPANY: PRODUCT PORTFOLIO
- TABLE 82. DONGWON ENTERPRISE COMPANY: KEY STRATERGIES
- TABLE 83. HIGH LINER FOODS: KEY EXECUTIVES
- TABLE 84. HIGH LINER FOODS: COMPANY SNAPSHOT
- TABLE 85. HIGH LINER FOODS: PRODUCT SEGMENTS
- TABLE 86. HIGH LINER FOODS: SERVICE SEGMENTS
- TABLE 87. HIGH LINER FOODS: PRODUCT PORTFOLIO
- TABLE 88. HIGH LINER FOODS: KEY STRATERGIES
- TABLE 89. MARINE HARVEST: KEY EXECUTIVES
- TABLE 90. MARINE HARVEST: COMPANY SNAPSHOT
- TABLE 91. MARINE HARVEST: PRODUCT SEGMENTS
- TABLE 92. MARINE HARVEST: SERVICE SEGMENTS
- TABLE 93. MARINE HARVEST: PRODUCT PORTFOLIO
- TABLE 94. MARINE HARVEST: KEY STRATERGIES
- TABLE 95. NIPPON SUISAN KAISHA AKA NISSUI: KEY EXECUTIVES
- TABLE 96. NIPPON SUISAN KAISHA AKA NISSUI: COMPANY SNAPSHOT
- TABLE 97. NIPPON SUISAN KAISHA AKA NISSUI: PRODUCT SEGMENTS
- TABLE 98. NIPPON SUISAN KAISHA AKA NISSUI: SERVICE SEGMENTS
- TABLE 99. NIPPON SUISAN KAISHA AKA NISSUI: PRODUCT PORTFOLIO
- TABLE 100. NIPPON SUISAN KAISHA AKA NISSUI: KEY STRATERGIES
- TABLE 101. PESCANOVA SA: KEY EXECUTIVES
- TABLE 102. PESCANOVA SA: COMPANY SNAPSHOT
- TABLE 103. PESCANOVA SA: PRODUCT SEGMENTS
- TABLE 104. PESCANOVA SA: SERVICE SEGMENTS
- TABLE 105. PESCANOVA SA: PRODUCT PORTFOLIO
- TABLE 106. PESCANOVA SA: KEY STRATERGIES
- TABLE 107. SALMAR ASA: KEY EXECUTIVES
- TABLE 108. SALMAR ASA: COMPANY SNAPSHOT
- TABLE 109. SALMAR ASA: PRODUCT SEGMENTS
- TABLE 110. SALMAR ASA: SERVICE SEGMENTS
- TABLE 111. SALMAR ASA: PRODUCT PORTFOLIO
- TABLE 112. SALMAR ASA: KEY STRATERGIES
- TABLE 113. ZONECO GROUP: KEY EXECUTIVES
- TABLE 114. ZONECO GROUP: COMPANY SNAPSHOT
- TABLE 115. ZONECO GROUP: PRODUCT SEGMENTS
- TABLE 116. ZONECO GROUP: SERVICE SEGMENTS
- TABLE 117. ZONECO GROUP: PRODUCT PORTFOLIO
- TABLE 118. ZONECO GROUP: KEY STRATERGIES
- TABLE 119. TASSAL GROUP: KEY EXECUTIVES
- TABLE 120. TASSAL GROUP: COMPANY SNAPSHOT
- TABLE 121. TASSAL GROUP: PRODUCT SEGMENTS
- TABLE 122. TASSAL GROUP: SERVICE SEGMENTS
- TABLE 123. TASSAL GROUP: PRODUCT PORTFOLIO
- TABLE 124. TASSAL GROUP: KEY STRATERGIES
LIST OF FIGURES
- FIGURE 01. FROZEN TUNA MARKET, 2022-2032
- FIGURE 02. SEGMENTATION OF FROZEN TUNA MARKET,2022-2032
- FIGURE 03. TOP IMPACTING FACTORS IN FROZEN TUNA MARKET
- FIGURE 04. TOP INVESTMENT POCKETS IN FROZEN TUNA MARKET (2023-2032)
- FIGURE 05. BARGAINING POWER OF SUPPLIERS
- FIGURE 06. BARGAINING POWER OF BUYERS
- FIGURE 07. THREAT OF SUBSTITUTION
- FIGURE 08. THREAT OF SUBSTITUTION
- FIGURE 09. COMPETITIVE RIVALRY
- FIGURE 10. GLOBAL FROZEN TUNA MARKET:DRIVERS, RESTRAINTS AND OPPORTUNITIES
- FIGURE 11. IMPACT OF KEY REGULATION: FROZEN TUNA MARKET
- FIGURE 12. PATENT ANALYSIS BY COMPANY
- FIGURE 13. PATENT ANALYSIS BY COUNTRY
- FIGURE 14. FROZEN TUNA MARKET, BY TYPE, 2022 AND 2032(%)
- FIGURE 15. COMPARATIVE SHARE ANALYSIS OF FROZEN TUNA MARKET FOR FROZEN ALBACORE, BY COUNTRY 2022 AND 2032(%)
- FIGURE 16. COMPARATIVE SHARE ANALYSIS OF FROZEN TUNA MARKET FOR FROZEN BIG EYE AHI, BY COUNTRY 2022 AND 2032(%)
- FIGURE 17. COMPARATIVE SHARE ANALYSIS OF FROZEN TUNA MARKET FOR FROZEN BLUEFIN TUNA, BY COUNTRY 2022 AND 2032(%)
- FIGURE 18. COMPARATIVE SHARE ANALYSIS OF FROZEN TUNA MARKET FOR FROZEN SKIPJACK, BY COUNTRY 2022 AND 2032(%)
- FIGURE 19. COMPARATIVE SHARE ANALYSIS OF FROZEN TUNA MARKET FOR FROZEN YELLOWFIN TUNA, BY COUNTRY 2022 AND 2032(%)
- FIGURE 20. FROZEN TUNA MARKET, BY APPLICATION, 2022 AND 2032(%)
- FIGURE 21. COMPARATIVE SHARE ANALYSIS OF FROZEN TUNA MARKET FOR SUPERMARKETS/ HYPERMARKETS, BY COUNTRY 2022 AND 2032(%)
- FIGURE 22. COMPARATIVE SHARE ANALYSIS OF FROZEN TUNA MARKET FOR CONVENIENCE STORES, BY COUNTRY 2022 AND 2032(%)
- FIGURE 23. COMPARATIVE SHARE ANALYSIS OF FROZEN TUNA MARKET FOR SPECIALTY STORES, BY COUNTRY 2022 AND 2032(%)
- FIGURE 24. COMPARATIVE SHARE ANALYSIS OF FROZEN TUNA MARKET FOR ONLINE RETAIL, BY COUNTRY 2022 AND 2032(%)
- FIGURE 25. FROZEN TUNA MARKET BY REGION, 2022 AND 2032(%)
- FIGURE 26. U.S. FROZEN TUNA MARKET, 2022-2032 ($MILLION)
- FIGURE 27. CANADA FROZEN TUNA MARKET, 2022-2032 ($MILLION)
- FIGURE 28. MEXICO FROZEN TUNA MARKET, 2022-2032 ($MILLION)
- FIGURE 29. GERMANY FROZEN TUNA MARKET, 2022-2032 ($MILLION)
- FIGURE 30. UK FROZEN TUNA MARKET, 2022-2032 ($MILLION)
- FIGURE 31. RUSSIA FROZEN TUNA MARKET, 2022-2032 ($MILLION)
- FIGURE 32. DENMARK FROZEN TUNA MARKET, 2022-2032 ($MILLION)
- FIGURE 33. NORWAY FROZEN TUNA MARKET, 2022-2032 ($MILLION)
- FIGURE 34. REST OF EUROPE FROZEN TUNA MARKET, 2022-2032 ($MILLION)
- FIGURE 35. CHINA FROZEN TUNA MARKET, 2022-2032 ($MILLION)
- FIGURE 36. JAPAN FROZEN TUNA MARKET, 2022-2032 ($MILLION)
- FIGURE 37. INDIA FROZEN TUNA MARKET, 2022-2032 ($MILLION)
- FIGURE 38. TAIWAN FROZEN TUNA MARKET, 2022-2032 ($MILLION)
- FIGURE 39. INDONESIA FROZEN TUNA MARKET, 2022-2032 ($MILLION)
- FIGURE 40. REST OF ASIA-PACIFIC FROZEN TUNA MARKET, 2022-2032 ($MILLION)
- FIGURE 41. BRAZIL FROZEN TUNA MARKET, 2022-2032 ($MILLION)
- FIGURE 42. UAE FROZEN TUNA MARKET, 2022-2032 ($MILLION)
- FIGURE 43. CHILE FROZEN TUNA MARKET, 2022-2032 ($MILLION)
- FIGURE 44. SOUTH AFRICA FROZEN TUNA MARKET, 2022-2032 ($MILLION)
- FIGURE 45. REST OF LAMEA FROZEN TUNA MARKET, 2022-2032 ($MILLION)
- FIGURE 46. TOP WINNING STRATEGIES, BY YEAR
- FIGURE 47. TOP WINNING STRATEGIES, BY DEVELOPMENT
- FIGURE 48. TOP WINNING STRATEGIES, BY COMPANY
- FIGURE 49. PRODUCT MAPPING OF TOP 10 PLAYERS
- FIGURE 50. COMPETITIVE DASHBOARD
- FIGURE 51. COMPETITIVE HEATMAP: FROZEN TUNA MARKET
- FIGURE 52. TOP PLAYER POSITIONING, 2022
The global frozen tuna market is anticipated to reach $13,342.8 million by 2032, growing from $6,579.0 million in 2022 at a CAGR of 7.4% from 2023 to 2032.
"Frozen tuna" typically refers to tuna fish that has been frozen for preservation. Tuna is a popular seafood and freezing is a common method used to extend its shelf life & maintain its freshness. The process involves rapidly freezing the tuna to exceptionally low temperatures, which helps to slow down the growth of bacteria and other microorganisms that lead to spoilage. Frozen tuna is often used in various culinary applications, including sashimi and sushi. Moreover, freezing helps to retain the quality of the fish by preserving its texture and flavor. In addition, frozen tuna is convenient for storage and transportation, allowing it to be available year-round even when fresh tuna is in season.
The frozen tuna is recognized for its nutritional value, being rich in protein, omega-3 fatty acids, vitamins, and minerals. Consumers are becoming more health-conscious, seeking foods that contribute to their overall well-being. The omega-3 fatty acids in tuna are particularly known for supporting heart health and cognitive function. As awareness about the nutritional benefits of seafood, including tuna increases, consumers are incorporating more fish into their diets. Seafood is often promoted as a healthy alternative to red meat and tuna's nutritional profile aligns with this trend. Frozen tuna offers convenience to consumers, owing to its ability to be stored for longer periods, allowing for easy meal planning and reducing the frequency of grocery shopping. In addition, frozen tuna is used in various culinary applications, making it a versatile choice for consumers seeking diverse and convenient meal options. With increasing globalization, consumers have access to a wide variety of seafood products, including several types of tuna. This has expanded consumer choices and exposed them to various tuna products, contributing to the development of the market. Moreover, consumers are concerned about the sustainability of their food choices. Tuna fisheries and brands that emphasize sustainable & responsible fishing practices attract environmentally conscious consumers. Certifications such as those from the Marine Stewardship Council (MSC) influence purchasing decisions, fueling the demand for sustainably sourced frozen tuna.
However, tuna populations globally are under threat from overfishing, where the rate of catching tuna exceeds their natural reproduction rate. This is expected to lead to the depletion of tuna stocks, disrupting the balance of marine ecosystems and affecting other marine species dependent on tuna. Tuna fishing often results in the unintentional capture of non-target species, known as bycatch. Bycatch includes endangered or non-commercial species, contributing to biodiversity loss and disrupting marine ecosystems. Hence, addressing bycatch is crucial for sustainable tuna fishing practices. Certain tuna fishing methods, such as purse seining and longlining, cause habitat destruction. For instance, the use of fish aggregating devices (FADs) in purse seining leads to the entanglement of non-target species and longlines cause damage to the ocean floor. These practices notably contribute to the degradation of marine habitats. Governments and international bodies are implementing stringent regulations to promote sustainable fishing practices as well as reduce the environmental impact of the fishing industry. Compliance with these regulations poses challenges for players in the frozen tuna market who do not adhere to sustainable and responsible fishing practices. Certification programs such as the MSC have implemented standards for sustainable and well-managed fisheries. Meeting these certification requirements acts as a constraint for players in the frozen tuna market, however, it is important for gaining consumer trust and access to certain markets.
On the contrary, the demand for frozen tuna is rising globally due to changing consumer preferences. Tuna is a rich source of high-quality protein, which is essential for muscle development, tissue repair, and overall health. With surging emphasis on protein-rich diets, frozen tuna is positioned as a convenient and versatile option for consumers seeking to meet their protein requirements. Tuna is abundant in omega-3 fatty acids, particularly EPA and DHA, which are known for their heart health benefits. Marketing frozen tuna as a natural source of these essential fatty acids attracts health-conscious consumers seeking foods which support cardiovascular well-being. Tuna is low in calories & fat, making it a suitable choice for individuals focused on weight management and maintaining a healthy diet. Furthermore, frozen tuna offers the convenience of longer storage without compromising nutritional value. With busy lifestyles, consumers seek quick & easy meal solutions; thus, promoting frozen tuna as a timesaving and nutritionally dense protein source resonates with individuals looking for hassle-free yet healthy meal options. Consumers are significantly concerned about sustainable and responsibly sourced seafood. Therefore, brands in the frozen tuna market are anticipated to gain a competitive edge by emphasizing eco-friendly fishing practices and transparent supply chains.
The key players profiled in this report include Brig-Star LLC, Chicken of the Sea, Dongwon Enterprise Company, High Liner Foods, Marine Harvest, Nippon Suisan Kaisha aka Nissui, Pescanova SA, SalMar ASA, Zoneco Group, and Tassal Group. The market players are continuously striving to gain one-upmanship in this competitive market using strategies such as collaborations and acquisitions.
Key Benefits For Stakeholders
- This report provides a quantitative analysis of the market segments, current trends, estimations, and dynamics of the frozen tuna market analysis from 2022 to 2032 to identify the prevailing frozen tuna market opportunities.
- The market research is offered along with information related to key drivers, restraints, and opportunities.
- Porter's five forces analysis highlights the potency of buyers and suppliers to enable stakeholders make profit-oriented business decisions and strengthen their supplier-buyer network.
- In-depth analysis of the frozen tuna market segmentation assists to determine the prevailing market opportunities.
- Major countries in each region are mapped according to their revenue contribution to the global market.
- Market player positioning facilitates benchmarking and provides a clear understanding of the present position of the market players.
- The report includes the analysis of the regional as well as global frozen tuna market trends, key players, market segments, application areas, and market growth strategies.
Additional benefits you will get with this purchase are:
- Quarterly Update and* (only available with a corporate license, on listed price)
- 5 additional Company Profile of client Choice pre- or Post-purchase, as a free update.
- Free Upcoming Version on the Purchase of Five and Enterprise User License.
- 16 analyst hours of support* (post-purchase, if you find additional data requirements upon review of the report, you may receive support amounting to 16 analyst hours to solve questions, and post-sale queries)
- 15% Free Customization* (in case the scope or segment of the report does not match your requirements, 15% is equivalent to 3 working days of free work, applicable once)
- Free data Pack on the Five and Enterprise User License. (Excel version of the report)
- Free Updated report if the report is 6-12 months old or older.
- 24-hour priority response*
- Free Industry updates and white papers.
Possible Customization with this report (with additional cost and timeline, please talk to the sales executive to know more)
- Consumer Buying Behavior Analysis
- End user preferences and pain points
- Investment Opportunities
- Upcoming/New Entrant by Regions
- Technology Trend Analysis
- Go To Market Strategy
- Market share analysis of players by products/segments
- Pain Point Analysis
- Regulatory Guidelines
- Strategic Recommedations
- Additional company profiles with specific to client's interest
- Additional country or region analysis- market size and forecast
- Criss-cross segment analysis- market size and forecast
- Expanded list for Company Profiles
- Historic market data
- Key player details (including location, contact details, supplier/vendor network etc. in excel format)
- Market share analysis of players at global/region/country level
Key Market Segments
By Type
- Frozen Albacore
- Frozen Big Eye Ahi
- Frozen Bluefin Tuna
- Frozen Skipjack
- Frozen Yellowfin Tuna
By Application
- Supermarkets/ Hypermarkets
- Convenience Stores
- Specialty Stores
- Online Retail
By Region
- North America
- U.S.
- Canada
- Mexico
- Europe
- Germany
- UK
- Russia
- Denmark
- Norway
- Rest of Europe
- Asia-Pacific
- China
- Japan
- India
- Taiwan
- Indonesia
- Rest of Asia-Pacific
- LAMEA
- Brazil
- UAE
- Chile
- South Africa
- Rest of LAMEA
Key Market Players:
- Brig-Star LLC
- chicken of the sea
- Dongwon Enterprise Company
- High Liner Foods
- Marine Harvest
- Nippon Suisan Kaisha aka Nissui
- Pescanova SA
- SalMar ASA
- Zoneco Group
- Tassal Group
TABLE OF CONTENTS
CHAPTER 1: INTRODUCTION
- 1.1. Report description
- 1.2. Key market segments
- 1.3. Key benefits to the stakeholders
- 1.4. Research methodology
- 1.4.1. Primary research
- 1.4.2. Secondary research
- 1.4.3. Analyst tools and models
CHAPTER 2: EXECUTIVE SUMMARY
- 2.1. CXO perspective
CHAPTER 3: MARKET OVERVIEW
- 3.1. Market definition and scope
- 3.2. Key findings
- 3.2.1. Top impacting factors
- 3.2.2. Top investment pockets
- 3.3. Porter's five forces analysis
- 3.4. Market dynamics
- 3.4.1. Drivers
- 3.4.2. Restraints
- 3.4.3. Opportunities
- 3.5. Average Selling Price
- 3.6. Market Share Analysis
- 3.7. Brand Share Analysis
- 3.8. Trade Data Analysis
- 3.9. Product Consumption
- 3.10. Value Chain Analysis
- 3.11. Regulatory Guidelines
- 3.12. Key Regulation Analysis
- 3.13. Reimbursement Scenario
- 3.14. Patent Landscape
CHAPTER 4: FROZEN TUNA MARKET, BY TYPE
- 4.1. Overview
- 4.1.1. Market size and forecast
- 4.2. Frozen Albacore
- 4.2.1. Key market trends, growth factors and opportunities
- 4.2.2. Market size and forecast, by region
- 4.2.3. Market share analysis by country
- 4.3. Frozen Big Eye Ahi
- 4.3.1. Key market trends, growth factors and opportunities
- 4.3.2. Market size and forecast, by region
- 4.3.3. Market share analysis by country
- 4.4. Frozen Bluefin Tuna
- 4.4.1. Key market trends, growth factors and opportunities
- 4.4.2. Market size and forecast, by region
- 4.4.3. Market share analysis by country
- 4.5. Frozen Skipjack
- 4.5.1. Key market trends, growth factors and opportunities
- 4.5.2. Market size and forecast, by region
- 4.5.3. Market share analysis by country
- 4.6. Frozen Yellowfin Tuna
- 4.6.1. Key market trends, growth factors and opportunities
- 4.6.2. Market size and forecast, by region
- 4.6.3. Market share analysis by country
CHAPTER 5: FROZEN TUNA MARKET, BY APPLICATION
- 5.1. Overview
- 5.1.1. Market size and forecast
- 5.2. Supermarkets/ Hypermarkets
- 5.2.1. Key market trends, growth factors and opportunities
- 5.2.2. Market size and forecast, by region
- 5.2.3. Market share analysis by country
- 5.3. Convenience Stores
- 5.3.1. Key market trends, growth factors and opportunities
- 5.3.2. Market size and forecast, by region
- 5.3.3. Market share analysis by country
- 5.4. Specialty Stores
- 5.4.1. Key market trends, growth factors and opportunities
- 5.4.2. Market size and forecast, by region
- 5.4.3. Market share analysis by country
- 5.5. Online Retail
- 5.5.1. Key market trends, growth factors and opportunities
- 5.5.2. Market size and forecast, by region
- 5.5.3. Market share analysis by country
CHAPTER 6: FROZEN TUNA MARKET, BY REGION
- 6.1. Overview
- 6.1.1. Market size and forecast By Region
- 6.2. North America
- 6.2.1. Key market trends, growth factors and opportunities
- 6.2.2. Market size and forecast, by Type
- 6.2.3. Market size and forecast, by Application
- 6.2.4. Market size and forecast, by country
- 6.2.4.1. U.S.
- 6.2.4.1.1. Market size and forecast, by Type
- 6.2.4.1.2. Market size and forecast, by Application
- 6.2.4.2. Canada
- 6.2.4.2.1. Market size and forecast, by Type
- 6.2.4.2.2. Market size and forecast, by Application
- 6.2.4.3. Mexico
- 6.2.4.3.1. Market size and forecast, by Type
- 6.2.4.3.2. Market size and forecast, by Application
- 6.3. Europe
- 6.3.1. Key market trends, growth factors and opportunities
- 6.3.2. Market size and forecast, by Type
- 6.3.3. Market size and forecast, by Application
- 6.3.4. Market size and forecast, by country
- 6.3.4.1. Germany
- 6.3.4.1.1. Market size and forecast, by Type
- 6.3.4.1.2. Market size and forecast, by Application
- 6.3.4.2. UK
- 6.3.4.2.1. Market size and forecast, by Type
- 6.3.4.2.2. Market size and forecast, by Application
- 6.3.4.3. Russia
- 6.3.4.3.1. Market size and forecast, by Type
- 6.3.4.3.2. Market size and forecast, by Application
- 6.3.4.4. Denmark
- 6.3.4.4.1. Market size and forecast, by Type
- 6.3.4.4.2. Market size and forecast, by Application
- 6.3.4.5. Norway
- 6.3.4.5.1. Market size and forecast, by Type
- 6.3.4.5.2. Market size and forecast, by Application
- 6.3.4.6. Rest of Europe
- 6.3.4.6.1. Market size and forecast, by Type
- 6.3.4.6.2. Market size and forecast, by Application
- 6.4. Asia-Pacific
- 6.4.1. Key market trends, growth factors and opportunities
- 6.4.2. Market size and forecast, by Type
- 6.4.3. Market size and forecast, by Application
- 6.4.4. Market size and forecast, by country
- 6.4.4.1. China
- 6.4.4.1.1. Market size and forecast, by Type
- 6.4.4.1.2. Market size and forecast, by Application
- 6.4.4.2. Japan
- 6.4.4.2.1. Market size and forecast, by Type
- 6.4.4.2.2. Market size and forecast, by Application
- 6.4.4.3. India
- 6.4.4.3.1. Market size and forecast, by Type
- 6.4.4.3.2. Market size and forecast, by Application
- 6.4.4.4. Taiwan
- 6.4.4.4.1. Market size and forecast, by Type
- 6.4.4.4.2. Market size and forecast, by Application
- 6.4.4.5. Indonesia
- 6.4.4.5.1. Market size and forecast, by Type
- 6.4.4.5.2. Market size and forecast, by Application
- 6.4.4.6. Rest of Asia-Pacific
- 6.4.4.6.1. Market size and forecast, by Type
- 6.4.4.6.2. Market size and forecast, by Application
- 6.5. LAMEA
- 6.5.1. Key market trends, growth factors and opportunities
- 6.5.2. Market size and forecast, by Type
- 6.5.3. Market size and forecast, by Application
- 6.5.4. Market size and forecast, by country
- 6.5.4.1. Brazil
- 6.5.4.1.1. Market size and forecast, by Type
- 6.5.4.1.2. Market size and forecast, by Application
- 6.5.4.2. UAE
- 6.5.4.2.1. Market size and forecast, by Type
- 6.5.4.2.2. Market size and forecast, by Application
- 6.5.4.3. Chile
- 6.5.4.3.1. Market size and forecast, by Type
- 6.5.4.3.2. Market size and forecast, by Application
- 6.5.4.4. South Africa
- 6.5.4.4.1. Market size and forecast, by Type
- 6.5.4.4.2. Market size and forecast, by Application
- 6.5.4.5. Rest of LAMEA
- 6.5.4.5.1. Market size and forecast, by Type
- 6.5.4.5.2. Market size and forecast, by Application
CHAPTER 7: COMPETITIVE LANDSCAPE
- 7.1. Introduction
- 7.2. Top winning strategies
- 7.3. Product mapping of top 10 player
- 7.4. Competitive dashboard
- 7.5. Competitive heatmap
- 7.6. Top player positioning, 2022
CHAPTER 8: COMPANY PROFILES
- 8.1. Brig-Star LLC
- 8.1.1. Company overview
- 8.1.2. Key executives
- 8.1.3. Company snapshot
- 8.1.4. Operating business segments
- 8.1.5. Product portfolio
- 8.1.6. Business performance
- 8.1.7. Key strategic moves and developments
- 8.2. chicken of the sea
- 8.2.1. Company overview
- 8.2.2. Key executives
- 8.2.3. Company snapshot
- 8.2.4. Operating business segments
- 8.2.5. Product portfolio
- 8.2.6. Business performance
- 8.2.7. Key strategic moves and developments
- 8.3. Dongwon Enterprise Company
- 8.3.1. Company overview
- 8.3.2. Key executives
- 8.3.3. Company snapshot
- 8.3.4. Operating business segments
- 8.3.5. Product portfolio
- 8.3.6. Business performance
- 8.3.7. Key strategic moves and developments
- 8.4. High Liner Foods
- 8.4.1. Company overview
- 8.4.2. Key executives
- 8.4.3. Company snapshot
- 8.4.4. Operating business segments
- 8.4.5. Product portfolio
- 8.4.6. Business performance
- 8.4.7. Key strategic moves and developments
- 8.5. Marine Harvest
- 8.5.1. Company overview
- 8.5.2. Key executives
- 8.5.3. Company snapshot
- 8.5.4. Operating business segments
- 8.5.5. Product portfolio
- 8.5.6. Business performance
- 8.5.7. Key strategic moves and developments
- 8.6. Nippon Suisan Kaisha aka Nissui
- 8.6.1. Company overview
- 8.6.2. Key executives
- 8.6.3. Company snapshot
- 8.6.4. Operating business segments
- 8.6.5. Product portfolio
- 8.6.6. Business performance
- 8.6.7. Key strategic moves and developments
- 8.7. Pescanova SA
- 8.7.1. Company overview
- 8.7.2. Key executives
- 8.7.3. Company snapshot
- 8.7.4. Operating business segments
- 8.7.5. Product portfolio
- 8.7.6. Business performance
- 8.7.7. Key strategic moves and developments
- 8.8. SalMar ASA
- 8.8.1. Company overview
- 8.8.2. Key executives
- 8.8.3. Company snapshot
- 8.8.4. Operating business segments
- 8.8.5. Product portfolio
- 8.8.6. Business performance
- 8.8.7. Key strategic moves and developments
- 8.9. Zoneco Group
- 8.9.1. Company overview
- 8.9.2. Key executives
- 8.9.3. Company snapshot
- 8.9.4. Operating business segments
- 8.9.5. Product portfolio
- 8.9.6. Business performance
- 8.9.7. Key strategic moves and developments
- 8.10. Tassal Group
- 8.10.1. Company overview
- 8.10.2. Key executives
- 8.10.3. Company snapshot
- 8.10.4. Operating business segments
- 8.10.5. Product portfolio
- 8.10.6. Business performance
- 8.10.7. Key strategic moves and developments
