|
|
市場調査レポート
商品コード
1446929
ガス絶縁開閉装置市場:電圧別、用途別、技術別:世界の機会分析と産業予測、2023-2032年Gas Insulated Switchgear Market By Voltage, By Application, By Technology : Global Opportunity Analysis and Industry Forecast, 2023-2032 |
||||||
|
|
|||||||
|
|||||||


| ガス絶縁開閉装置市場:電圧別、用途別、技術別:世界の機会分析と産業予測、2023-2032年 |
|
出版日: 2024年01月30日
発行: Allied Market Research
ページ情報: 英文 300 Pages
納期: 2~3営業日
|

- 全表示
- 概要
- 図表
- 目次
ガス絶縁開閉装置の世界市場規模は、2022年に230億米ドル、2023年から2032年にかけてCAGR 4.3%で成長し、2032年には352億米ドルに達すると予測されています。
電気システムは、ガス絶縁開閉装置(GIS)を使って電気機器を隔離、制御、保護します。従来の空気絶縁開閉装置(AIS)とは対照的に、GISでは絶縁媒体として六フッ化硫黄(SF6)ガスが使用され、コンパクトな設計と電気性能の向上が図られています。GISのエンクロージャは金属で覆われた密閉構造で、環境要因に強い耐性を持っています。主な絶縁媒体はSF6ガスで、その優れた誘電特性と電気火花を消す強力な能力が特徴です。
電気回路を調整し絶縁するために、GISはさまざまな断路器、接地スイッチ、サーキットブレーカーを統合しています。バスバーは、銅やアルミニウムなどの導電性材料で作られており、スイッチギア全体の効果的な配電を保証します。変電所のレイアウトは、標準的なAIS設計よりもGISの方がスペース効率が高いです。GISの全体的な信頼性は、密閉アーキテクチャと外部の影響にさらされないことによって向上します。密閉された設計により、活線部品との接触が制限され、SF6ガスの使用により火災や爆発のリスクが低くなります。
送配電を行う高圧変電所では、GISが頻繁に採用されています。GISは、限られたスペースで信頼性の高い小型ソリューションが必要な場合、さまざまな産業環境で使用できます。太陽光発電や風力発電のような再生可能エネルギー源とリンクしている変電所では、GISを使用することができます。SF6は、その優れた断熱性(GWP)にもかかわらず、地球温暖化の可能性が高い強力な温室効果ガスです。現在進行中の研究の目標は、代替ガスやより環境負荷の少ない技術を見つけることです。GISの継続的な信頼性は、日常的なメンテナンスとモニタリングの実施にかかっています。これには、SF6ガスの状態の評価、検査の実施、必要なメンテナンスや交換の実施などが含まれます。
空気絶縁開閉装置は頻繁に採用されているが、物理的な設置面積が大きく、極端に腐食性の高い条件や汚染された条件では絶縁性能が劣るなどの欠点があります。一方、よりコンパクトな設計や優れた絶縁性能が必要な場合は、ガス絶縁開閉装置(GIS)が選択されます。六フッ化硫黄(SF6)とその高い地球温暖化係数(GWP)に関する環境問題に対応するため、業界ではガス絶縁開閉装置(GIS)のSF6フリー・ソリューションの開発と設置に取り組んでいます。SF6フリーのガス絶縁開閉装置は、こうした環境問題を緩和するために、さまざまな絶縁ガスや技術を使用しています。
さらに、GISメーカーがSF6フリーの代替品を開発・生産することで、環境基準を満たし、持続可能なソリューションに対する市場の高まる需要を満たす可能性は大いにあります。GISをスマートグリッドに組み込むことで、配電網の監視、制御、通信を強化する機会がもたらされます。新興国市場におけるインフラ整備と都市化の進展は、GISメーカーがこれらの地域で市場シェアを拡大するチャンスをもたらします。
環境問題に対処するため、SF6を使用しないGIS製品を製造・販売するため、代替絶縁ガスや技術が使用される動向。モノのインターネット(IoT)とデジタル技術をGISに統合し、運転効率、予知保全、リアルタイム監視を強化します。スペースの制限に対応し、都市環境での設置を容易にするため、メーカーはコンパクトでモジュール化されたGIS設計の作成に注力しています。GISメーカー、電力会社、研究機関の間で、技術革新を促進し、市場の困難に対処するためのパートナーシップや協力関係が増加しています。
ガス絶縁開閉装置市場は、電圧、用途、技術、地域によって区分されます。電圧別では、市場は高電圧、中電圧、低電圧に分けられます。用途別では、住宅・商業用、産業用、公益事業に分類されます。技術別では、ガス絶縁開閉装置市場はハイブリッド開閉装置、統合三相開閉装置、小型ガス絶縁開閉装置に分類されます。地域別では、北米、欧州、アジア太平洋、LAMEAのガス絶縁開閉装置市場を分析しています。
主要企業による戦略的発展。
- 日立とシュナイダーエレクトリックの両社は2022年8月に提携し、顧客価値を高め、持続可能でインテリジェントなエネルギー管理ソリューションの展開を早める中高圧・高圧技術のポートフォリオを提供します。この提携により、両社は製品ラインを拡大することができました。
- ABBとサムスン電子は2022年4月、省エネ・エネルギー管理技術の開発で提携しました。両社はこの提携により、電力負荷の移転、機器管理の改善、ホームオートメーション技術へのアクセスを提供することで、顧客により良いサービスを提供できるようになった。
- イートン・コーポレーションplcは2021年2月、米国を拠点とする電気コネクタ部品メーカー、ロイヤル・パワー・ソリューションズを買収しました。この買収により、同社の製品ラインアップが改善されました。
利害関係者にとっての主なメリット
- 当レポートでは、2022年から2032年までのガス絶縁開閉装置市場分析の市場セグメント、現在の動向、推定・動向、力学を定量的に分析し、ガス絶縁開閉装置市場の有力な市場機会を特定しています。
- 市場促進要因、市場抑制要因、市場機会に関連する情報とともに市場調査を提供します。
- ポーターのファイブフォース分析では、利害関係者が利益重視のビジネス決定を下し、サプライヤーとバイヤーのネットワークを強化できるよう、バイヤーとサプライヤーの潜在力を明らかにします。
- ガス絶縁開閉装置市場のセグメンテーションを詳細に分析することで、市場機会を見極めることができます。
- 各地域の主要国を世界市場への収益貢献度に応じてマッピングしています。
- 市場プレイヤーのポジショニングはベンチマーキングを容易にし、市場プレイヤーの現在のポジションを明確に理解することができます。
- 地域別および世界のガス絶縁開閉装置市場動向、主要企業、市場セグメント、応用分野、市場成長戦略などの分析を含みます。
レポートカスタマイズの可能性
- 顧客の関心に応じた企業プロファイルの追加
- 国別または地域別の追加分析-市場規模と予測
- 過去の市場データ
- 主要プレーヤーの詳細(所在地、連絡先、サプライヤー/ベンダーネットワークなどを含む、エクセル形式)
- 顧客/消費者/原料サプライヤーのリスト-バリューチェーン分析
- SWOT分析
目次
第1章 イントロダクション
第2章 エグゼクティブサマリー
第3章 市場概要
- 市場の定義と範囲
- 主な調査結果
- 影響要因
- 主な投資機会
- ポーターのファイブフォース分析
- 市場力学
- 促進要因
- 抑制要因
- 機会
- バリューチェーン分析
- 特許情勢
第4章 ガス絶縁開閉装置市場:電圧別
- 概要
- 高
- 中
- 低
第5章 ガス絶縁開閉装置市場:用途別
- 概要
- 住宅用および商業用
- 産業用
- ユーティリティ
第6章 ガス絶縁開閉装置市場:技術別
- 概要
- ハイブリッド開閉器
- 三相一括形
- 小型ガス絶縁開閉装置
第7章 ガス絶縁開閉装置市場:地域別
- 概要
- 北米
- 米国
- カナダ
- メキシコ
- 欧州
- ドイツ
- 英国
- フランス
- イタリア
- スペイン
- その他
- アジア太平洋
- 中国
- 日本
- インド
- 韓国
- オーストラリア
- その他
- ラテンアメリカ・中東・アフリカ
- ブラジル
- サウジアラビア
- 南アフリカ
- その他
第8章 競争情勢
- イントロダクション
- 主要成功戦略
- 主要10社の製品マッピング
- 競合ダッシュボード
- 競合ヒートマップ
- 主要企業のポジショニング、2022年
第9章 企業プロファイル
- Mitsubishi Electric Corporation
- State Grid Corporation of China Limited
- ABB
- Hitachi Ltd.
- Siemens AG
- Hyundai Heavy Industries Co Ltd
- TOSHIBA CORPORATION
- Bharat Heavy Electricals Limited
- Schneider Electric
LIST OF TABLES
- TABLE 01. GLOBAL GAS INSULATED SWITCHGEAR MARKET, BY VOLTAGE, 2022-2032 ($MILLION)
- TABLE 02. GAS INSULATED SWITCHGEAR MARKET FOR HIGH, BY REGION, 2022-2032 ($MILLION)
- TABLE 03. GAS INSULATED SWITCHGEAR MARKET FOR MEDIUM, BY REGION, 2022-2032 ($MILLION)
- TABLE 04. GAS INSULATED SWITCHGEAR MARKET FOR LOW, BY REGION, 2022-2032 ($MILLION)
- TABLE 05. GLOBAL GAS INSULATED SWITCHGEAR MARKET, BY APPLICATION, 2022-2032 ($MILLION)
- TABLE 06. GAS INSULATED SWITCHGEAR MARKET FOR RESIDENTIAL AND COMMERCIAL, BY REGION, 2022-2032 ($MILLION)
- TABLE 07. GAS INSULATED SWITCHGEAR MARKET FOR INDUSTRIAL, BY REGION, 2022-2032 ($MILLION)
- TABLE 08. GAS INSULATED SWITCHGEAR MARKET FOR UTILITY, BY REGION, 2022-2032 ($MILLION)
- TABLE 09. GLOBAL GAS INSULATED SWITCHGEAR MARKET, BY TECHNOLOGY, 2022-2032 ($MILLION)
- TABLE 10. GAS INSULATED SWITCHGEAR MARKET FOR HYBRID SWITCHGEAR, BY REGION, 2022-2032 ($MILLION)
- TABLE 11. GAS INSULATED SWITCHGEAR MARKET FOR INTEGRATED THREE PHASE, BY REGION, 2022-2032 ($MILLION)
- TABLE 12. GAS INSULATED SWITCHGEAR MARKET FOR COMPACT GAS INSULATED SWITCHGEAR, BY REGION, 2022-2032 ($MILLION)
- TABLE 13. GAS INSULATED SWITCHGEAR MARKET, BY REGION, 2022-2032 ($MILLION)
- TABLE 14. NORTH AMERICA GAS INSULATED SWITCHGEAR MARKET, BY VOLTAGE, 2022-2032 ($MILLION)
- TABLE 15. NORTH AMERICA GAS INSULATED SWITCHGEAR MARKET, BY APPLICATION, 2022-2032 ($MILLION)
- TABLE 16. NORTH AMERICA GAS INSULATED SWITCHGEAR MARKET, BY TECHNOLOGY, 2022-2032 ($MILLION)
- TABLE 17. NORTH AMERICA GAS INSULATED SWITCHGEAR MARKET, BY COUNTRY, 2022-2032 ($MILLION)
- TABLE 18. U.S. GAS INSULATED SWITCHGEAR MARKET, BY VOLTAGE, 2022-2032 ($MILLION)
- TABLE 19. U.S. GAS INSULATED SWITCHGEAR MARKET, BY APPLICATION, 2022-2032 ($MILLION)
- TABLE 20. U.S. GAS INSULATED SWITCHGEAR MARKET, BY TECHNOLOGY, 2022-2032 ($MILLION)
- TABLE 21. CANADA GAS INSULATED SWITCHGEAR MARKET, BY VOLTAGE, 2022-2032 ($MILLION)
- TABLE 22. CANADA GAS INSULATED SWITCHGEAR MARKET, BY APPLICATION, 2022-2032 ($MILLION)
- TABLE 23. CANADA GAS INSULATED SWITCHGEAR MARKET, BY TECHNOLOGY, 2022-2032 ($MILLION)
- TABLE 24. MEXICO GAS INSULATED SWITCHGEAR MARKET, BY VOLTAGE, 2022-2032 ($MILLION)
- TABLE 25. MEXICO GAS INSULATED SWITCHGEAR MARKET, BY APPLICATION, 2022-2032 ($MILLION)
- TABLE 26. MEXICO GAS INSULATED SWITCHGEAR MARKET, BY TECHNOLOGY, 2022-2032 ($MILLION)
- TABLE 27. EUROPE GAS INSULATED SWITCHGEAR MARKET, BY VOLTAGE, 2022-2032 ($MILLION)
- TABLE 28. EUROPE GAS INSULATED SWITCHGEAR MARKET, BY APPLICATION, 2022-2032 ($MILLION)
- TABLE 29. EUROPE GAS INSULATED SWITCHGEAR MARKET, BY TECHNOLOGY, 2022-2032 ($MILLION)
- TABLE 30. EUROPE GAS INSULATED SWITCHGEAR MARKET, BY COUNTRY, 2022-2032 ($MILLION)
- TABLE 31. GERMANY GAS INSULATED SWITCHGEAR MARKET, BY VOLTAGE, 2022-2032 ($MILLION)
- TABLE 32. GERMANY GAS INSULATED SWITCHGEAR MARKET, BY APPLICATION, 2022-2032 ($MILLION)
- TABLE 33. GERMANY GAS INSULATED SWITCHGEAR MARKET, BY TECHNOLOGY, 2022-2032 ($MILLION)
- TABLE 34. UK GAS INSULATED SWITCHGEAR MARKET, BY VOLTAGE, 2022-2032 ($MILLION)
- TABLE 35. UK GAS INSULATED SWITCHGEAR MARKET, BY APPLICATION, 2022-2032 ($MILLION)
- TABLE 36. UK GAS INSULATED SWITCHGEAR MARKET, BY TECHNOLOGY, 2022-2032 ($MILLION)
- TABLE 37. FRANCE GAS INSULATED SWITCHGEAR MARKET, BY VOLTAGE, 2022-2032 ($MILLION)
- TABLE 38. FRANCE GAS INSULATED SWITCHGEAR MARKET, BY APPLICATION, 2022-2032 ($MILLION)
- TABLE 39. FRANCE GAS INSULATED SWITCHGEAR MARKET, BY TECHNOLOGY, 2022-2032 ($MILLION)
- TABLE 40. ITALY GAS INSULATED SWITCHGEAR MARKET, BY VOLTAGE, 2022-2032 ($MILLION)
- TABLE 41. ITALY GAS INSULATED SWITCHGEAR MARKET, BY APPLICATION, 2022-2032 ($MILLION)
- TABLE 42. ITALY GAS INSULATED SWITCHGEAR MARKET, BY TECHNOLOGY, 2022-2032 ($MILLION)
- TABLE 43. SPAIN GAS INSULATED SWITCHGEAR MARKET, BY VOLTAGE, 2022-2032 ($MILLION)
- TABLE 44. SPAIN GAS INSULATED SWITCHGEAR MARKET, BY APPLICATION, 2022-2032 ($MILLION)
- TABLE 45. SPAIN GAS INSULATED SWITCHGEAR MARKET, BY TECHNOLOGY, 2022-2032 ($MILLION)
- TABLE 46. REST OF EUROPE GAS INSULATED SWITCHGEAR MARKET, BY VOLTAGE, 2022-2032 ($MILLION)
- TABLE 47. REST OF EUROPE GAS INSULATED SWITCHGEAR MARKET, BY APPLICATION, 2022-2032 ($MILLION)
- TABLE 48. REST OF EUROPE GAS INSULATED SWITCHGEAR MARKET, BY TECHNOLOGY, 2022-2032 ($MILLION)
- TABLE 49. ASIA-PACIFIC GAS INSULATED SWITCHGEAR MARKET, BY VOLTAGE, 2022-2032 ($MILLION)
- TABLE 50. ASIA-PACIFIC GAS INSULATED SWITCHGEAR MARKET, BY APPLICATION, 2022-2032 ($MILLION)
- TABLE 51. ASIA-PACIFIC GAS INSULATED SWITCHGEAR MARKET, BY TECHNOLOGY, 2022-2032 ($MILLION)
- TABLE 52. ASIA-PACIFIC GAS INSULATED SWITCHGEAR MARKET, BY COUNTRY, 2022-2032 ($MILLION)
- TABLE 53. CHINA GAS INSULATED SWITCHGEAR MARKET, BY VOLTAGE, 2022-2032 ($MILLION)
- TABLE 54. CHINA GAS INSULATED SWITCHGEAR MARKET, BY APPLICATION, 2022-2032 ($MILLION)
- TABLE 55. CHINA GAS INSULATED SWITCHGEAR MARKET, BY TECHNOLOGY, 2022-2032 ($MILLION)
- TABLE 56. JAPAN GAS INSULATED SWITCHGEAR MARKET, BY VOLTAGE, 2022-2032 ($MILLION)
- TABLE 57. JAPAN GAS INSULATED SWITCHGEAR MARKET, BY APPLICATION, 2022-2032 ($MILLION)
- TABLE 58. JAPAN GAS INSULATED SWITCHGEAR MARKET, BY TECHNOLOGY, 2022-2032 ($MILLION)
- TABLE 59. INDIA GAS INSULATED SWITCHGEAR MARKET, BY VOLTAGE, 2022-2032 ($MILLION)
- TABLE 60. INDIA GAS INSULATED SWITCHGEAR MARKET, BY APPLICATION, 2022-2032 ($MILLION)
- TABLE 61. INDIA GAS INSULATED SWITCHGEAR MARKET, BY TECHNOLOGY, 2022-2032 ($MILLION)
- TABLE 62. SOUTH KOREA GAS INSULATED SWITCHGEAR MARKET, BY VOLTAGE, 2022-2032 ($MILLION)
- TABLE 63. SOUTH KOREA GAS INSULATED SWITCHGEAR MARKET, BY APPLICATION, 2022-2032 ($MILLION)
- TABLE 64. SOUTH KOREA GAS INSULATED SWITCHGEAR MARKET, BY TECHNOLOGY, 2022-2032 ($MILLION)
- TABLE 65. AUSTRALIA GAS INSULATED SWITCHGEAR MARKET, BY VOLTAGE, 2022-2032 ($MILLION)
- TABLE 66. AUSTRALIA GAS INSULATED SWITCHGEAR MARKET, BY APPLICATION, 2022-2032 ($MILLION)
- TABLE 67. AUSTRALIA GAS INSULATED SWITCHGEAR MARKET, BY TECHNOLOGY, 2022-2032 ($MILLION)
- TABLE 68. REST OF ASIA-PACIFIC GAS INSULATED SWITCHGEAR MARKET, BY VOLTAGE, 2022-2032 ($MILLION)
- TABLE 69. REST OF ASIA-PACIFIC GAS INSULATED SWITCHGEAR MARKET, BY APPLICATION, 2022-2032 ($MILLION)
- TABLE 70. REST OF ASIA-PACIFIC GAS INSULATED SWITCHGEAR MARKET, BY TECHNOLOGY, 2022-2032 ($MILLION)
- TABLE 71. LAMEA GAS INSULATED SWITCHGEAR MARKET, BY VOLTAGE, 2022-2032 ($MILLION)
- TABLE 72. LAMEA GAS INSULATED SWITCHGEAR MARKET, BY APPLICATION, 2022-2032 ($MILLION)
- TABLE 73. LAMEA GAS INSULATED SWITCHGEAR MARKET, BY TECHNOLOGY, 2022-2032 ($MILLION)
- TABLE 74. LAMEA GAS INSULATED SWITCHGEAR MARKET, BY COUNTRY, 2022-2032 ($MILLION)
- TABLE 75. BRAZIL GAS INSULATED SWITCHGEAR MARKET, BY VOLTAGE, 2022-2032 ($MILLION)
- TABLE 76. BRAZIL GAS INSULATED SWITCHGEAR MARKET, BY APPLICATION, 2022-2032 ($MILLION)
- TABLE 77. BRAZIL GAS INSULATED SWITCHGEAR MARKET, BY TECHNOLOGY, 2022-2032 ($MILLION)
- TABLE 78. SAUDI ARABIA GAS INSULATED SWITCHGEAR MARKET, BY VOLTAGE, 2022-2032 ($MILLION)
- TABLE 79. SAUDI ARABIA GAS INSULATED SWITCHGEAR MARKET, BY APPLICATION, 2022-2032 ($MILLION)
- TABLE 80. SAUDI ARABIA GAS INSULATED SWITCHGEAR MARKET, BY TECHNOLOGY, 2022-2032 ($MILLION)
- TABLE 81. SOUTH AFRICA GAS INSULATED SWITCHGEAR MARKET, BY VOLTAGE, 2022-2032 ($MILLION)
- TABLE 82. SOUTH AFRICA GAS INSULATED SWITCHGEAR MARKET, BY APPLICATION, 2022-2032 ($MILLION)
- TABLE 83. SOUTH AFRICA GAS INSULATED SWITCHGEAR MARKET, BY TECHNOLOGY, 2022-2032 ($MILLION)
- TABLE 84. REST OF LAMEA GAS INSULATED SWITCHGEAR MARKET, BY VOLTAGE, 2022-2032 ($MILLION)
- TABLE 85. REST OF LAMEA GAS INSULATED SWITCHGEAR MARKET, BY APPLICATION, 2022-2032 ($MILLION)
- TABLE 86. REST OF LAMEA GAS INSULATED SWITCHGEAR MARKET, BY TECHNOLOGY, 2022-2032 ($MILLION)
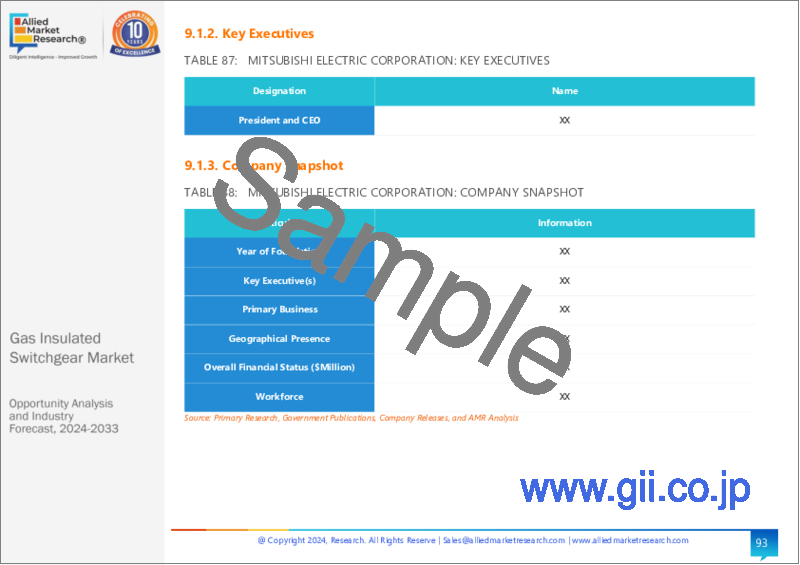
- TABLE 87. MITSUBISHI ELECTRIC CORPORATION: KEY EXECUTIVES
- TABLE 88. MITSUBISHI ELECTRIC CORPORATION: COMPANY SNAPSHOT
- TABLE 89. MITSUBISHI ELECTRIC CORPORATION: PRODUCT SEGMENTS
- TABLE 90. MITSUBISHI ELECTRIC CORPORATION: SERVICE SEGMENTS
- TABLE 91. MITSUBISHI ELECTRIC CORPORATION: PRODUCT PORTFOLIO
- TABLE 92. MITSUBISHI ELECTRIC CORPORATION: KEY STRATERGIES
- TABLE 93. STATE GRID CORPORATION OF CHINA LIMITED: KEY EXECUTIVES
- TABLE 94. STATE GRID CORPORATION OF CHINA LIMITED: COMPANY SNAPSHOT
- TABLE 95. STATE GRID CORPORATION OF CHINA LIMITED: PRODUCT SEGMENTS
- TABLE 96. STATE GRID CORPORATION OF CHINA LIMITED: SERVICE SEGMENTS
- TABLE 97. STATE GRID CORPORATION OF CHINA LIMITED: PRODUCT PORTFOLIO
- TABLE 98. STATE GRID CORPORATION OF CHINA LIMITED: KEY STRATERGIES
- TABLE 99. ABB: KEY EXECUTIVES
- TABLE 100. ABB: COMPANY SNAPSHOT
- TABLE 101. ABB: PRODUCT SEGMENTS
- TABLE 102. ABB: SERVICE SEGMENTS
- TABLE 103. ABB: PRODUCT PORTFOLIO
- TABLE 104. ABB: KEY STRATERGIES
- TABLE 105. HITACHI LTD.: KEY EXECUTIVES
- TABLE 106. HITACHI LTD.: COMPANY SNAPSHOT
- TABLE 107. HITACHI LTD.: PRODUCT SEGMENTS
- TABLE 108. HITACHI LTD.: SERVICE SEGMENTS
- TABLE 109. HITACHI LTD.: PRODUCT PORTFOLIO
- TABLE 110. HITACHI LTD.: KEY STRATERGIES
- TABLE 111. SIEMENS AG: KEY EXECUTIVES
- TABLE 112. SIEMENS AG: COMPANY SNAPSHOT
- TABLE 113. SIEMENS AG: PRODUCT SEGMENTS
- TABLE 114. SIEMENS AG: SERVICE SEGMENTS
- TABLE 115. SIEMENS AG: PRODUCT PORTFOLIO
- TABLE 116. SIEMENS AG: KEY STRATERGIES
- TABLE 117. HYUNDAI HEAVY INDUSTRIES CO LTD: KEY EXECUTIVES
- TABLE 118. HYUNDAI HEAVY INDUSTRIES CO LTD: COMPANY SNAPSHOT
- TABLE 119. HYUNDAI HEAVY INDUSTRIES CO LTD: PRODUCT SEGMENTS
- TABLE 120. HYUNDAI HEAVY INDUSTRIES CO LTD: SERVICE SEGMENTS
- TABLE 121. HYUNDAI HEAVY INDUSTRIES CO LTD: PRODUCT PORTFOLIO
- TABLE 122. HYUNDAI HEAVY INDUSTRIES CO LTD: KEY STRATERGIES
- TABLE 123. TOSHIBA CORPORATION: KEY EXECUTIVES
- TABLE 124. TOSHIBA CORPORATION: COMPANY SNAPSHOT
- TABLE 125. TOSHIBA CORPORATION: PRODUCT SEGMENTS
- TABLE 126. TOSHIBA CORPORATION: SERVICE SEGMENTS
- TABLE 127. TOSHIBA CORPORATION: PRODUCT PORTFOLIO
- TABLE 128. TOSHIBA CORPORATION: KEY STRATERGIES
- TABLE 129. BHARAT HEAVY ELECTRICALS LIMITED: KEY EXECUTIVES
- TABLE 130. BHARAT HEAVY ELECTRICALS LIMITED: COMPANY SNAPSHOT
- TABLE 131. BHARAT HEAVY ELECTRICALS LIMITED: PRODUCT SEGMENTS
- TABLE 132. BHARAT HEAVY ELECTRICALS LIMITED: SERVICE SEGMENTS
- TABLE 133. BHARAT HEAVY ELECTRICALS LIMITED: PRODUCT PORTFOLIO
- TABLE 134. BHARAT HEAVY ELECTRICALS LIMITED: KEY STRATERGIES
- TABLE 135. SCHNEIDER ELECTRIC: KEY EXECUTIVES
- TABLE 136. SCHNEIDER ELECTRIC: COMPANY SNAPSHOT
- TABLE 137. SCHNEIDER ELECTRIC: PRODUCT SEGMENTS
- TABLE 138. SCHNEIDER ELECTRIC: SERVICE SEGMENTS
- TABLE 139. SCHNEIDER ELECTRIC: PRODUCT PORTFOLIO
- TABLE 140. SCHNEIDER ELECTRIC: KEY STRATERGIES
LIST OF FIGURES
- FIGURE 01. GAS INSULATED SWITCHGEAR MARKET, 2022-2032
- FIGURE 02. SEGMENTATION OF GAS INSULATED SWITCHGEAR MARKET,2022-2032
- FIGURE 03. TOP IMPACTING FACTORS IN GAS INSULATED SWITCHGEAR MARKET
- FIGURE 04. TOP INVESTMENT POCKETS IN GAS INSULATED SWITCHGEAR MARKET (2023-2032)
- FIGURE 05. BARGAINING POWER OF SUPPLIERS
- FIGURE 06. BARGAINING POWER OF BUYERS
- FIGURE 07. THREAT OF SUBSTITUTION
- FIGURE 08. THREAT OF SUBSTITUTION
- FIGURE 09. COMPETITIVE RIVALRY
- FIGURE 10. GLOBAL GAS INSULATED SWITCHGEAR MARKET:DRIVERS, RESTRAINTS AND OPPORTUNITIES
- FIGURE 11. PATENT ANALYSIS BY COMPANY
- FIGURE 12. PATENT ANALYSIS BY COUNTRY
- FIGURE 13. GAS INSULATED SWITCHGEAR MARKET, BY VOLTAGE, 2022 AND 2032(%)
- FIGURE 14. COMPARATIVE SHARE ANALYSIS OF GAS INSULATED SWITCHGEAR MARKET FOR HIGH, BY COUNTRY 2022 AND 2032(%)
- FIGURE 15. COMPARATIVE SHARE ANALYSIS OF GAS INSULATED SWITCHGEAR MARKET FOR MEDIUM, BY COUNTRY 2022 AND 2032(%)
- FIGURE 16. COMPARATIVE SHARE ANALYSIS OF GAS INSULATED SWITCHGEAR MARKET FOR LOW, BY COUNTRY 2022 AND 2032(%)
- FIGURE 17. GAS INSULATED SWITCHGEAR MARKET, BY APPLICATION, 2022 AND 2032(%)
- FIGURE 18. COMPARATIVE SHARE ANALYSIS OF GAS INSULATED SWITCHGEAR MARKET FOR RESIDENTIAL AND COMMERCIAL, BY COUNTRY 2022 AND 2032(%)
- FIGURE 19. COMPARATIVE SHARE ANALYSIS OF GAS INSULATED SWITCHGEAR MARKET FOR INDUSTRIAL, BY COUNTRY 2022 AND 2032(%)
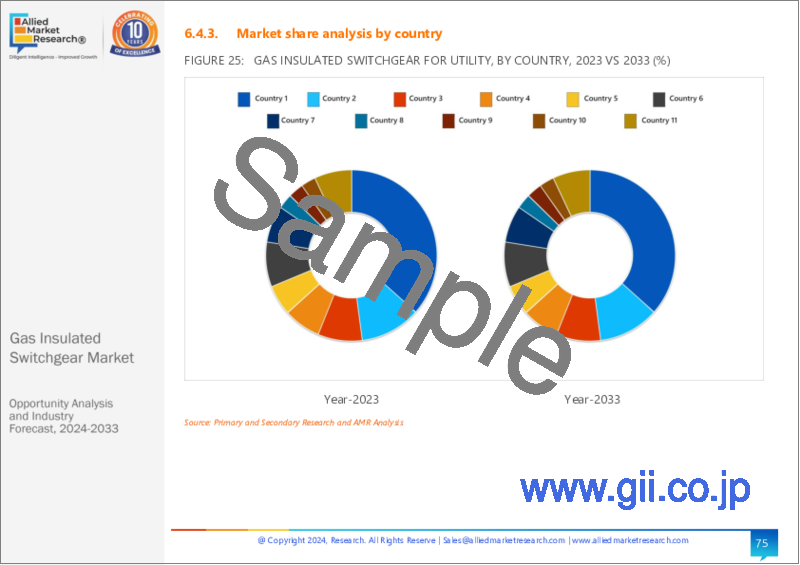
- FIGURE 20. COMPARATIVE SHARE ANALYSIS OF GAS INSULATED SWITCHGEAR MARKET FOR UTILITY, BY COUNTRY 2022 AND 2032(%)
- FIGURE 21. GAS INSULATED SWITCHGEAR MARKET, BY TECHNOLOGY, 2022 AND 2032(%)
- FIGURE 22. COMPARATIVE SHARE ANALYSIS OF GAS INSULATED SWITCHGEAR MARKET FOR HYBRID SWITCHGEAR, BY COUNTRY 2022 AND 2032(%)
- FIGURE 23. COMPARATIVE SHARE ANALYSIS OF GAS INSULATED SWITCHGEAR MARKET FOR INTEGRATED THREE PHASE, BY COUNTRY 2022 AND 2032(%)
- FIGURE 24. COMPARATIVE SHARE ANALYSIS OF GAS INSULATED SWITCHGEAR MARKET FOR COMPACT GAS INSULATED SWITCHGEAR, BY COUNTRY 2022 AND 2032(%)
- FIGURE 25. GAS INSULATED SWITCHGEAR MARKET BY REGION, 2022 AND 2032(%)
- FIGURE 26. U.S. GAS INSULATED SWITCHGEAR MARKET, 2022-2032 ($MILLION)
- FIGURE 27. CANADA GAS INSULATED SWITCHGEAR MARKET, 2022-2032 ($MILLION)
- FIGURE 28. MEXICO GAS INSULATED SWITCHGEAR MARKET, 2022-2032 ($MILLION)
- FIGURE 29. GERMANY GAS INSULATED SWITCHGEAR MARKET, 2022-2032 ($MILLION)
- FIGURE 30. UK GAS INSULATED SWITCHGEAR MARKET, 2022-2032 ($MILLION)
- FIGURE 31. FRANCE GAS INSULATED SWITCHGEAR MARKET, 2022-2032 ($MILLION)
- FIGURE 32. ITALY GAS INSULATED SWITCHGEAR MARKET, 2022-2032 ($MILLION)
- FIGURE 33. SPAIN GAS INSULATED SWITCHGEAR MARKET, 2022-2032 ($MILLION)
- FIGURE 34. REST OF EUROPE GAS INSULATED SWITCHGEAR MARKET, 2022-2032 ($MILLION)
- FIGURE 35. CHINA GAS INSULATED SWITCHGEAR MARKET, 2022-2032 ($MILLION)
- FIGURE 36. JAPAN GAS INSULATED SWITCHGEAR MARKET, 2022-2032 ($MILLION)
- FIGURE 37. INDIA GAS INSULATED SWITCHGEAR MARKET, 2022-2032 ($MILLION)
- FIGURE 38. SOUTH KOREA GAS INSULATED SWITCHGEAR MARKET, 2022-2032 ($MILLION)
- FIGURE 39. AUSTRALIA GAS INSULATED SWITCHGEAR MARKET, 2022-2032 ($MILLION)
- FIGURE 40. REST OF ASIA-PACIFIC GAS INSULATED SWITCHGEAR MARKET, 2022-2032 ($MILLION)
- FIGURE 41. BRAZIL GAS INSULATED SWITCHGEAR MARKET, 2022-2032 ($MILLION)
- FIGURE 42. SAUDI ARABIA GAS INSULATED SWITCHGEAR MARKET, 2022-2032 ($MILLION)
- FIGURE 43. SOUTH AFRICA GAS INSULATED SWITCHGEAR MARKET, 2022-2032 ($MILLION)
- FIGURE 44. REST OF LAMEA GAS INSULATED SWITCHGEAR MARKET, 2022-2032 ($MILLION)
- FIGURE 45. TOP WINNING STRATEGIES, BY YEAR
- FIGURE 46. TOP WINNING STRATEGIES, BY DEVELOPMENT
- FIGURE 47. TOP WINNING STRATEGIES, BY COMPANY
- FIGURE 48. PRODUCT MAPPING OF TOP 10 PLAYERS
- FIGURE 49. COMPETITIVE DASHBOARD
- FIGURE 50. COMPETITIVE HEATMAP: GAS INSULATED SWITCHGEAR MARKET
- FIGURE 51. TOP PLAYER POSITIONING, 2022
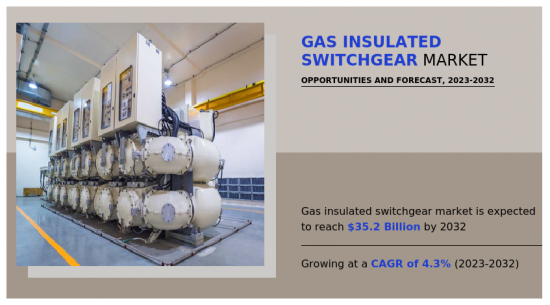
The global gas insulated switchgear market was valued at $23.0 billion in 2022, and is projected to reach $35.2 billion by 2032, growing at a CAGR of 4.3% from 2023 to 2032.
Electrical systems use gas-insulated switchgear (GIS) to isolate, control, and safeguard electrical equipment. Sulfur hexafluoride (SF6) gas is used as an insulating medium in GIS, as opposed to conventional air-insulated switchgear (AIS), in order to obtain a compact design and enhanced electrical performance. GIS enclosures are built as metal-clad, sealed structures that provide strong resistance to environmental factors. The main insulating medium is SF6 gas due to its excellent dielectric qualities and strong capacity to extinguish electrical sparks.
To regulate and isolate electrical circuits, GIS integrates a range of disconnectors, earthing switches, and circuit breakers. Busbars are made of conductive materials, such copper or aluminum, which guarantees effective power distribution throughout the switchgear. Substation layouts can be made more space-efficient with GIS than with standard AIS designs. The overall dependability of GIS is improved by its sealed architecture and lack of exposure to outside influences. The enclosed design limits contact with live parts, and the use of SF6 gas lowers the risk of fire and explosion.
High-voltage substations that handle the transmission and distribution of electrical power frequently employ GIS. GIS can be used in a variety of industrial settings when limited space calls for a dependable and small solution. Substations linked to renewable energy sources, such solar and wind power, can include GIS. SF6 is a strong greenhouse gas with a high potential for global warming, despite its superior insulating qualities (GWP). The goal of ongoing work is to find substitute gasses or less environmentally harmful technologies. The ongoing dependability of GIS depends on routine maintenance and monitoring practices. This includes evaluating the state of SF6 gas, carrying out examinations, and carrying out any required maintenance or replacements.
Even while air-insulated switchgear is frequently employed, it does have some drawbacks, including a greater physical footprint and poorer insulation performance in extremely corrosive or polluted conditions. On the other hand, when a more compact design or better insulation performance are needed, gas-insulated switchgear, or GIS, is selected. In response to environmental concerns regarding sulfur hexafluoride (SF6) and its high global warming potential (GWP), industry efforts are being made to develop and install SF6-free solutions for gas-insulated switchgear (GIS). SF6-free gas-insulated switchgear uses different insulating gases or technologies to alleviate these environmental problems.
Moreover, there is a lot of potential for GIS manufacturers to meet environmental standards and satisfy the growing market demand for sustainable solutions through the development and production of SF6-free alternatives. The incorporation of GIS into smart grids presents opportunities for enhanced power distribution network monitoring, control, and communication. Growing infrastructure development and urbanization in developing nations present chances for GIS producers to increase their market share in these areas.
A trend in which alternative insulating gases or technologies are used to create and market GIS products devoid of SF6 to address environmental concerns. Internet of Things (IoT) and digital technology integration in GIS for enhanced operational efficiency, predictive maintenance, and real-time monitoring. To accommodate space limits and make installation easier in urban settings, manufacturers are concentrating on creating GIS designs that are compact and modular. increased partnerships and collaborations to foster innovation and handle market difficulties amongst GIS manufacturers, utilities, and research institutes.
The gas insulated switchgear market is segmented based on voltage, application, technology, and region. By voltage, the market is divided into high voltage, medium voltage, and low voltage. On the basis of the application, it is categorized into residential & commercial, industrial, and utility. On the basis of the technology, the gas insulated switchgear market is classified into hybrid switchgear, integrated three phase, and compact gas insulated switchgear. Region-wise, the gas insulated switchgear market analysis is done across North America, Europe, Asia-Pacific, and LAMEA.
The major players operating in the global gas insulated switchgear industry are Mitsubishi Electric Co., State Grid Co. Of China, Abb Tech Ag, Hitachi Ltd., Siemens Ag, Hyundai Heavy Industries Co. Ltd., Toshiba Co., Bharat Heavy Electricals Limited, Schneider Electric, and Crompton Greaves Limited. Other players include Fuji Electric, Eaton Corporation plc, General Electric, Nissan Electric Co. Ltd., Meidensha Corporation, and others.
Strategic developments undertaken by key players.
- The Hitachi and Schneider Electric firms collaborated in August 2022 to offer portfolios in medium- and high-voltage technologies that would increase customer value and hasten the deployment of sustainable and intelligent energy management solutions. Both businesses were able to expand their product lines with this partnership.
- ABB and Samsung Electronics collaborated in April 2022 to develop energy-saving and energy-management technologies. The companies were able to better serve customers by transferring electricity loads, improving device management, and providing access to home automation technology through this arrangement.
- Eaton Corporation plc acquired Royal Power Solutions, a US-based manufacturer of electrical connector components, in February 2021. The acquisition improved the company's line of products.
Key Benefits For Stakeholders
- This report provides a quantitative analysis of the market segments, current trends, estimations, and dynamics of the gas insulated switchgear market analysis from 2022 to 2032 to identify the prevailing gas insulated switchgear market opportunities.
- The market research is offered along with information related to key drivers, restraints, and opportunities.
- Porter's five forces analysis highlights the potency of buyers and suppliers to enable stakeholders make profit-oriented business decisions and strengthen their supplier-buyer network.
- In-depth analysis of the gas insulated switchgear market segmentation assists to determine the prevailing market opportunities.
- Major countries in each region are mapped according to their revenue contribution to the global market.
- Market player positioning facilitates benchmarking and provides a clear understanding of the present position of the market players.
- The report includes the analysis of the regional as well as global gas insulated switchgear market trends, key players, market segments, application areas, and market growth strategies.
Additional benefits you will get with this purchase are:
- Quarterly Update and* (only available with a corporate license, on listed price)
- 5 additional Company Profile of client Choice pre- or Post-purchase, as a free update.
- Free Upcoming Version on the Purchase of Five and Enterprise User License.
- 16 analyst hours of support* (post-purchase, if you find additional data requirements upon review of the report, you may receive support amounting to 16 analyst hours to solve questions, and post-sale queries)
- 15% Free Customization* (in case the scope or segment of the report does not match your requirements, 15% is equivalent to 3 working days of free work, applicable once)
- Free data Pack on the Five and Enterprise User License. (Excel version of the report)
- Free Updated report if the report is 6-12 months old or older.
- 24-hour priority response*
- Free Industry updates and white papers.
Possible Customization with this report (with additional cost and timeline, please talk to the sales executive to know more)
- Additional company profiles with specific to client's interest
- Additional country or region analysis- market size and forecast
- Historic market data
- Key player details (including location, contact details, supplier/vendor network etc. in excel format)
- List of customers/consumers/raw material suppliers- value chain analysis
- SWOT Analysis
Key Market Segments
By Technology
- Hybrid Switchgear
- Integrated Three Phase
- Compact Gas Insulated Switchgear
By Voltage
- High
- Medium
- Low
By Application
- Residential and Commercial
- Industrial
- Utility
By Region
- North America
- U.S.
- Canada
- Mexico
- Europe
- Germany
- UK
- France
- Italy
- Spain
- Rest of Europe
- Asia-Pacific
- China
- Japan
- India
- South Korea
- Australia
- Rest of Asia-Pacific
- LAMEA
- Brazil
- Saudi Arabia
- South Africa
- Rest of LAMEA
Key Market Players:
- Mitsubishi Electric Corporation
- State Grid Corporation of China Limited
- ABB
- Hitachi Ltd.
- Siemens AG
- Hyundai Heavy Industries Co Ltd
- TOSHIBA CORPORATION
- Bharat Heavy Electricals Limited
- Schneider Electric
TABLE OF CONTENTS
CHAPTER 1: INTRODUCTION
- 1.1. Report description
- 1.2. Key market segments
- 1.3. Key benefits to the stakeholders
- 1.4. Research methodology
- 1.4.1. Primary research
- 1.4.2. Secondary research
- 1.4.3. Analyst tools and models
CHAPTER 2: EXECUTIVE SUMMARY
- 2.1. CXO Perspective
CHAPTER 3: MARKET OVERVIEW
- 3.1. Market definition and scope
- 3.2. Key findings
- 3.2.1. Top impacting factors
- 3.2.2. Top investment pockets
- 3.3. Porter's five forces analysis
- 3.4. Market dynamics
- 3.4.1. Drivers
- 3.4.2. Restraints
- 3.4.3. Opportunities
- 3.5. Value Chain Analysis
- 3.6. Patent Landscape
CHAPTER 4: GAS INSULATED SWITCHGEAR MARKET, BY VOLTAGE
- 4.1. Overview
- 4.1.1. Market size and forecast
- 4.2. High
- 4.2.1. Key market trends, growth factors and opportunities
- 4.2.2. Market size and forecast, by region
- 4.2.3. Market share analysis by country
- 4.3. Medium
- 4.3.1. Key market trends, growth factors and opportunities
- 4.3.2. Market size and forecast, by region
- 4.3.3. Market share analysis by country
- 4.4. Low
- 4.4.1. Key market trends, growth factors and opportunities
- 4.4.2. Market size and forecast, by region
- 4.4.3. Market share analysis by country
CHAPTER 5: GAS INSULATED SWITCHGEAR MARKET, BY APPLICATION
- 5.1. Overview
- 5.1.1. Market size and forecast
- 5.2. Residential and Commercial
- 5.2.1. Key market trends, growth factors and opportunities
- 5.2.2. Market size and forecast, by region
- 5.2.3. Market share analysis by country
- 5.3. Industrial
- 5.3.1. Key market trends, growth factors and opportunities
- 5.3.2. Market size and forecast, by region
- 5.3.3. Market share analysis by country
- 5.4. Utility
- 5.4.1. Key market trends, growth factors and opportunities
- 5.4.2. Market size and forecast, by region
- 5.4.3. Market share analysis by country
CHAPTER 6: GAS INSULATED SWITCHGEAR MARKET, BY TECHNOLOGY
- 6.1. Overview
- 6.1.1. Market size and forecast
- 6.2. Hybrid Switchgear
- 6.2.1. Key market trends, growth factors and opportunities
- 6.2.2. Market size and forecast, by region
- 6.2.3. Market share analysis by country
- 6.3. Integrated Three Phase
- 6.3.1. Key market trends, growth factors and opportunities
- 6.3.2. Market size and forecast, by region
- 6.3.3. Market share analysis by country
- 6.4. Compact Gas Insulated Switchgear
- 6.4.1. Key market trends, growth factors and opportunities
- 6.4.2. Market size and forecast, by region
- 6.4.3. Market share analysis by country
CHAPTER 7: GAS INSULATED SWITCHGEAR MARKET, BY REGION
- 7.1. Overview
- 7.1.1. Market size and forecast By Region
- 7.2. North America
- 7.2.1. Key market trends, growth factors and opportunities
- 7.2.2. Market size and forecast, by Voltage
- 7.2.3. Market size and forecast, by Application
- 7.2.4. Market size and forecast, by Technology
- 7.2.5. Market size and forecast, by country
- 7.2.5.1. U.S.
- 7.2.5.1.1. Market size and forecast, by Voltage
- 7.2.5.1.2. Market size and forecast, by Application
- 7.2.5.1.3. Market size and forecast, by Technology
- 7.2.5.2. Canada
- 7.2.5.2.1. Market size and forecast, by Voltage
- 7.2.5.2.2. Market size and forecast, by Application
- 7.2.5.2.3. Market size and forecast, by Technology
- 7.2.5.3. Mexico
- 7.2.5.3.1. Market size and forecast, by Voltage
- 7.2.5.3.2. Market size and forecast, by Application
- 7.2.5.3.3. Market size and forecast, by Technology
- 7.3. Europe
- 7.3.1. Key market trends, growth factors and opportunities
- 7.3.2. Market size and forecast, by Voltage
- 7.3.3. Market size and forecast, by Application
- 7.3.4. Market size and forecast, by Technology
- 7.3.5. Market size and forecast, by country
- 7.3.5.1. Germany
- 7.3.5.1.1. Market size and forecast, by Voltage
- 7.3.5.1.2. Market size and forecast, by Application
- 7.3.5.1.3. Market size and forecast, by Technology
- 7.3.5.2. UK
- 7.3.5.2.1. Market size and forecast, by Voltage
- 7.3.5.2.2. Market size and forecast, by Application
- 7.3.5.2.3. Market size and forecast, by Technology
- 7.3.5.3. France
- 7.3.5.3.1. Market size and forecast, by Voltage
- 7.3.5.3.2. Market size and forecast, by Application
- 7.3.5.3.3. Market size and forecast, by Technology
- 7.3.5.4. Italy
- 7.3.5.4.1. Market size and forecast, by Voltage
- 7.3.5.4.2. Market size and forecast, by Application
- 7.3.5.4.3. Market size and forecast, by Technology
- 7.3.5.5. Spain
- 7.3.5.5.1. Market size and forecast, by Voltage
- 7.3.5.5.2. Market size and forecast, by Application
- 7.3.5.5.3. Market size and forecast, by Technology
- 7.3.5.6. Rest of Europe
- 7.3.5.6.1. Market size and forecast, by Voltage
- 7.3.5.6.2. Market size and forecast, by Application
- 7.3.5.6.3. Market size and forecast, by Technology
- 7.4. Asia-Pacific
- 7.4.1. Key market trends, growth factors and opportunities
- 7.4.2. Market size and forecast, by Voltage
- 7.4.3. Market size and forecast, by Application
- 7.4.4. Market size and forecast, by Technology
- 7.4.5. Market size and forecast, by country
- 7.4.5.1. China
- 7.4.5.1.1. Market size and forecast, by Voltage
- 7.4.5.1.2. Market size and forecast, by Application
- 7.4.5.1.3. Market size and forecast, by Technology
- 7.4.5.2. Japan
- 7.4.5.2.1. Market size and forecast, by Voltage
- 7.4.5.2.2. Market size and forecast, by Application
- 7.4.5.2.3. Market size and forecast, by Technology
- 7.4.5.3. India
- 7.4.5.3.1. Market size and forecast, by Voltage
- 7.4.5.3.2. Market size and forecast, by Application
- 7.4.5.3.3. Market size and forecast, by Technology
- 7.4.5.4. South Korea
- 7.4.5.4.1. Market size and forecast, by Voltage
- 7.4.5.4.2. Market size and forecast, by Application
- 7.4.5.4.3. Market size and forecast, by Technology
- 7.4.5.5. Australia
- 7.4.5.5.1. Market size and forecast, by Voltage
- 7.4.5.5.2. Market size and forecast, by Application
- 7.4.5.5.3. Market size and forecast, by Technology
- 7.4.5.6. Rest of Asia-Pacific
- 7.4.5.6.1. Market size and forecast, by Voltage
- 7.4.5.6.2. Market size and forecast, by Application
- 7.4.5.6.3. Market size and forecast, by Technology
- 7.5. LAMEA
- 7.5.1. Key market trends, growth factors and opportunities
- 7.5.2. Market size and forecast, by Voltage
- 7.5.3. Market size and forecast, by Application
- 7.5.4. Market size and forecast, by Technology
- 7.5.5. Market size and forecast, by country
- 7.5.5.1. Brazil
- 7.5.5.1.1. Market size and forecast, by Voltage
- 7.5.5.1.2. Market size and forecast, by Application
- 7.5.5.1.3. Market size and forecast, by Technology
- 7.5.5.2. Saudi Arabia
- 7.5.5.2.1. Market size and forecast, by Voltage
- 7.5.5.2.2. Market size and forecast, by Application
- 7.5.5.2.3. Market size and forecast, by Technology
- 7.5.5.3. South Africa
- 7.5.5.3.1. Market size and forecast, by Voltage
- 7.5.5.3.2. Market size and forecast, by Application
- 7.5.5.3.3. Market size and forecast, by Technology
- 7.5.5.4. Rest of LAMEA
- 7.5.5.4.1. Market size and forecast, by Voltage
- 7.5.5.4.2. Market size and forecast, by Application
- 7.5.5.4.3. Market size and forecast, by Technology
CHAPTER 8: COMPETITIVE LANDSCAPE
- 8.1. Introduction
- 8.2. Top winning strategies
- 8.3. Product mapping of top 10 player
- 8.4. Competitive dashboard
- 8.5. Competitive heatmap
- 8.6. Top player positioning, 2022
CHAPTER 9: COMPANY PROFILES
- 9.1. Mitsubishi Electric Corporation
- 9.1.1. Company overview
- 9.1.2. Key executives
- 9.1.3. Company snapshot
- 9.1.4. Operating business segments
- 9.1.5. Product portfolio
- 9.1.6. Business performance
- 9.1.7. Key strategic moves and developments
- 9.2. State Grid Corporation of China Limited
- 9.2.1. Company overview
- 9.2.2. Key executives
- 9.2.3. Company snapshot
- 9.2.4. Operating business segments
- 9.2.5. Product portfolio
- 9.2.6. Business performance
- 9.2.7. Key strategic moves and developments
- 9.3. ABB
- 9.3.1. Company overview
- 9.3.2. Key executives
- 9.3.3. Company snapshot
- 9.3.4. Operating business segments
- 9.3.5. Product portfolio
- 9.3.6. Business performance
- 9.3.7. Key strategic moves and developments
- 9.4. Hitachi Ltd.
- 9.4.1. Company overview
- 9.4.2. Key executives
- 9.4.3. Company snapshot
- 9.4.4. Operating business segments
- 9.4.5. Product portfolio
- 9.4.6. Business performance
- 9.4.7. Key strategic moves and developments
- 9.5. Siemens AG
- 9.5.1. Company overview
- 9.5.2. Key executives
- 9.5.3. Company snapshot
- 9.5.4. Operating business segments
- 9.5.5. Product portfolio
- 9.5.6. Business performance
- 9.5.7. Key strategic moves and developments
- 9.6. Hyundai Heavy Industries Co Ltd
- 9.6.1. Company overview
- 9.6.2. Key executives
- 9.6.3. Company snapshot
- 9.6.4. Operating business segments
- 9.6.5. Product portfolio
- 9.6.6. Business performance
- 9.6.7. Key strategic moves and developments
- 9.7. TOSHIBA CORPORATION
- 9.7.1. Company overview
- 9.7.2. Key executives
- 9.7.3. Company snapshot
- 9.7.4. Operating business segments
- 9.7.5. Product portfolio
- 9.7.6. Business performance
- 9.7.7. Key strategic moves and developments
- 9.8. Bharat Heavy Electricals Limited
- 9.8.1. Company overview
- 9.8.2. Key executives
- 9.8.3. Company snapshot
- 9.8.4. Operating business segments
- 9.8.5. Product portfolio
- 9.8.6. Business performance
- 9.8.7. Key strategic moves and developments
- 9.9. Schneider Electric
- 9.9.1. Company overview
- 9.9.2. Key executives
- 9.9.3. Company snapshot
- 9.9.4. Operating business segments
- 9.9.5. Product portfolio
- 9.9.6. Business performance
- 9.9.7. Key strategic moves and developments
