
|
市場調査レポート
商品コード
1446891
防水製品市場:製品タイプ別、用途別:世界の機会分析と産業予測、2023年~2033年Waterproofing Products Market By Product Type, By Application : Global Opportunity Analysis and Industry Forecast, 2023-2033 |
||||||
|
|||||||

| 防水製品市場:製品タイプ別、用途別:世界の機会分析と産業予測、2023年~2033年 |
|
出版日: 2024年01月30日
発行: Allied Market Research
ページ情報: 英文 250 Pages
納期: 2~3営業日
|

- 全表示
- 概要
- 図表
- 目次
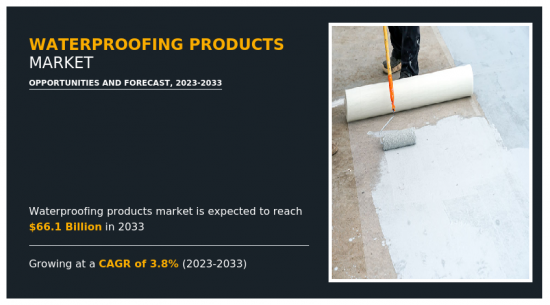
世界の防水製品市場は2019年に425億米ドルと評価され、2023年から2033年にかけてCAGR 3.8%で成長し、2033年には661億米ドルに達すると予測されています。
防水加工とは、対象物や構造物を防水性または耐水性にすることで、特定の条件下で水の影響を比較的受けないようにするか、水の浸入に耐えるようにすることです。これらの製品は、湿気の多い環境や水中の特定の深さで利用することができます。耐水性と防水性は、加圧下での液体の浸入に対する耐性を意味することが多いが、防湿性は湿度や湿気に対する耐性を意味します。物質や構造物を通過する水蒸気の透過率は、水蒸気透過率(MVTR)と呼ばれます。
世界には、補修が必要な橋が数多くあります。n Infrastructure Report Card 2021によると、米国には614,387の橋があり、そのうち約40%は50年以上経過し、耐用年数を迎えようとしています。積雪地域では、危険な状況を改善するために解氷塩が広く使用されています。解氷塩に含まれる塩化物イオンは、透水性のコンクリート構造物を水とともに通過し、その下の鋼鉄を傷つけ始める。この腐食は鋼材を弱体化させるだけでなく、周囲のコンクリートを剥落させる原因にもなります。その結果、橋の耐荷力と乗り心地を悪化させる。
橋梁では、防水膜が構造部材への水の浸入を防いでいます。防水膜は薄い不透水層で、アスファルト・オーバーレイ(路面)と併用され、橋の基礎構造を保護します。エラストマー防水膜は、下層の膜システムが保護されている限り、アスファルト・オーバーレイが数回取り外して取り替えることができる犠牲面として機能し、より長い保護を提供するように設計されています。したがって、防水膜は橋の完全性の維持に貢献します。
トンネルやその他の埋設地下構造物は、その上部の土壌からの浸透水の影響を受けやすいです。世界のインフラと輸送需要の増加により、埋立地とトンネルライナー産業は予測期間中安定した速度で発展すると予想されます。LDPEとHDPEは、最も普及しているトンネルライニング防水膜です。トンネルの寿命を延ばし、継続的で安全な使用を保証するために、トンネルに防水膜を設置することが求められています。
防水膜や化学薬品などの防水製品の使用は、環境や健康問題を引き起こします。防水膜をスプレーの形で使用する場合、使用者や周辺の作業員に危険な影響を及ぼす可能性があります。これらの化学薬品にはフッ素化合物が含まれていることがあり、これを吸い込むと化学肺炎や肺障害などの呼吸器系疾患を引き起こす可能性があります。同様に、ビチューメンベースのメンブレンの塗布は、従業員を危険なヒュームにさらす可能性があります。これらのヒュームに長期間さらされると、気管支炎や鼻の不快感などの健康問題を引き起こす可能性があります。さらに、勤続年数の長い従業員ほど、鼻や咽頭の不定愁訴が増加しています。溶剤、希釈剤、その他の防水膜は、有害なガスや揮発性有機化合物を放出して環境に害を与える可能性があります。しかし、人工呼吸器や保護具、環境に優しい溶液を使用することで、これらの問題を回避することができます。このように、防水製品に関連する環境・健康リスクは、予測期間中、防水製品の需要を妨げると予想されます。
持続可能な都市開拓が重視されるようになったことで、屋上緑化への関心が高まり、防水製品市場に大きな機会をもたらしています。植生に覆われた屋上は、エネルギー効率の改善、都市のヒートアイランド現象の緩和、雨水管理の強化など、数多くの環境上のメリットをもたらします。屋上緑化の導入が勢いを増すにつれ、水の浸入や構造物の損傷を防ぐための効果的な防水ソリューションの需要が重要になります。
屋上緑化には耐久性と雨漏り防止に特化した材料が必要であるため、防水製品市場はこの動向から恩恵を受けることになります。屋上緑化には、浸水から建物を守り、風雨から建物を保護する防水膜、コーティング剤、シーリング剤が必要です。屋上緑化の生態学的利点に対する認識が高まるにつれ、建築家、建設業者、都市計画担当者は、プロジェクトにおいて防水ソリューションを優先するようになり、高品質の防水製品に対する需要が高まっています。この動向は、環境問題に対処するだけでなく、防水業界にとって有利な道であり、技術革新を促進し、建設慣行における持続可能性を促進します。
世界の防水製品市場は、製品タイプ、用途、地域に区分されます。製品タイプ別では、防水塗料、ポリマー防水シート、硬質防水材、アスファルト防水ロール、ビルディングシール防水材、その他に分類されます。用途別では、屋根・壁、床・地下室、水・廃棄物管理、トンネルライナー、橋梁・高速道路、その他に分類されます。地域別では、北米、欧州、アジア太平洋、南米、中東・アフリカで調査されます。
利害関係者にとっての主なメリット
- 当レポートは、2019年から2033年までの防水製品市場分析の市場セグメント、現在の動向、推定・動向分析、力学の定量的分析を提供し、一般的な防水製品市場機会を特定します。
- 市場促進要因、市場抑制要因、市場機会に関連する情報とともに市場調査を提供します。
- ポーターのファイブフォース分析では、利害関係者が利益重視のビジネス決定を下し、サプライヤーとバイヤーのネットワークを強化できるように、バイヤーとサプライヤーの潜在力を強調します。
- 防水製品市場のセグメンテーションを詳細に分析することで、一般的な市場機会を決定するのに役立ちます。
- 各地域の主要国は、世界市場への収益貢献度に応じてマッピングされています。
- 市場プレイヤーのポジショニングはベンチマーキングを容易にし、市場プレイヤーの現在のポジションを明確に理解することができます。
- 本レポートには、地域および世界の防水製品市場動向、主要企業、市場セグメント、応用分野、市場成長戦略の分析が含まれています。
本レポートで可能なカスタマイズ(追加費用とスケジュールがあります。)
- 製造能力
- 設備投資の内訳
- 製品ベンチマーク/製品仕様と用途
- 製品ライフサイクル
- サプライチェーン分析とベンダーマージン
- 地域別新規参入企業
- 技術動向分析
- 製品/セグメント別の市場セグメンテーション
- 主要企業の新製品開発/製品マトリックス
- 国、地域、世界レベルでの患者/疫学データ
- 規制ガイドライン
- 顧客の関心に応じた追加の企業プロファイル
- 国別または地域別追加分析-市場規模および予測
- 平均販売価格分析/プライスポイント分析
- 企業プロファイルの拡張リスト
- 過去の市場データ
- 輸出入分析/データ
- 主要企業の詳細(所在地、連絡先、サプライヤー/ベンダーネットワークなどを含む、エクセル形式)
- 顧客/消費者/原料サプライヤーのリスト-バリューチェーン分析
- 世界/地域/国別レベルでの企業の市場シェア分析
- 製品消費分析
- 数量市場規模と予測
目次
第1章 イントロダクション
第2章 エグゼクティブサマリー
第3章 市場概要
- 市場の定義と範囲
- 主な調査結果
- 影響要因
- 主な投資機会
- ポーターのファイブフォース分析
- 市場力学
- 促進要因
- インフラ用途での防水膜使用の増加
- 住宅建設の急増
- 抑制要因
- 防水製品に関連する環境・健康リスク
- 機会
- 屋上緑化に対する意識の高まり
- 促進要因
- バリューチェーン分析
- 主要規制分析
- 特許情勢
- 規制ガイドライン
第4章 防水製品市場:製品タイプ別
- 概要
- 防水塗料
- ポリマー防水シート
- 硬質防水材
- アスファルト防水ロール
- 建築用シール防水材
- その他
第5章 防水製品市場:用途別
- 概要
- 屋根と壁
- 床と地下室
- 橋梁と高速道路
- 水と廃棄物管理
- トンネル・ライナー
- その他
第6章 防水製品市場:地域別
- 概要
- 北米
- 米国
- メキシコ
- カナダ
- 欧州
- ドイツ
- フランス
- 英国
- その他
- アジア太平洋
- 中国
- 日本
- インド
- インドネシア
- ベトナム
- その他
- 南米
- ブラジル
- アルゼンチン
- チリ
- その他の南米
- 中東・アフリカ
- 南アフリカ
- サウジアラビア
- アラブ首長国連邦
- その他の中東・アフリカ
第7章 競合情勢
- イントロダクション
- 主要成功戦略
- 主要10社の製品マッピング
- 競合ダッシュボード
- 競合ヒートマップ
- 主要企業のポジショニング、2019年
第8章 企業プロファイル
- Henry Company
- GAF.
- Soprema
- Sika AG
- Carlisle Companies Inc.
- GCP Applied Technologies Inc.
- RPM International Inc.
- HOLCIM
- BASF SE
- Dow
LIST OF TABLES
- TABLE 01. GLOBAL WATERPROOFING PRODUCTS MARKET, BY PRODUCT TYPE, 2019-2033 ($MILLION)
- TABLE 02. WATERPROOFING PRODUCTS MARKET FOR WATERPROOF PAINTS, BY REGION, 2019-2033 ($MILLION)
- TABLE 03. WATERPROOFING PRODUCTS MARKET FOR POLYMER WATERPROOF SHEETS, BY REGION, 2019-2033 ($MILLION)
- TABLE 04. WATERPROOFING PRODUCTS MARKET FOR RIGID WATERPROOF MATERIALS, BY REGION, 2019-2033 ($MILLION)
- TABLE 05. WATERPROOFING PRODUCTS MARKET FOR ASPHALT WATERPROOF ROLLS, BY REGION, 2019-2033 ($MILLION)
- TABLE 06. WATERPROOFING PRODUCTS MARKET FOR BUILDING SEAL WATERPROOF MATERIALS, BY REGION, 2019-2033 ($MILLION)
- TABLE 07. WATERPROOFING PRODUCTS MARKET FOR OTHERS, BY REGION, 2019-2033 ($MILLION)
- TABLE 08. GLOBAL WATERPROOFING PRODUCTS MARKET, BY APPLICATION, 2019-2033 ($MILLION)
- TABLE 09. WATERPROOFING PRODUCTS MARKET FOR ROOFING AND WALLS, BY REGION, 2019-2033 ($MILLION)
- TABLE 10. WATERPROOFING PRODUCTS MARKET FOR FLOORS AND BASEMENTS, BY REGION, 2019-2033 ($MILLION)
- TABLE 11. WATERPROOFING PRODUCTS MARKET FOR BRIDGES AND HIGHWAYS, BY REGION, 2019-2033 ($MILLION)
- TABLE 12. WATERPROOFING PRODUCTS MARKET FOR WATER AND WASTE MANAGEMENT, BY REGION, 2019-2033 ($MILLION)
- TABLE 13. WATERPROOFING PRODUCTS MARKET FOR TUNNEL LINERS, BY REGION, 2019-2033 ($MILLION)
- TABLE 14. WATERPROOFING PRODUCTS MARKET FOR OTHERS, BY REGION, 2019-2033 ($MILLION)
- TABLE 15. WATERPROOFING PRODUCTS MARKET, BY REGION, 2019-2033 ($MILLION)
- TABLE 16. NORTH AMERICA WATERPROOFING PRODUCTS MARKET, BY PRODUCT TYPE, 2019-2033 ($MILLION)
- TABLE 17. NORTH AMERICA WATERPROOFING PRODUCTS MARKET, BY APPLICATION, 2019-2033 ($MILLION)
- TABLE 18. NORTH AMERICA WATERPROOFING PRODUCTS MARKET, BY COUNTRY, 2019-2033 ($MILLION)
- TABLE 19. U.S. WATERPROOFING PRODUCTS MARKET, BY PRODUCT TYPE, 2019-2033 ($MILLION)
- TABLE 20. U.S. WATERPROOFING PRODUCTS MARKET, BY APPLICATION, 2019-2033 ($MILLION)
- TABLE 21. MEXICO WATERPROOFING PRODUCTS MARKET, BY PRODUCT TYPE, 2019-2033 ($MILLION)
- TABLE 22. MEXICO WATERPROOFING PRODUCTS MARKET, BY APPLICATION, 2019-2033 ($MILLION)
- TABLE 23. CANADA WATERPROOFING PRODUCTS MARKET, BY PRODUCT TYPE, 2019-2033 ($MILLION)
- TABLE 24. CANADA WATERPROOFING PRODUCTS MARKET, BY APPLICATION, 2019-2033 ($MILLION)
- TABLE 25. EUROPE WATERPROOFING PRODUCTS MARKET, BY PRODUCT TYPE, 2019-2033 ($MILLION)
- TABLE 26. EUROPE WATERPROOFING PRODUCTS MARKET, BY APPLICATION, 2019-2033 ($MILLION)
- TABLE 27. EUROPE WATERPROOFING PRODUCTS MARKET, BY COUNTRY, 2019-2033 ($MILLION)
- TABLE 28. GERMANY WATERPROOFING PRODUCTS MARKET, BY PRODUCT TYPE, 2019-2033 ($MILLION)
- TABLE 29. GERMANY WATERPROOFING PRODUCTS MARKET, BY APPLICATION, 2019-2033 ($MILLION)
- TABLE 30. FRANCE WATERPROOFING PRODUCTS MARKET, BY PRODUCT TYPE, 2019-2033 ($MILLION)
- TABLE 31. FRANCE WATERPROOFING PRODUCTS MARKET, BY APPLICATION, 2019-2033 ($MILLION)
- TABLE 32. UK WATERPROOFING PRODUCTS MARKET, BY PRODUCT TYPE, 2019-2033 ($MILLION)
- TABLE 33. UK WATERPROOFING PRODUCTS MARKET, BY APPLICATION, 2019-2033 ($MILLION)
- TABLE 34. REST OF EUROPE WATERPROOFING PRODUCTS MARKET, BY PRODUCT TYPE, 2019-2033 ($MILLION)
- TABLE 35. REST OF EUROPE WATERPROOFING PRODUCTS MARKET, BY APPLICATION, 2019-2033 ($MILLION)
- TABLE 36. ASIA-PACIFIC WATERPROOFING PRODUCTS MARKET, BY PRODUCT TYPE, 2019-2033 ($MILLION)
- TABLE 37. ASIA-PACIFIC WATERPROOFING PRODUCTS MARKET, BY APPLICATION, 2019-2033 ($MILLION)
- TABLE 38. ASIA-PACIFIC WATERPROOFING PRODUCTS MARKET, BY COUNTRY, 2019-2033 ($MILLION)
- TABLE 39. CHINA WATERPROOFING PRODUCTS MARKET, BY PRODUCT TYPE, 2019-2033 ($MILLION)
- TABLE 40. CHINA WATERPROOFING PRODUCTS MARKET, BY APPLICATION, 2019-2033 ($MILLION)
- TABLE 41. JAPAN WATERPROOFING PRODUCTS MARKET, BY PRODUCT TYPE, 2019-2033 ($MILLION)
- TABLE 42. JAPAN WATERPROOFING PRODUCTS MARKET, BY APPLICATION, 2019-2033 ($MILLION)
- TABLE 43. INDIA WATERPROOFING PRODUCTS MARKET, BY PRODUCT TYPE, 2019-2033 ($MILLION)
- TABLE 44. INDIA WATERPROOFING PRODUCTS MARKET, BY APPLICATION, 2019-2033 ($MILLION)
- TABLE 45. INDONESIA WATERPROOFING PRODUCTS MARKET, BY PRODUCT TYPE, 2019-2033 ($MILLION)
- TABLE 46. INDONESIA WATERPROOFING PRODUCTS MARKET, BY APPLICATION, 2019-2033 ($MILLION)
- TABLE 47. VIETNAM WATERPROOFING PRODUCTS MARKET, BY PRODUCT TYPE, 2019-2033 ($MILLION)
- TABLE 48. VIETNAM WATERPROOFING PRODUCTS MARKET, BY APPLICATION, 2019-2033 ($MILLION)
- TABLE 49. REST OF ASIA-PACIFIC WATERPROOFING PRODUCTS MARKET, BY PRODUCT TYPE, 2019-2033 ($MILLION)
- TABLE 50. REST OF ASIA-PACIFIC WATERPROOFING PRODUCTS MARKET, BY APPLICATION, 2019-2033 ($MILLION)
- TABLE 51. SOUTH AMERICA WATERPROOFING PRODUCTS MARKET, BY PRODUCT TYPE, 2019-2033 ($MILLION)
- TABLE 52. SOUTH AMERICA WATERPROOFING PRODUCTS MARKET, BY APPLICATION, 2019-2033 ($MILLION)
- TABLE 53. SOUTH AMERICA WATERPROOFING PRODUCTS MARKET, BY COUNTRY, 2019-2033 ($MILLION)
- TABLE 54. BRAZIL WATERPROOFING PRODUCTS MARKET, BY PRODUCT TYPE, 2019-2033 ($MILLION)
- TABLE 55. BRAZIL WATERPROOFING PRODUCTS MARKET, BY APPLICATION, 2019-2033 ($MILLION)
- TABLE 56. ARGENTINA WATERPROOFING PRODUCTS MARKET, BY PRODUCT TYPE, 2019-2033 ($MILLION)
- TABLE 57. ARGENTINA WATERPROOFING PRODUCTS MARKET, BY APPLICATION, 2019-2033 ($MILLION)
- TABLE 58. CHILE WATERPROOFING PRODUCTS MARKET, BY PRODUCT TYPE, 2019-2033 ($MILLION)
- TABLE 59. CHILE WATERPROOFING PRODUCTS MARKET, BY APPLICATION, 2019-2033 ($MILLION)
- TABLE 60. REST OF SOUTH AMERICA WATERPROOFING PRODUCTS MARKET, BY PRODUCT TYPE, 2019-2033 ($MILLION)
- TABLE 61. REST OF SOUTH AMERICA WATERPROOFING PRODUCTS MARKET, BY APPLICATION, 2019-2033 ($MILLION)
- TABLE 62. MIDDLE EAST AND AFRICA WATERPROOFING PRODUCTS MARKET, BY PRODUCT TYPE, 2019-2033 ($MILLION)
- TABLE 63. MIDDLE EAST AND AFRICA WATERPROOFING PRODUCTS MARKET, BY APPLICATION, 2019-2033 ($MILLION)
- TABLE 64. MIDDLE EAST AND AFRICA WATERPROOFING PRODUCTS MARKET, BY COUNTRY, 2019-2033 ($MILLION)
- TABLE 65. SOUTH AFRICA WATERPROOFING PRODUCTS MARKET, BY PRODUCT TYPE, 2019-2033 ($MILLION)
- TABLE 66. SOUTH AFRICA WATERPROOFING PRODUCTS MARKET, BY APPLICATION, 2019-2033 ($MILLION)
- TABLE 67. SAUDI ARABIA WATERPROOFING PRODUCTS MARKET, BY PRODUCT TYPE, 2019-2033 ($MILLION)
- TABLE 68. SAUDI ARABIA WATERPROOFING PRODUCTS MARKET, BY APPLICATION, 2019-2033 ($MILLION)
- TABLE 69. UAE WATERPROOFING PRODUCTS MARKET, BY PRODUCT TYPE, 2019-2033 ($MILLION)
- TABLE 70. UAE WATERPROOFING PRODUCTS MARKET, BY APPLICATION, 2019-2033 ($MILLION)
- TABLE 71. REST OF MIDDLE EAST AND AFRICA WATERPROOFING PRODUCTS MARKET, BY PRODUCT TYPE, 2019-2033 ($MILLION)
- TABLE 72. REST OF MIDDLE EAST AND AFRICA WATERPROOFING PRODUCTS MARKET, BY APPLICATION, 2019-2033 ($MILLION)
- TABLE 73. HENRY COMPANY: KEY EXECUTIVES
- TABLE 74. HENRY COMPANY: COMPANY SNAPSHOT
- TABLE 75. HENRY COMPANY: PRODUCT SEGMENTS
- TABLE 76. HENRY COMPANY: PRODUCT PORTFOLIO
- TABLE 77. HENRY COMPANY: KEY STRATERGIES
- TABLE 78. GAF.: KEY EXECUTIVES
- TABLE 79. GAF.: COMPANY SNAPSHOT
- TABLE 80. GAF.: PRODUCT SEGMENTS
- TABLE 81. GAF.: PRODUCT PORTFOLIO
- TABLE 82. SOPREMA: KEY EXECUTIVES
- TABLE 83. SOPREMA: COMPANY SNAPSHOT
- TABLE 84. SOPREMA: PRODUCT SEGMENTS
- TABLE 85. SOPREMA: PRODUCT PORTFOLIO
- TABLE 86. SIKA AG: KEY EXECUTIVES
- TABLE 87. SIKA AG: COMPANY SNAPSHOT
- TABLE 88. SIKA AG: PRODUCT SEGMENTS
- TABLE 89. SIKA AG: PRODUCT PORTFOLIO
- TABLE 90. SIKA AG: KEY STRATERGIES
- TABLE 91. CARLISLE COMPANIES INC.: KEY EXECUTIVES
- TABLE 92. CARLISLE COMPANIES INC.: COMPANY SNAPSHOT
- TABLE 93. CARLISLE COMPANIES INC.: PRODUCT SEGMENTS
- TABLE 94. CARLISLE COMPANIES INC.: PRODUCT PORTFOLIO
- TABLE 95. GCP APPLIED TECHNOLOGIES INC.: KEY EXECUTIVES
- TABLE 96. GCP APPLIED TECHNOLOGIES INC.: COMPANY SNAPSHOT
- TABLE 97. GCP APPLIED TECHNOLOGIES INC.: PRODUCT SEGMENTS
- TABLE 98. GCP APPLIED TECHNOLOGIES INC.: PRODUCT PORTFOLIO
- TABLE 99. RPM INTERNATIONAL INC.: KEY EXECUTIVES
- TABLE 100. RPM INTERNATIONAL INC.: COMPANY SNAPSHOT
- TABLE 101. RPM INTERNATIONAL INC.: PRODUCT SEGMENTS
- TABLE 102. RPM INTERNATIONAL INC.: PRODUCT PORTFOLIO
- TABLE 103. HOLCIM: KEY EXECUTIVES
- TABLE 104. HOLCIM: COMPANY SNAPSHOT
- TABLE 105. HOLCIM: PRODUCT SEGMENTS
- TABLE 106. HOLCIM: PRODUCT PORTFOLIO
- TABLE 107. HOLCIM: KEY STRATERGIES
- TABLE 108. BASF SE: KEY EXECUTIVES
- TABLE 109. BASF SE: COMPANY SNAPSHOT
- TABLE 110. BASF SE: PRODUCT SEGMENTS
- TABLE 111. BASF SE: PRODUCT PORTFOLIO
- TABLE 112. BASF SE: KEY STRATERGIES
- TABLE 113. DOW: KEY EXECUTIVES
- TABLE 114. DOW: COMPANY SNAPSHOT
- TABLE 115. DOW: PRODUCT SEGMENTS
- TABLE 116. DOW: PRODUCT PORTFOLIO
LIST OF FIGURES
- FIGURE 01. WATERPROOFING PRODUCTS MARKET, 2019-2033
- FIGURE 02. SEGMENTATION OF WATERPROOFING PRODUCTS MARKET,2019-2033
- FIGURE 03. TOP IMPACTING FACTORS IN WATERPROOFING PRODUCTS MARKET (2019 TO 2033)
- FIGURE 04. TOP INVESTMENT POCKETS IN WATERPROOFING PRODUCTS MARKET (2023-2033)
- FIGURE 05. MODERATE BARGAINING POWER OF SUPPLIERS
- FIGURE 06. MODERATE THREAT OF NEW ENTRANTS
- FIGURE 07. LOW THREAT OF SUBSTITUTES
- FIGURE 08. HIGH INTENSITY OF RIVALRY
- FIGURE 09. MODERATE BARGAINING POWER OF BUYERS
- FIGURE 10. GLOBAL WATERPROOFING PRODUCTS MARKET:DRIVERS, RESTRAINTS AND OPPORTUNITIES
- FIGURE 11. IMPACT OF KEY REGULATION: WATERPROOFING PRODUCTS MARKET
- FIGURE 12. PATENT ANALYSIS BY COMPANY
- FIGURE 13. PATENT ANALYSIS BY COUNTRY
- FIGURE 14. REGULATORY GUIDELINES: WATERPROOFING PRODUCTS MARKET
- FIGURE 15. WATERPROOFING PRODUCTS MARKET, BY PRODUCT TYPE, 2019 AND 2033(%)
- FIGURE 16. COMPARATIVE SHARE ANALYSIS OF WATERPROOFING PRODUCTS MARKET FOR WATERPROOF PAINTS, BY COUNTRY 2019 AND 2033(%)
- FIGURE 17. COMPARATIVE SHARE ANALYSIS OF WATERPROOFING PRODUCTS MARKET FOR POLYMER WATERPROOF SHEETS, BY COUNTRY 2019 AND 2033(%)
- FIGURE 18. COMPARATIVE SHARE ANALYSIS OF WATERPROOFING PRODUCTS MARKET FOR RIGID WATERPROOF MATERIALS, BY COUNTRY 2019 AND 2033(%)
- FIGURE 19. COMPARATIVE SHARE ANALYSIS OF WATERPROOFING PRODUCTS MARKET FOR ASPHALT WATERPROOF ROLLS, BY COUNTRY 2019 AND 2033(%)
- FIGURE 20. COMPARATIVE SHARE ANALYSIS OF WATERPROOFING PRODUCTS MARKET FOR BUILDING SEAL WATERPROOF MATERIALS, BY COUNTRY 2019 AND 2033(%)
- FIGURE 21. COMPARATIVE SHARE ANALYSIS OF WATERPROOFING PRODUCTS MARKET FOR OTHERS, BY COUNTRY 2019 AND 2033(%)
- FIGURE 22. WATERPROOFING PRODUCTS MARKET, BY APPLICATION, 2019 AND 2033(%)
- FIGURE 23. COMPARATIVE SHARE ANALYSIS OF WATERPROOFING PRODUCTS MARKET FOR ROOFING AND WALLS, BY COUNTRY 2019 AND 2033(%)
- FIGURE 24. COMPARATIVE SHARE ANALYSIS OF WATERPROOFING PRODUCTS MARKET FOR FLOORS AND BASEMENTS, BY COUNTRY 2019 AND 2033(%)
- FIGURE 25. COMPARATIVE SHARE ANALYSIS OF WATERPROOFING PRODUCTS MARKET FOR BRIDGES AND HIGHWAYS, BY COUNTRY 2019 AND 2033(%)
- FIGURE 26. COMPARATIVE SHARE ANALYSIS OF WATERPROOFING PRODUCTS MARKET FOR WATER AND WASTE MANAGEMENT, BY COUNTRY 2019 AND 2033(%)
- FIGURE 27. COMPARATIVE SHARE ANALYSIS OF WATERPROOFING PRODUCTS MARKET FOR TUNNEL LINERS, BY COUNTRY 2019 AND 2033(%)
- FIGURE 28. COMPARATIVE SHARE ANALYSIS OF WATERPROOFING PRODUCTS MARKET FOR OTHERS, BY COUNTRY 2019 AND 2033(%)
- FIGURE 29. WATERPROOFING PRODUCTS MARKET BY REGION, 2019 AND 2033(%)
- FIGURE 30. U.S. WATERPROOFING PRODUCTS MARKET, 2019-2033 ($MILLION)
- FIGURE 31. MEXICO WATERPROOFING PRODUCTS MARKET, 2019-2033 ($MILLION)
- FIGURE 32. CANADA WATERPROOFING PRODUCTS MARKET, 2019-2033 ($MILLION)
- FIGURE 33. GERMANY WATERPROOFING PRODUCTS MARKET, 2019-2033 ($MILLION)
- FIGURE 34. FRANCE WATERPROOFING PRODUCTS MARKET, 2019-2033 ($MILLION)
- FIGURE 35. UK WATERPROOFING PRODUCTS MARKET, 2019-2033 ($MILLION)
- FIGURE 36. REST OF EUROPE WATERPROOFING PRODUCTS MARKET, 2019-2033 ($MILLION)
- FIGURE 37. CHINA WATERPROOFING PRODUCTS MARKET, 2019-2033 ($MILLION)
- FIGURE 38. JAPAN WATERPROOFING PRODUCTS MARKET, 2019-2033 ($MILLION)
- FIGURE 39. INDIA WATERPROOFING PRODUCTS MARKET, 2019-2033 ($MILLION)
- FIGURE 40. INDONESIA WATERPROOFING PRODUCTS MARKET, 2019-2033 ($MILLION)
- FIGURE 41. VIETNAM WATERPROOFING PRODUCTS MARKET, 2019-2033 ($MILLION)
- FIGURE 42. REST OF ASIA-PACIFIC WATERPROOFING PRODUCTS MARKET, 2019-2033 ($MILLION)
- FIGURE 43. BRAZIL WATERPROOFING PRODUCTS MARKET, 2019-2033 ($MILLION)
- FIGURE 44. ARGENTINA WATERPROOFING PRODUCTS MARKET, 2019-2033 ($MILLION)
- FIGURE 45. CHILE WATERPROOFING PRODUCTS MARKET, 2019-2033 ($MILLION)
- FIGURE 46. REST OF SOUTH AMERICA WATERPROOFING PRODUCTS MARKET, 2019-2033 ($MILLION)
- FIGURE 47. SOUTH AFRICA WATERPROOFING PRODUCTS MARKET, 2019-2033 ($MILLION)
- FIGURE 48. SAUDI ARABIA WATERPROOFING PRODUCTS MARKET, 2019-2033 ($MILLION)
- FIGURE 49. UAE WATERPROOFING PRODUCTS MARKET, 2019-2033 ($MILLION)
- FIGURE 50. REST OF MIDDLE EAST AND AFRICA WATERPROOFING PRODUCTS MARKET, 2019-2033 ($MILLION)
- FIGURE 51. TOP WINNING STRATEGIES, BY YEAR (2020-2023)
- FIGURE 52. TOP WINNING STRATEGIES, BY DEVELOPMENT (2020-2023)
- FIGURE 53. TOP WINNING STRATEGIES, BY COMPANY (2020-2023)
- FIGURE 54. PRODUCT MAPPING OF TOP 10 PLAYERS
- FIGURE 55. COMPETITIVE DASHBOARD
- FIGURE 56. COMPETITIVE HEATMAP: WATERPROOFING PRODUCTS MARKET
- FIGURE 57. TOP PLAYER POSITIONING, 2019
- FIGURE 58. SIKA AG: NET SALES, 2020-2022 ($MILLION)
- FIGURE 59. SIKA AG: REVENUE SHARE BY SEGMENT, 2022 (%)
- FIGURE 60. SIKA AG: REVENUE SHARE BY REGION, 2022 (%)
- FIGURE 61. CARLISLE COMPANIES INC.: NET REVENUE, 2020-2022 ($MILLION)
- FIGURE 62. CARLISLE COMPANIES INC.: REVENUE SHARE BY REGION, 2022 (%)
- FIGURE 63. GCP APPLIED TECHNOLOGIES INC.: NET REVENUE, 2019-2021 ($MILLION)
- FIGURE 64. GCP APPLIED TECHNOLOGIES INC.: REVENUE SHARE BY SEGMENT, 2021 (%)
- FIGURE 65. GCP APPLIED TECHNOLOGIES INC.: REVENUE SHARE BY REGION, 2021 (%)
- FIGURE 66. RPM INTERNATIONAL INC.: NET REVENUE, 2020-2022 ($MILLION)
- FIGURE 67. RPM INTERNATIONAL INC.: REVENUE SHARE BY SEGMENT, 2022 (%)
- FIGURE 68. RPM INTERNATIONAL INC.: REVENUE SHARE BY REGION, 2022 (%)
- FIGURE 69. HOLCIM: NET SALES, 2020-2022 ($MILLION)
- FIGURE 70. HOLCIM: RESEARCH & DEVELOPMENT EXPENDITURE, 2020-2022 ($MILLION)
- FIGURE 71. HOLCIM: REVENUE SHARE BY SEGMENT, 2022 (%)
- FIGURE 72. HOLCIM: REVENUE SHARE BY REGION, 2022 (%)
- FIGURE 73. BASF SE: NET SALES, 2020-2022 ($MILLION)
- FIGURE 74. BASF SE: RESEARCH & DEVELOPMENT EXPENDITURE, 2020-2022 ($MILLION)
- FIGURE 75. BASF SE: REVENUE SHARE BY SEGMENT, 2022 (%)
- FIGURE 76. BASF SE: REVENUE SHARE BY REGION, 2022 (%)
- FIGURE 77. DOW: NET SALES, 2020-2022 ($MILLION)
- FIGURE 78. DOW: REVENUE SHARE BY SEGMENT, 2022 (%)
- FIGURE 79. DOW: REVENUE SHARE BY REGION, 2022 (%)
The global waterproofing products market was valued at $42.5 billion in 2019 and is projected to reach $66.1 billion by 2033, growing at a CAGR of 3.8% from 2023 to 2033.
Waterproofing is the process of making an object or structure watertight or water-resistant so that it is relatively unaffected by water or resists the infiltration of water under specific conditions. These products can be utilized in damp settings or at specific depths underwater. Water-resistant and waterproof often refer to resistance to liquid water penetration, potentially under pressure, whereas dampproof refers to resistance to humidity or dampness. The rate of water vapor transmission through a substance or structure is referred to as the moisture vapor transmission rate (MVTR).
Numerous bridges globally are in dire need of repair. According to the n Infrastructure Report Card 2021, the U.S. has 614,387 bridges, of which about 40% are 50 years or older and approaching the end of their authorized service life. In snowy climates, deicing salts are widely used to remedy hazardous circumstances. Chloride ions from deicing salts can pass through permeable concrete structures with water and begin to damage the steel beneath. This attack's corrosion not only weakens the steel but can also contribute to the spalling of the surrounding concrete. This causes the bridge's load-bearing capability and riding surface quality to deteriorate.
On the bridge, waterproofing membranes prevent water from penetrating the structure's components. The waterproofing membrane is a thin, impermeable layer used in conjunction with an asphalt overlay (as the riding surface) to protect the bridge's underlying structure. Elastomeric waterproofing membranes are designed to provide longer protection, with the asphalt overlay serving as a sacrificial surface that may be removed and replaced several times so long as the underlying membrane system is protected. Therefore, waterproof membranes contribute to the preservation of the bridge's integrity.
Tunnels and other buried underground structures are susceptible to seepage water through the soil above them. Due to the increase in demand for infrastructure and transportation globally, the landfills & tunnel liners industry is anticipated develop at a stable rate during the forecast period. LDPE and HDPE are the most prevalent tunnel-lining waterproofing membranes. It is required to put waterproof membranes in tunnels to extend their lifespan and ensure their ongoing, secure use.
Usage of waterproofing products, such as membranes and chemicals, causes environmental and health problems. When employed in spray form, waterproofing membranes can be hazardous to the user and workers in the vicinity. These chemicals may contain fluorinated compounds, which, when inhaled, can lead to chemical pneumonitis, lung damage, and other respiratory issues. Similarly, the application of bitumen-based membranes might expose employees to hazardous fumes. Long-term exposure to these fumes may cause health problems such as bronchitis and nasal discomfort. In addition, personnel with longer tenures have demonstrated increase in nasal and pharyngeal complaints. Solvents, diluents, and other waterproofing membranes can harm the environment by emitting harmful gases and volatile organic compounds. However, these issues can be avoided using respirators, protective equipment, and eco-friendly solutions. Thus, the environmental and health risks associated with waterproofing products is expected to hamper the demand for waterproofing products during the forecast period.
The growing emphasis on sustainable urban development has sparked increased interest in green roofs, presenting a significant opportunity for the waterproofing products market. Green roofs, characterized by vegetation cover, offer numerous environmental benefits, such as improved energy efficiency, reduced urban heat island effect, and enhanced stormwater management. As the adoption of green roofs gains momentum, the demand for effective waterproofing solutions becomes important to prevent water infiltration and structural damage.
The waterproofing products market stands to benefit from this trend, as these roofs necessitate specialized materials to ensure durability and leak prevention. Green roof installations require waterproof membranes, coatings, and sealants to protect buildings from water ingress and provide a reliable barrier against the elements. As awareness of the ecological advantages of green roofs continues to rise, architects, builders, and urban planners are likely to prioritize waterproofing solutions in their projects, thereby fueling the demand for quality waterproofing products. This trend not only addresses environmental concerns but also represents a lucrative avenue for the waterproofing industry, driving innovation and promoting sustainability in construction practices.
The global waterproofing products market is segmented into product type, application, and region. By product type, the market is divided into waterproof paints, polymer waterproof sheets, rigid waterproof materials, asphalt waterproof rolls, building seal waterproof materials and others. By application, it is categorized into roofing and walls, floors and basements, water and waste management, tunnel liners, bridges and highways, and others. region-wise, the market is studied across North America, Europe, Asia-Pacific, South America, and Middle East and Africa.
The major players operating in the global waterproofing products market are BASF SE, Sika AG, Carlisle Companies Inc., RPM International Inc., GCP Applied Technologies Inc., HOLCIM, Soprema Group, GAF, Henry Company, and The Dow Chemical Company. Other players operating in the market are Saint-Gobain Weber GmbH, Fosroc Ltd., Maris Polymers, Pidilite Industries Ltd., and Bayer Material Science AG.
Key Benefits For Stakeholders
- This report provides a quantitative analysis of the market segments, current trends, estimations, and dynamics of the waterproofing products market analysis from 2019 to 2033 to identify the prevailing waterproofing products market opportunities.
- The market research is offered along with information related to key drivers, restraints, and opportunities.
- Porter's five forces analysis highlights the potency of buyers and suppliers to enable stakeholders make profit-oriented business decisions and strengthen their supplier-buyer network.
- In-depth analysis of the waterproofing products market segmentation assists to determine the prevailing market opportunities.
- Major countries in each region are mapped according to their revenue contribution to the global market.
- Market player positioning facilitates benchmarking and provides a clear understanding of the present position of the market players.
- The report includes the analysis of the regional as well as global waterproofing products market trends, key players, market segments, application areas, and market growth strategies.
Additional benefits you will get with this purchase are:
- Quarterly Update and* (only available with a corporate license, on listed price)
- 5 additional Company Profile of client Choice pre- or Post-purchase, as a free update.
- Free Upcoming Version on the Purchase of Five and Enterprise User License.
- 16 analyst hours of support* (post-purchase, if you find additional data requirements upon review of the report, you may receive support amounting to 16 analyst hours to solve questions, and post-sale queries)
- 15% Free Customization* (in case the scope or segment of the report does not match your requirements, 15% is equivalent to 3 working days of free work, applicable once)
- Free data Pack on the Five and Enterprise User License. (Excel version of the report)
- Free Updated report if the report is 6-12 months old or older.
- 24-hour priority response*
- Free Industry updates and white papers.
Possible Customization with this report (with additional cost and timeline, please talk to the sales executive to know more)
- Manufacturing Capacity
- Capital Investment breakdown
- Product Benchmarking / Product specification and applications
- Product Life Cycles
- Supply Chain Analysis & Vendor Margins
- Upcoming/New Entrant by Regions
- Technology Trend Analysis
- Market share analysis of players by products/segments
- New Product Development/ Product Matrix of Key Players
- Patient/epidemiology data at country, region, global level
- Regulatory Guidelines
- Additional company profiles with specific to client's interest
- Additional country or region analysis- market size and forecast
- Average Selling Price Analysis / Price Point Analysis
- Expanded list for Company Profiles
- Historic market data
- Import Export Analysis/Data
- Key player details (including location, contact details, supplier/vendor network etc. in excel format)
- List of customers/consumers/raw material suppliers- value chain analysis
- Market share analysis of players at global/region/country level
- Product Consumption Analysis
- Volume Market Size and Forecast
Key Market Segments
By Product Type
- Waterproof Paints
- Polymer Waterproof Sheets
- Rigid Waterproof Materials
- Asphalt Waterproof Rolls
- Building Seal Waterproof Materials
- Others
By Application
- Roofing and Walls
- Floors and Basements
- Bridges and Highways
- Water and Waste Management
- Tunnel Liners
- Others
By Region
- North America
- U.S.
- Mexico
- Canada
- Europe
- Germany
- France
- UK
- Rest of Europe
- Asia-Pacific
- China
- Japan
- India
- Indonesia
- Vietnam
- Rest of Asia-Pacific
- South America
- Brazil
- Argentina
- Chile
- Rest Of South America
- Middle East and Africa
- South Africa
- Saudi Arabia
- UAE
- Rest of Middle East And Africa
Key Market Players:
- Sika AG
- Carlisle Companies Inc.
- GCP Applied Technologies Inc.
- RPM International Inc.
- Henry Company
- GAF.
- Soprema
- HOLCIM
- BASF SE
- Dow
TABLE OF CONTENTS
CHAPTER 1: INTRODUCTION
- 1.1. Report description
- 1.2. Key market segments
- 1.3. Key benefits to the stakeholders
- 1.4. Research methodology
- 1.4.1. Primary research
- 1.4.2. Secondary research
- 1.4.3. Analyst tools and models
CHAPTER 2: EXECUTIVE SUMMARY
- 2.1. CXO Perspective
CHAPTER 3: MARKET OVERVIEW
- 3.1. Market definition and scope
- 3.2. Key findings
- 3.2.1. Top impacting factors
- 3.2.2. Top investment pockets
- 3.3. Porter's five forces analysis
- 3.3.1. Moderate bargaining power of suppliers
- 3.3.2. Moderate threat of new entrants
- 3.3.3. Low threat of substitutes
- 3.3.4. High intensity of rivalry
- 3.3.5. Moderate bargaining power of buyers
- 3.4. Market dynamics
- 3.4.1. Drivers
- 3.4.1.1. Increase in use of waterproofing membranes in infrastructure applications
- 3.4.1.2. Surge in residential construction
- 3.4.2. Restraints
- 3.4.2.1. Environmental and health risks associated with waterproofing products
- 3.4.3. Opportunities
- 3.4.3.1. Increase in awareness of green roofs
- 3.4.1. Drivers
- 3.5. Value Chain Analysis
- 3.6. Key Regulation Analysis
- 3.7. Patent Landscape
- 3.8. Regulatory Guidelines
CHAPTER 4: WATERPROOFING PRODUCTS MARKET, BY PRODUCT TYPE
- 4.1. Overview
- 4.1.1. Market size and forecast
- 4.2. Waterproof Paints
- 4.2.1. Key market trends, growth factors and opportunities
- 4.2.2. Market size and forecast, by region
- 4.2.3. Market share analysis by country
- 4.3. Polymer Waterproof Sheets
- 4.3.1. Key market trends, growth factors and opportunities
- 4.3.2. Market size and forecast, by region
- 4.3.3. Market share analysis by country
- 4.4. Rigid Waterproof Materials
- 4.4.1. Key market trends, growth factors and opportunities
- 4.4.2. Market size and forecast, by region
- 4.4.3. Market share analysis by country
- 4.5. Asphalt Waterproof Rolls
- 4.5.1. Key market trends, growth factors and opportunities
- 4.5.2. Market size and forecast, by region
- 4.5.3. Market share analysis by country
- 4.6. Building Seal Waterproof Materials
- 4.6.1. Key market trends, growth factors and opportunities
- 4.6.2. Market size and forecast, by region
- 4.6.3. Market share analysis by country
- 4.7. Others
- 4.7.1. Key market trends, growth factors and opportunities
- 4.7.2. Market size and forecast, by region
- 4.7.3. Market share analysis by country
CHAPTER 5: WATERPROOFING PRODUCTS MARKET, BY APPLICATION
- 5.1. Overview
- 5.1.1. Market size and forecast
- 5.2. Roofing and Walls
- 5.2.1. Key market trends, growth factors and opportunities
- 5.2.2. Market size and forecast, by region
- 5.2.3. Market share analysis by country
- 5.3. Floors and Basements
- 5.3.1. Key market trends, growth factors and opportunities
- 5.3.2. Market size and forecast, by region
- 5.3.3. Market share analysis by country
- 5.4. Bridges and Highways
- 5.4.1. Key market trends, growth factors and opportunities
- 5.4.2. Market size and forecast, by region
- 5.4.3. Market share analysis by country
- 5.5. Water and Waste Management
- 5.5.1. Key market trends, growth factors and opportunities
- 5.5.2. Market size and forecast, by region
- 5.5.3. Market share analysis by country
- 5.6. Tunnel Liners
- 5.6.1. Key market trends, growth factors and opportunities
- 5.6.2. Market size and forecast, by region
- 5.6.3. Market share analysis by country
- 5.7. Others
- 5.7.1. Key market trends, growth factors and opportunities
- 5.7.2. Market size and forecast, by region
- 5.7.3. Market share analysis by country
CHAPTER 6: WATERPROOFING PRODUCTS MARKET, BY REGION
- 6.1. Overview
- 6.1.1. Market size and forecast By Region
- 6.2. North America
- 6.2.1. Key market trends, growth factors and opportunities
- 6.2.2. Market size and forecast, by Product Type
- 6.2.3. Market size and forecast, by Application
- 6.2.4. Market size and forecast, by country
- 6.2.4.1. U.S.
- 6.2.4.1.1. Market size and forecast, by Product Type
- 6.2.4.1.2. Market size and forecast, by Application
- 6.2.4.2. Mexico
- 6.2.4.2.1. Market size and forecast, by Product Type
- 6.2.4.2.2. Market size and forecast, by Application
- 6.2.4.3. Canada
- 6.2.4.3.1. Market size and forecast, by Product Type
- 6.2.4.3.2. Market size and forecast, by Application
- 6.3. Europe
- 6.3.1. Key market trends, growth factors and opportunities
- 6.3.2. Market size and forecast, by Product Type
- 6.3.3. Market size and forecast, by Application
- 6.3.4. Market size and forecast, by country
- 6.3.4.1. Germany
- 6.3.4.1.1. Market size and forecast, by Product Type
- 6.3.4.1.2. Market size and forecast, by Application
- 6.3.4.2. France
- 6.3.4.2.1. Market size and forecast, by Product Type
- 6.3.4.2.2. Market size and forecast, by Application
- 6.3.4.3. UK
- 6.3.4.3.1. Market size and forecast, by Product Type
- 6.3.4.3.2. Market size and forecast, by Application
- 6.3.4.4. Rest of Europe
- 6.3.4.4.1. Market size and forecast, by Product Type
- 6.3.4.4.2. Market size and forecast, by Application
- 6.4. Asia-Pacific
- 6.4.1. Key market trends, growth factors and opportunities
- 6.4.2. Market size and forecast, by Product Type
- 6.4.3. Market size and forecast, by Application
- 6.4.4. Market size and forecast, by country
- 6.4.4.1. China
- 6.4.4.1.1. Market size and forecast, by Product Type
- 6.4.4.1.2. Market size and forecast, by Application
- 6.4.4.2. Japan
- 6.4.4.2.1. Market size and forecast, by Product Type
- 6.4.4.2.2. Market size and forecast, by Application
- 6.4.4.3. India
- 6.4.4.3.1. Market size and forecast, by Product Type
- 6.4.4.3.2. Market size and forecast, by Application
- 6.4.4.4. Indonesia
- 6.4.4.4.1. Market size and forecast, by Product Type
- 6.4.4.4.2. Market size and forecast, by Application
- 6.4.4.5. Vietnam
- 6.4.4.5.1. Market size and forecast, by Product Type
- 6.4.4.5.2. Market size and forecast, by Application
- 6.4.4.6. Rest of Asia-Pacific
- 6.4.4.6.1. Market size and forecast, by Product Type
- 6.4.4.6.2. Market size and forecast, by Application
- 6.5. South America
- 6.5.1. Key market trends, growth factors and opportunities
- 6.5.2. Market size and forecast, by Product Type
- 6.5.3. Market size and forecast, by Application
- 6.5.4. Market size and forecast, by country
- 6.5.4.1. Brazil
- 6.5.4.1.1. Market size and forecast, by Product Type
- 6.5.4.1.2. Market size and forecast, by Application
- 6.5.4.2. Argentina
- 6.5.4.2.1. Market size and forecast, by Product Type
- 6.5.4.2.2. Market size and forecast, by Application
- 6.5.4.3. Chile
- 6.5.4.3.1. Market size and forecast, by Product Type
- 6.5.4.3.2. Market size and forecast, by Application
- 6.5.4.4. Rest Of South America
- 6.5.4.4.1. Market size and forecast, by Product Type
- 6.5.4.4.2. Market size and forecast, by Application
- 6.6. Middle East and Africa
- 6.6.1. Key market trends, growth factors and opportunities
- 6.6.2. Market size and forecast, by Product Type
- 6.6.3. Market size and forecast, by Application
- 6.6.4. Market size and forecast, by country
- 6.6.4.1. South Africa
- 6.6.4.1.1. Market size and forecast, by Product Type
- 6.6.4.1.2. Market size and forecast, by Application
- 6.6.4.2. Saudi Arabia
- 6.6.4.2.1. Market size and forecast, by Product Type
- 6.6.4.2.2. Market size and forecast, by Application
- 6.6.4.3. UAE
- 6.6.4.3.1. Market size and forecast, by Product Type
- 6.6.4.3.2. Market size and forecast, by Application
- 6.6.4.4. Rest of Middle East And Africa
- 6.6.4.4.1. Market size and forecast, by Product Type
- 6.6.4.4.2. Market size and forecast, by Application
CHAPTER 7: COMPETITIVE LANDSCAPE
- 7.1. Introduction
- 7.2. Top winning strategies
- 7.3. Product mapping of top 10 player
- 7.4. Competitive dashboard
- 7.5. Competitive heatmap
- 7.6. Top player positioning, 2019
CHAPTER 8: COMPANY PROFILES
- 8.1. Henry Company
- 8.1.1. Company overview
- 8.1.2. Key executives
- 8.1.3. Company snapshot
- 8.1.4. Operating business segments
- 8.1.5. Product portfolio
- 8.1.6. Key strategic moves and developments
- 8.2. GAF.
- 8.2.1. Company overview
- 8.2.2. Key executives
- 8.2.3. Company snapshot
- 8.2.4. Operating business segments
- 8.2.5. Product portfolio
- 8.3. Soprema
- 8.3.1. Company overview
- 8.3.2. Key executives
- 8.3.3. Company snapshot
- 8.3.4. Operating business segments
- 8.3.5. Product portfolio
- 8.4. Sika AG
- 8.4.1. Company overview
- 8.4.2. Key executives
- 8.4.3. Company snapshot
- 8.4.4. Operating business segments
- 8.4.5. Product portfolio
- 8.4.6. Business performance
- 8.4.7. Key strategic moves and developments
- 8.5. Carlisle Companies Inc.
- 8.5.1. Company overview
- 8.5.2. Key executives
- 8.5.3. Company snapshot
- 8.5.4. Operating business segments
- 8.5.5. Product portfolio
- 8.5.6. Business performance
- 8.6. GCP Applied Technologies Inc.
- 8.6.1. Company overview
- 8.6.2. Key executives
- 8.6.3. Company snapshot
- 8.6.4. Operating business segments
- 8.6.5. Product portfolio
- 8.6.6. Business performance
- 8.7. RPM International Inc.
- 8.7.1. Company overview
- 8.7.2. Key executives
- 8.7.3. Company snapshot
- 8.7.4. Operating business segments
- 8.7.5. Product portfolio
- 8.7.6. Business performance
- 8.8. HOLCIM
- 8.8.1. Company overview
- 8.8.2. Key executives
- 8.8.3. Company snapshot
- 8.8.4. Operating business segments
- 8.8.5. Product portfolio
- 8.8.6. Business performance
- 8.8.7. Key strategic moves and developments
- 8.9. BASF SE
- 8.9.1. Company overview
- 8.9.2. Key executives
- 8.9.3. Company snapshot
- 8.9.4. Operating business segments
- 8.9.5. Product portfolio
- 8.9.6. Business performance
- 8.9.7. Key strategic moves and developments
- 8.10. Dow
- 8.10.1. Company overview
- 8.10.2. Key executives
- 8.10.3. Company snapshot
- 8.10.4. Operating business segments
- 8.10.5. Product portfolio
- 8.10.6. Business performance
