
|
市場調査レポート
商品コード
1684078
インドネシアの防水ソリューション:市場シェア分析、産業動向、成長予測(2025年~2030年)Indonesia Waterproofing Solutions - Market Share Analysis, Industry Trends & Statistics, Growth Forecasts (2025 - 2030) |
||||||
カスタマイズ可能
適宜更新あり
|
|||||||
| インドネシアの防水ソリューション:市場シェア分析、産業動向、成長予測(2025年~2030年) |
|
出版日: 2025年03月18日
発行: Mordor Intelligence
ページ情報: 英文 207 Pages
納期: 2~3営業日
|

全表示
- 概要
- 目次
概要
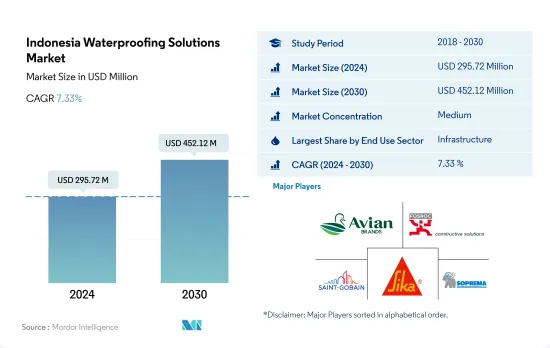
インドネシアの防水ソリューション市場規模は2024年に2億9,572万米ドルと推定され、2030年には4億5,212万米ドルに達すると予測され、予測期間(2024年~2030年)のCAGRは7.33%で成長する見込みです。
住宅需要の増加が防水ソリューションの需要を牽引する可能性が高い
- 2022年、インドネシアにおける防水ソリューションの消費は、インフラ、住宅、商業建設部門からの需要増に牽引され、金額ベースで3.89%の伸びを示しました。2023年までに、インドネシアの防水ソリューション市場はアジア太平洋市場の約2.13%を占めると予想されます。
- インフラの最終用途部門が防水ソリューションの最大消費者で、2022年には27.49%を占めました。インフラ支出は、2023年には582億7,000万米ドルに達すると予測されています。支出の増加に伴い、インドネシアは特にエネルギーと輸送においてグリーン・インフラに注力しており、大きな投資機会となります。2030年までに、同国は気候変動対応インフラに3,228億米ドルを必要とすると予測され、その75%をエネルギーと輸送が占め、2,450億米ドルとなります。その結果、このセクターの防水ソリューション需要は、2023年から2030年までに3,493万米ドル増加すると予測されます。
- インドネシアの住宅セクターは、予測期間中のCAGRが8.27%と最も急成長する消費者になるとみられます。同国の新規住宅床面積は、2023年には7億7,800万平方フィートに達します。インドネシア政府(GOI)は2025年までに100万戸の住宅建設を目標としています。このような住宅プロジェクトの急増により、同分野の防水ソリューション需要は2023年の6,368万米ドルから2030年には1億1,100万米ドルに増加すると予想されます。
インドネシアの防水ソリューション市場動向
インドネシアの商業用不動産市場規模は2028年までに1兆3,900億米ドルに達すると予測され、商業セクターの需要が増大する可能性が高いです。
- 2022年、インドネシアの新規商業床面積は前年比9.7%減少しました。この落ち込みは、COVID-19パンデミック時の建築活動の落ち込みから平常に戻った結果です。パンデミック以前から、インドネシアの商業ビルの年間エネルギー原単位は低下傾向を示しており、その割合は年率2.64%でした。しかし、2023年には回復が見られ、新しいオフィス、倉庫、小売スペースを必要とする外国直接投資(FDI)の急増が原動力となって、新しい商業床面積が5.7%増加しました。
- COVID-19が大流行する中、2020年と2021年にインドネシアは、約960万平方フィートを占める新規商業床面積の大幅な急増を示しました。政府が経済活性化に注力した結果、民間・公共プロジェクトともに建設関連の検疫が緩和されるなどの措置がとられました。これにより、従業員は現場での仕事を再開し、企業も事業を継続できるようになりました。特筆すべきは、インドネシアの完成工事高が2020年には約1兆3,200億IDRに達し、2021年には1兆4,200億IDRに増加することです。
- インドネシアの新規商業床面積は、2023年と比較して2030年までに約58.72%の力強い成長が予測されています。この急増は、ショッピングモール、オフィス、その他の商業スペースに対する需要の高まりによるものです。小売不動産セグメントは、同国で特に魅惑的なセクターとして浮上しています。例えば、商業用不動産市場の規模は、2028年までに1兆3,900億米ドルに達すると予想されています。インドネシアの商業用新設床面積は、予測期間中にCAGR 6.82%を記録し、安定した成長を維持すると予想されます。
住宅需要の増加が住宅セクターの成長を促進する可能性が高い
- 2022年、インドネシアの住宅新設床面積は2021年比で7.10%の伸びを示しました。この急増は人口増加、富裕化、都市化に起因しています。政府主導の住宅支援は2022年に29兆ルピアに達し、住宅融資流動性ファシリティ・スキームの下、2023年には32兆ルピアに増加すると予測されました。このイニシアチブは、少なくとも22万戸の住宅建設を目指しています。住宅建設セクターは著しい成長を遂げる見込みです。2023年には前年比で約5,600万平方フィートに増加すると推定されます。
- 2020年、インドネシアの住宅新築床面積は2019年比で7.06%増加しました。これは政府による戦略的な動きで、景気後退を緩和し、収入減に悩む家計を支援するために建設を優先させました。その結果、検疫を含む建設活動の制限が大幅に緩和されました。しかし、2021年には動向が逆転し、住宅着工床面積は約12.54%減少しました。これは主に、建設部門への外国直接投資(FDI)の落ち込みが原因です。2021年の建設へのFDIは前年比51%減となりました。
- インドネシアの住宅新設床面積は、予測期間中、数量ベースでCAGR 6.08%の成長が見込まれます。この成長は、政府のイニシアティブと国内外の投資によって後押しされた、同国の都市化の進展に起因します。これらの要因は、直接的・間接的に、同国における住宅ニーズの高まりを強調し、最終的に住宅建設を促進します。急増する需要を満たすためには、2030年までに年間82万戸から100万戸の住宅が必要になると予測されています。
インドネシアの防水ソリューション産業の概要
インドネシアの防水ソリューション市場は、上位5社で45.62%を占め、緩やかに統合されています。同市場の主要企業は以下の通り。 Avian Brands, Fosroc, Inc., Saint-Gobain, Sika AG and Soprema(sorted alphabetically).
その他の特典
- エクセル形式の市場予測(ME)シート
- 3ヶ月のアナリストサポート
目次
第1章 エグゼクティブサマリーと主な調査結果
第2章 レポートのオファー
第3章 イントロダクション
- 調査の前提条件と市場定義
- 調査範囲
- 調査手法
第4章 主要産業動向
- 最終用途分野の動向
- 商業
- 産業・施設
- インフラ
- 住宅
- 主要インフラプロジェクト(現在および発表済み)
- 規制の枠組み
- バリューチェーンと流通チャネル分析
第5章 市場セグメンテーション
- 最終用途セクター
- 商業
- 産業・施設
- インフラ
- 住宅
- サブプロダクト
- 化学製品
- 技術別
- エポキシ系
- ポリウレタン系
- 水性
- その他の技術
- メンブレン
- 技術別
- コールドリキッド
- 完全接着シート
- ホットリキッド
- ルーズレイドシート
- 化学製品
第6章 競合情勢
- 主要な戦略的動き
- 市場シェア分析
- 企業情勢
- 企業プロファイル
- Ardex Group
- Avian Brands
- Fosroc, Inc.
- MAPEI S.p.A.
- Normet
- PT. ASPAL POLIMER EMULSINDO
- PT. Selaras Cipta Global
- Saint-Gobain
- Sika AG
- Soprema
第7章 CEOへの主な戦略的質問CEOへの主な戦略的質問
第8章 付録
- 世界概要
- 概要
- ファイブフォース分析フレームワーク(産業魅力度分析)
- 世界・バリューチェーン分析
- 市場力学(DROs)
- 情報源と参考文献
- 図表一覧
- 主要洞察
- データパック
- 用語集
目次
Product Code: 50002031
The Indonesia Waterproofing Solutions Market size is estimated at 295.72 million USD in 2024, and is expected to reach 452.12 million USD by 2030, growing at a CAGR of 7.33% during the forecast period (2024-2030).
Rising demand for housing units is likely to drive the demand for waterproofing solutions
- In 2022, the consumption of waterproofing solutions in Indonesia saw a 3.89% growth in terms of value, driven by rising demand from the infrastructure, residential, and commercial construction sectors. By 2023, the Indonesian waterproofing solutions market was expected to make up approximately 2.13% of the broader Asia-Pacific market.
- The infrastructure end-use sector stands as the largest consumer of waterproofing solutions, accounting for 27.49% in 2022. Infrastructure spending was anticipated to amount to a value of USD 58.27 billion in 2023. Owing to the growing spending, Indonesia's focus on green infrastructure, especially in energy and transportation, presents a significant investment opportunity. By 2030, the country is projected to require USD 322.8 billion for climate-compatible infrastructure, with energy and transport accounting for 75% at USD 245 billion. Consequently, the sector's demand for waterproofing solutions is projected to rise by USD 34.93 million from 2023 to 2030.
- Indonesia's residential sector is poised to be the fastest-growing consumer, with a CAGR of 8.27% during the forecast period. The country's new residential floor area was set to hit 778 million sq. ft in 2023. The Government of Indonesia (GOI) aims to construct 1 million housing units by 2025, as the nation's housing needs are estimated to reach 30 million units. This surge in housing projects is expected to drive the sector's demand for waterproofing solutions to USD 111 million by 2030, up from USD 63.68 million in 2023.
Indonesia Waterproofing Solutions Market Trends
Indonesian commercial real estate market volume is projected to reach USD 1.39 trillion by 2028 and is likely to augment the demand for commercial sector
- In 2022, Indonesia witnessed a 9.7% decline in the volume of new commercial floor area compared to the previous year. This drop was a result of a return to normalcy following a decline in building activities during the COVID-19 pandemic. Even before the pandemic, commercial buildings in Indonesia were already showing a downward trend in annual energy intensity, accounting for a rate of 2.64% per year. However, in 2023, the country saw a rebound, registering a 5.7% increase in the volume of new commercial floor area, driven by a surge in foreign direct investment (FDI) necessitating new offices, warehouses, and retail spaces.
- Amidst the COVID-19 pandemic, in 2020 and 2021, Indonesia witnessed a significant surge in the volume of new commercial floor area, accounting for approximately 9.6 million square feet. The government's focus on revitalizing the economy led to measures such as easing construction-related quarantines, both in private and public projects. This allowed employees to resume work on-site and companies to continue their operations. Notably, the value of completed constructions in Indonesia stood at around IDR 1.32 quadrillion in 2020 and rose to IDR 1.42 quadrillion in 2021.
- The volume of new commercial floor area in Indonesia is projected to witness a robust growth of around 58.72% by 2030 compared to 2023. This surge is driven by a rising demand for shopping malls, offices, and other commercial spaces. The retail real estate segment is emerging as a particularly captivating sector in the country. For instance, the volume of the commercial real estate market is anticipated to reach USD 1.39 trillion by 2028. The commercial new floor area in Indonesia is expected to maintain steady growth, registering a CAGR of 6.82% during the forecast period.
Increase in demand for housing units is likely to augment the residential sector's growth
- In 2022, Indonesia witnessed a 7.10% volume growth in residential new floor area compared to 2021. This surge can be attributed to increased population, wealth, and urbanization. The government-led housing aid reached IDR 29 trillion in 2022, which was projected to increase to IDR 32 trillion in 2023 under the Housing Financing Liquidity Facility scheme. This initiative aims to construct at least 220 thousand houses. The residential construction sector is poised to witness a significant growth rate. It was estimated to increase to approximately 56 million square feet in 2023 compared to the preceding year.
- In 2020, the volume of residential new floor areas in Indonesia grew by 7.06% compared to 2019. This was a strategic move by the government, prioritizing construction to mitigate the economic downturn and support households grappling with reduced incomes. Consequently, restrictions on construction activities, including quarantines, were significantly eased. However, in 2021, the trend reversed, with a decline of about 12.54% in residential new floor area, primarily attributed to a dip in foreign direct investment (FDI) in the construction sector. FDI for construction plummeted by 51% in 2021 compared to the previous year.
- The residential new floor area in Indonesia is projected to witness a CAGR of 6.08% in volume during the forecast period. This growth stems from the country's increasing urbanization, bolstered by government initiatives and foreign and domestic investments. These factors, directly and indirectly, underscore the mounting housing needs in the nation, ultimately driving residential building construction. Projections indicate that to meet the escalating demand, the country would require between 820,000 and 1 million housing units annually by 2030.
Indonesia Waterproofing Solutions Industry Overview
The Indonesia Waterproofing Solutions Market is moderately consolidated, with the top five companies occupying 45.62%. The major players in this market are Avian Brands, Fosroc, Inc., Saint-Gobain, Sika AG and Soprema (sorted alphabetically).
Additional Benefits:
- The market estimate (ME) sheet in Excel format
- 3 months of analyst support
TABLE OF CONTENTS
1 EXECUTIVE SUMMARY & KEY FINDINGS
2 REPORT OFFERS
3 INTRODUCTION
- 3.1 Study Assumptions & Market Definition
- 3.2 Scope of the Study
- 3.3 Research Methodology
4 KEY INDUSTRY TRENDS
- 4.1 End Use Sector Trends
- 4.1.1 Commercial
- 4.1.2 Industrial and Institutional
- 4.1.3 Infrastructure
- 4.1.4 Residential
- 4.2 Major Infrastructure Projects (current And Announced)
- 4.3 Regulatory Framework
- 4.4 Value Chain & Distribution Channel Analysis
5 MARKET SEGMENTATION (includes market size, forecasts up to 2030 and analysis of growth prospects.)
- 5.1 End Use Sector
- 5.1.1 Commercial
- 5.1.2 Industrial and Institutional
- 5.1.3 Infrastructure
- 5.1.4 Residential
- 5.2 Sub Product
- 5.2.1 Chemicals
- 5.2.1.1 By Technology
- 5.2.1.1.1 Epoxy-based
- 5.2.1.1.2 Polyurethane-based
- 5.2.1.1.3 Water-based
- 5.2.1.1.4 Other Technologies
- 5.2.2 Membranes
- 5.2.2.1 By Technology
- 5.2.2.1.1 Cold Liquid Applied
- 5.2.2.1.2 Fully Adhered Sheet
- 5.2.2.1.3 Hot Liquid Applied
- 5.2.2.1.4 Loose Laid Sheet
- 5.2.1 Chemicals
6 COMPETITIVE LANDSCAPE
- 6.1 Key Strategic Moves
- 6.2 Market Share Analysis
- 6.3 Company Landscape
- 6.4 Company Profiles
- 6.4.1 Ardex Group
- 6.4.2 Avian Brands
- 6.4.3 Fosroc, Inc.
- 6.4.4 MAPEI S.p.A.
- 6.4.5 Normet
- 6.4.6 PT. ASPAL POLIMER EMULSINDO
- 6.4.7 PT. Selaras Cipta Global
- 6.4.8 Saint-Gobain
- 6.4.9 Sika AG
- 6.4.10 Soprema
7 KEY STRATEGIC QUESTIONS FOR CONCRETE, MORTARS AND CONSTRUCTION CHEMICALS CEOS
8 APPENDIX
- 8.1 Global Overview
- 8.1.1 Overview
- 8.1.2 Porter's Five Forces Framework (Industry Attractiveness Analysis)
- 8.1.3 Global Value Chain Analysis
- 8.1.4 Market Dynamics (DROs)
- 8.2 Sources & References
- 8.3 List of Tables & Figures
- 8.4 Primary Insights
- 8.5 Data Pack
- 8.6 Glossary of Terms

