 |
市場調査レポート
商品コード
1414849
ワークフロー管理システムの世界市場:コンポーネント別、企業規模別、展開モード別、産業別 - 機会分析・産業予測、2023~2032年Workflow Management Systems Market By Component, By Enterprise Size, By Deployment Mode, By Industry : Global Opportunity Analysis and Industry Forecast, 2023-2032 |
||||||

| ワークフロー管理システムの世界市場:コンポーネント別、企業規模別、展開モード別、産業別 - 機会分析・産業予測、2023~2032年 |
|
出版日: 2023年11月30日
発行: Allied Market Research
ページ情報: 英文 494 Pages
納期: 2~3営業日
|
- 全表示
- 概要
- 図表
- 目次
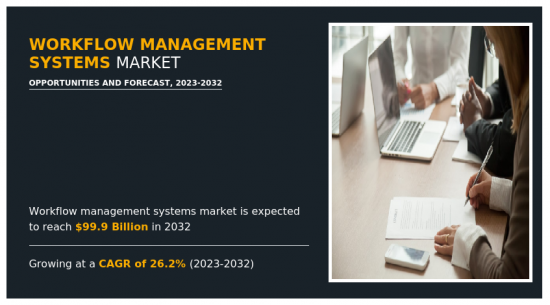
世界のワークフロー管理システムの市場規模は、2022年に98億米ドルに達し、2023~2032年にかけてCAGR 26.2%で成長し、2032年には999億米ドルに達すると予測されています。
各地域でリモートワーク環境が重視されるようになっていることが、ワークフロー管理システム市場の主な促進要因の1つです。世界の労働人口のかなりの部分が従来とは異なるオフィス環境で業務を行っているため、組織は最適化リスクの高まりに直面しています。異なる場所やデバイスから企業ネットワークや機密情報にアクセスする遠隔地の従業員の存在は、悪意のある個人が悪用する脆弱性につながります。そのため、ワークフロー管理システムが提供するリアルタイムの識別、定期的な監視、最適化機能に対する需要が高まっています。これらのソリューションは、リモートアクセスポイントの保護、リモートワーカーを狙った脅威の検出と緩和、安全な接続性の確保を可能にし、現在のリモートワークの状況において不可欠なものとなっています。
さらに、同市場はワークフロー管理システムのソリューションやサービスに関連する多額の費用によって大きな影響を受けています。主に、予算に制約のある中小企業にとっては、こうした経費が足かせとなる可能性があります。中小企業は、ワークフロー管理システムを経済的負担として認識し、サイバーセキュリティ対策への投資不足を招き、サイバー脅威に対して脆弱になる可能性があります。これにより、ワークフロー管理システムソリューション・サービスの高コストによる悪影響がさらに軽減されます。
さらに、ワークフロー管理システム市場にプラスの影響を与える注目すべき要因として、複数の産業における先端技術の採用の増加や、世界市場の成長を後押しする遠隔地および分散型ワークフォースの増加が挙げられます。しかしながら、ワークフロー管理システムに関連する高い導入コストや、ワークフロー管理システムと既存システムとの統合における複雑さが、市場成長の妨げとなる可能性があります。しかし、クラウドベースの技術導入の増加は、市場プレーヤーに有利な市場機会を提供します。
目次
第1章 イントロダクション
第2章 エグゼクティブサマリー
第3章 市場概要
- 市場の定義と範囲
- 主な調査結果
- 影響要因
- 主な投資機会
- ポーターのファイブフォース分析
- 市場力学
- 促進要因
- 複数の産業における先端技術の採用増加
- リモートワークや分散型ワークフォースの台頭
- 抑制要因
- ワークフロー管理システムの高い導入コスト
- ワークフロー管理システムを既存システムと統合する際の複雑さ
- 機会
- クラウドベースのテクノロジー導入の増加
- 促進要因
第4章 ワークフロー管理システム市場:コンポーネント別
- 概要
- ソフトウェア
- サービス
第5章 ワークフロー管理システム市場:企業規模別
- 概要
- 大企業
- 中小企業
第6章 ワークフロー管理システム市場:展開モード別
- 概要
- オンプレミス
- クラウド
第7章 ワークフロー管理システムワークフロー管理システム市場:産業別
- 概要
- BFSI
- 小売
- 教育
- IT・通信
- ヘルスケア
- 輸送
- その他
第8章 ワークフロー管理システム市場:地域別
- 概要
- 北米
- 米国
- カナダ
- 欧州
- 英国
- ドイツ
- フランス
- イタリア
- スペイン
- その他
- アジア太平洋
- 中国
- 日本
- インド
- オーストラリア
- 韓国
- その他
- ラテンアメリカ
- ラテンアメリカ
- 中東
- アフリカ
第9章 競合情勢
- イントロダクション
- 主要成功戦略
- 主要10社の製品マッピング
- 競合ダッシュボード
- 競合ヒートマップ
- 主要企業のポジショニング、2022年
第10章 企業プロファイル
- Appian Corporation
- Bizagi Limited
- IBM Corporation
- Microsoft Corporation
- Newgen Software Technologies Limited.
- Nintex Global Limited
- Oracle Corporation
- Pegasystems Inc.
- ServiceNow, Inc.
- Software AG
- TIBCO Software Inc.
LIST OF TABLES
- TABLE 01. GLOBAL WORKFLOW MANAGEMENT SYSTEMS MARKET, BY COMPONENT, 2022-2032 ($MILLION)
- TABLE 02. WORKFLOW MANAGEMENT SYSTEMS MARKET FOR SOFTWARE, BY REGION, 2022-2032 ($MILLION)
- TABLE 03. WORKFLOW MANAGEMENT SYSTEMS MARKET FOR SERVICES, BY REGION, 2022-2032 ($MILLION)
- TABLE 04. GLOBAL WORKFLOW MANAGEMENT SYSTEMS MARKET, BY ENTERPRISE SIZE, 2022-2032 ($MILLION)
- TABLE 05. WORKFLOW MANAGEMENT SYSTEMS MARKET FOR LARGE ENTERPRISE, BY REGION, 2022-2032 ($MILLION)
- TABLE 06. WORKFLOW MANAGEMENT SYSTEMS MARKET FOR SMES, BY REGION, 2022-2032 ($MILLION)
- TABLE 07. GLOBAL WORKFLOW MANAGEMENT SYSTEMS MARKET, BY DEPLOYMENT MODE, 2022-2032 ($MILLION)
- TABLE 08. WORKFLOW MANAGEMENT SYSTEMS MARKET FOR ON-PREMISE, BY REGION, 2022-2032 ($MILLION)
- TABLE 09. WORKFLOW MANAGEMENT SYSTEMS MARKET FOR CLOUD, BY REGION, 2022-2032 ($MILLION)
- TABLE 10. GLOBAL WORKFLOW MANAGEMENT SYSTEMS MARKET, BY INDUSTRY, 2022-2032 ($MILLION)
- TABLE 11. WORKFLOW MANAGEMENT SYSTEMS MARKET FOR BFSI, BY REGION, 2022-2032 ($MILLION)
- TABLE 12. WORKFLOW MANAGEMENT SYSTEMS MARKET FOR RETAIL, BY REGION, 2022-2032 ($MILLION)
- TABLE 13. WORKFLOW MANAGEMENT SYSTEMS MARKET FOR EDUCATION, BY REGION, 2022-2032 ($MILLION)
- TABLE 14. WORKFLOW MANAGEMENT SYSTEMS MARKET FOR IT AND TELECOM, BY REGION, 2022-2032 ($MILLION)
- TABLE 15. WORKFLOW MANAGEMENT SYSTEMS MARKET FOR HEALTHCARE, BY REGION, 2022-2032 ($MILLION)
- TABLE 16. WORKFLOW MANAGEMENT SYSTEMS MARKET FOR TRANSPORTATION, BY REGION, 2022-2032 ($MILLION)
- TABLE 17. WORKFLOW MANAGEMENT SYSTEMS MARKET FOR OTHERS, BY REGION, 2022-2032 ($MILLION)
- TABLE 18. WORKFLOW MANAGEMENT SYSTEMS MARKET, BY REGION, 2022-2032 ($MILLION)
- TABLE 19. NORTH AMERICA WORKFLOW MANAGEMENT SYSTEMS MARKET, BY COMPONENT, 2022-2032 ($MILLION)
- TABLE 20. NORTH AMERICA WORKFLOW MANAGEMENT SYSTEMS MARKET, BY ENTERPRISE SIZE, 2022-2032 ($MILLION)
- TABLE 21. NORTH AMERICA WORKFLOW MANAGEMENT SYSTEMS MARKET, BY DEPLOYMENT MODE, 2022-2032 ($MILLION)
- TABLE 22. NORTH AMERICA WORKFLOW MANAGEMENT SYSTEMS MARKET, BY INDUSTRY, 2022-2032 ($MILLION)
- TABLE 23. NORTH AMERICA WORKFLOW MANAGEMENT SYSTEMS MARKET, BY COUNTRY, 2022-2032 ($MILLION)
- TABLE 24. U.S. WORKFLOW MANAGEMENT SYSTEMS MARKET, BY COMPONENT, 2022-2032 ($MILLION)
- TABLE 25. U.S. WORKFLOW MANAGEMENT SYSTEMS MARKET, BY ENTERPRISE SIZE, 2022-2032 ($MILLION)
- TABLE 26. U.S. WORKFLOW MANAGEMENT SYSTEMS MARKET, BY DEPLOYMENT MODE, 2022-2032 ($MILLION)
- TABLE 27. U.S. WORKFLOW MANAGEMENT SYSTEMS MARKET, BY INDUSTRY, 2022-2032 ($MILLION)
- TABLE 28. CANADA WORKFLOW MANAGEMENT SYSTEMS MARKET, BY COMPONENT, 2022-2032 ($MILLION)
- TABLE 29. CANADA WORKFLOW MANAGEMENT SYSTEMS MARKET, BY ENTERPRISE SIZE, 2022-2032 ($MILLION)
- TABLE 30. CANADA WORKFLOW MANAGEMENT SYSTEMS MARKET, BY DEPLOYMENT MODE, 2022-2032 ($MILLION)
- TABLE 31. CANADA WORKFLOW MANAGEMENT SYSTEMS MARKET, BY INDUSTRY, 2022-2032 ($MILLION)
- TABLE 32. EUROPE WORKFLOW MANAGEMENT SYSTEMS MARKET, BY COMPONENT, 2022-2032 ($MILLION)
- TABLE 33. EUROPE WORKFLOW MANAGEMENT SYSTEMS MARKET, BY ENTERPRISE SIZE, 2022-2032 ($MILLION)
- TABLE 34. EUROPE WORKFLOW MANAGEMENT SYSTEMS MARKET, BY DEPLOYMENT MODE, 2022-2032 ($MILLION)
- TABLE 35. EUROPE WORKFLOW MANAGEMENT SYSTEMS MARKET, BY INDUSTRY, 2022-2032 ($MILLION)
- TABLE 36. EUROPE WORKFLOW MANAGEMENT SYSTEMS MARKET, BY COUNTRY, 2022-2032 ($MILLION)
- TABLE 37. UK WORKFLOW MANAGEMENT SYSTEMS MARKET, BY COMPONENT, 2022-2032 ($MILLION)
- TABLE 38. UK WORKFLOW MANAGEMENT SYSTEMS MARKET, BY ENTERPRISE SIZE, 2022-2032 ($MILLION)
- TABLE 39. UK WORKFLOW MANAGEMENT SYSTEMS MARKET, BY DEPLOYMENT MODE, 2022-2032 ($MILLION)
- TABLE 40. UK WORKFLOW MANAGEMENT SYSTEMS MARKET, BY INDUSTRY, 2022-2032 ($MILLION)
- TABLE 41. GERMANY WORKFLOW MANAGEMENT SYSTEMS MARKET, BY COMPONENT, 2022-2032 ($MILLION)
- TABLE 42. GERMANY WORKFLOW MANAGEMENT SYSTEMS MARKET, BY ENTERPRISE SIZE, 2022-2032 ($MILLION)
- TABLE 43. GERMANY WORKFLOW MANAGEMENT SYSTEMS MARKET, BY DEPLOYMENT MODE, 2022-2032 ($MILLION)
- TABLE 44. GERMANY WORKFLOW MANAGEMENT SYSTEMS MARKET, BY INDUSTRY, 2022-2032 ($MILLION)
- TABLE 45. FRANCE WORKFLOW MANAGEMENT SYSTEMS MARKET, BY COMPONENT, 2022-2032 ($MILLION)
- TABLE 46. FRANCE WORKFLOW MANAGEMENT SYSTEMS MARKET, BY ENTERPRISE SIZE, 2022-2032 ($MILLION)
- TABLE 47. FRANCE WORKFLOW MANAGEMENT SYSTEMS MARKET, BY DEPLOYMENT MODE, 2022-2032 ($MILLION)
- TABLE 48. FRANCE WORKFLOW MANAGEMENT SYSTEMS MARKET, BY INDUSTRY, 2022-2032 ($MILLION)
- TABLE 49. ITALY WORKFLOW MANAGEMENT SYSTEMS MARKET, BY COMPONENT, 2022-2032 ($MILLION)
- TABLE 50. ITALY WORKFLOW MANAGEMENT SYSTEMS MARKET, BY ENTERPRISE SIZE, 2022-2032 ($MILLION)
- TABLE 51. ITALY WORKFLOW MANAGEMENT SYSTEMS MARKET, BY DEPLOYMENT MODE, 2022-2032 ($MILLION)
- TABLE 52. ITALY WORKFLOW MANAGEMENT SYSTEMS MARKET, BY INDUSTRY, 2022-2032 ($MILLION)
- TABLE 53. SPAIN WORKFLOW MANAGEMENT SYSTEMS MARKET, BY COMPONENT, 2022-2032 ($MILLION)
- TABLE 54. SPAIN WORKFLOW MANAGEMENT SYSTEMS MARKET, BY ENTERPRISE SIZE, 2022-2032 ($MILLION)
- TABLE 55. SPAIN WORKFLOW MANAGEMENT SYSTEMS MARKET, BY DEPLOYMENT MODE, 2022-2032 ($MILLION)
- TABLE 56. SPAIN WORKFLOW MANAGEMENT SYSTEMS MARKET, BY INDUSTRY, 2022-2032 ($MILLION)
- TABLE 57. REST OF EUROPE WORKFLOW MANAGEMENT SYSTEMS MARKET, BY COMPONENT, 2022-2032 ($MILLION)
- TABLE 58. REST OF EUROPE WORKFLOW MANAGEMENT SYSTEMS MARKET, BY ENTERPRISE SIZE, 2022-2032 ($MILLION)
- TABLE 59. REST OF EUROPE WORKFLOW MANAGEMENT SYSTEMS MARKET, BY DEPLOYMENT MODE, 2022-2032 ($MILLION)
- TABLE 60. REST OF EUROPE WORKFLOW MANAGEMENT SYSTEMS MARKET, BY INDUSTRY, 2022-2032 ($MILLION)
- TABLE 61. ASIA-PACIFIC WORKFLOW MANAGEMENT SYSTEMS MARKET, BY COMPONENT, 2022-2032 ($MILLION)
- TABLE 62. ASIA-PACIFIC WORKFLOW MANAGEMENT SYSTEMS MARKET, BY ENTERPRISE SIZE, 2022-2032 ($MILLION)
- TABLE 63. ASIA-PACIFIC WORKFLOW MANAGEMENT SYSTEMS MARKET, BY DEPLOYMENT MODE, 2022-2032 ($MILLION)
- TABLE 64. ASIA-PACIFIC WORKFLOW MANAGEMENT SYSTEMS MARKET, BY INDUSTRY, 2022-2032 ($MILLION)
- TABLE 65. ASIA-PACIFIC WORKFLOW MANAGEMENT SYSTEMS MARKET, BY COUNTRY, 2022-2032 ($MILLION)
- TABLE 66. CHINA WORKFLOW MANAGEMENT SYSTEMS MARKET, BY COMPONENT, 2022-2032 ($MILLION)
- TABLE 67. CHINA WORKFLOW MANAGEMENT SYSTEMS MARKET, BY ENTERPRISE SIZE, 2022-2032 ($MILLION)
- TABLE 68. CHINA WORKFLOW MANAGEMENT SYSTEMS MARKET, BY DEPLOYMENT MODE, 2022-2032 ($MILLION)
- TABLE 69. CHINA WORKFLOW MANAGEMENT SYSTEMS MARKET, BY INDUSTRY, 2022-2032 ($MILLION)
- TABLE 70. JAPAN WORKFLOW MANAGEMENT SYSTEMS MARKET, BY COMPONENT, 2022-2032 ($MILLION)
- TABLE 71. JAPAN WORKFLOW MANAGEMENT SYSTEMS MARKET, BY ENTERPRISE SIZE, 2022-2032 ($MILLION)
- TABLE 72. JAPAN WORKFLOW MANAGEMENT SYSTEMS MARKET, BY DEPLOYMENT MODE, 2022-2032 ($MILLION)
- TABLE 73. JAPAN WORKFLOW MANAGEMENT SYSTEMS MARKET, BY INDUSTRY, 2022-2032 ($MILLION)
- TABLE 74. INDIA WORKFLOW MANAGEMENT SYSTEMS MARKET, BY COMPONENT, 2022-2032 ($MILLION)
- TABLE 75. INDIA WORKFLOW MANAGEMENT SYSTEMS MARKET, BY ENTERPRISE SIZE, 2022-2032 ($MILLION)
- TABLE 76. INDIA WORKFLOW MANAGEMENT SYSTEMS MARKET, BY DEPLOYMENT MODE, 2022-2032 ($MILLION)
- TABLE 77. INDIA WORKFLOW MANAGEMENT SYSTEMS MARKET, BY INDUSTRY, 2022-2032 ($MILLION)
- TABLE 78. AUSTRALIA WORKFLOW MANAGEMENT SYSTEMS MARKET, BY COMPONENT, 2022-2032 ($MILLION)
- TABLE 79. AUSTRALIA WORKFLOW MANAGEMENT SYSTEMS MARKET, BY ENTERPRISE SIZE, 2022-2032 ($MILLION)
- TABLE 80. AUSTRALIA WORKFLOW MANAGEMENT SYSTEMS MARKET, BY DEPLOYMENT MODE, 2022-2032 ($MILLION)
- TABLE 81. AUSTRALIA WORKFLOW MANAGEMENT SYSTEMS MARKET, BY INDUSTRY, 2022-2032 ($MILLION)
- TABLE 82. SOUTH KOREA WORKFLOW MANAGEMENT SYSTEMS MARKET, BY COMPONENT, 2022-2032 ($MILLION)
- TABLE 83. SOUTH KOREA WORKFLOW MANAGEMENT SYSTEMS MARKET, BY ENTERPRISE SIZE, 2022-2032 ($MILLION)
- TABLE 84. SOUTH KOREA WORKFLOW MANAGEMENT SYSTEMS MARKET, BY DEPLOYMENT MODE, 2022-2032 ($MILLION)
- TABLE 85. SOUTH KOREA WORKFLOW MANAGEMENT SYSTEMS MARKET, BY INDUSTRY, 2022-2032 ($MILLION)
- TABLE 86. REST OF ASIA-PACIFIC WORKFLOW MANAGEMENT SYSTEMS MARKET, BY COMPONENT, 2022-2032 ($MILLION)
- TABLE 87. REST OF ASIA-PACIFIC WORKFLOW MANAGEMENT SYSTEMS MARKET, BY ENTERPRISE SIZE, 2022-2032 ($MILLION)
- TABLE 88. REST OF ASIA-PACIFIC WORKFLOW MANAGEMENT SYSTEMS MARKET, BY DEPLOYMENT MODE, 2022-2032 ($MILLION)
- TABLE 89. REST OF ASIA-PACIFIC WORKFLOW MANAGEMENT SYSTEMS MARKET, BY INDUSTRY, 2022-2032 ($MILLION)
- TABLE 90. LAMEA WORKFLOW MANAGEMENT SYSTEMS MARKET, BY COMPONENT, 2022-2032 ($MILLION)
- TABLE 91. LAMEA WORKFLOW MANAGEMENT SYSTEMS MARKET, BY ENTERPRISE SIZE, 2022-2032 ($MILLION)
- TABLE 92. LAMEA WORKFLOW MANAGEMENT SYSTEMS MARKET, BY DEPLOYMENT MODE, 2022-2032 ($MILLION)
- TABLE 93. LAMEA WORKFLOW MANAGEMENT SYSTEMS MARKET, BY INDUSTRY, 2022-2032 ($MILLION)
- TABLE 94. LAMEA WORKFLOW MANAGEMENT SYSTEMS MARKET, BY COUNTRY, 2022-2032 ($MILLION)
- TABLE 95. LATIN AMERICA WORKFLOW MANAGEMENT SYSTEMS MARKET, BY COMPONENT, 2022-2032 ($MILLION)
- TABLE 96. LATIN AMERICA WORKFLOW MANAGEMENT SYSTEMS MARKET, BY ENTERPRISE SIZE, 2022-2032 ($MILLION)
- TABLE 97. LATIN AMERICA WORKFLOW MANAGEMENT SYSTEMS MARKET, BY DEPLOYMENT MODE, 2022-2032 ($MILLION)
- TABLE 98. LATIN AMERICA WORKFLOW MANAGEMENT SYSTEMS MARKET, BY INDUSTRY, 2022-2032 ($MILLION)
- TABLE 99. MIDDLE EAST WORKFLOW MANAGEMENT SYSTEMS MARKET, BY COMPONENT, 2022-2032 ($MILLION)
- TABLE 100. MIDDLE EAST WORKFLOW MANAGEMENT SYSTEMS MARKET, BY ENTERPRISE SIZE, 2022-2032 ($MILLION)
- TABLE 101. MIDDLE EAST WORKFLOW MANAGEMENT SYSTEMS MARKET, BY DEPLOYMENT MODE, 2022-2032 ($MILLION)
- TABLE 102. MIDDLE EAST WORKFLOW MANAGEMENT SYSTEMS MARKET, BY INDUSTRY, 2022-2032 ($MILLION)
- TABLE 103. AFRICA WORKFLOW MANAGEMENT SYSTEMS MARKET, BY COMPONENT, 2022-2032 ($MILLION)
- TABLE 104. AFRICA WORKFLOW MANAGEMENT SYSTEMS MARKET, BY ENTERPRISE SIZE, 2022-2032 ($MILLION)
- TABLE 105. AFRICA WORKFLOW MANAGEMENT SYSTEMS MARKET, BY DEPLOYMENT MODE, 2022-2032 ($MILLION)
- TABLE 106. AFRICA WORKFLOW MANAGEMENT SYSTEMS MARKET, BY INDUSTRY, 2022-2032 ($MILLION)
- TABLE 107. APPIAN CORPORATION: KEY EXECUTIVES
- TABLE 108. APPIAN CORPORATION: COMPANY SNAPSHOT
- TABLE 109. APPIAN CORPORATION: SERVICE SEGMENTS
- TABLE 110. APPIAN CORPORATION: PRODUCT PORTFOLIO
- TABLE 111. APPIAN CORPORATION: KEY STRATERGIES
- TABLE 112. BIZAGI LIMITED: KEY EXECUTIVES
- TABLE 113. BIZAGI LIMITED: COMPANY SNAPSHOT
- TABLE 114. BIZAGI LIMITED: PRODUCT SEGMENTS
- TABLE 115. BIZAGI LIMITED: PRODUCT PORTFOLIO
- TABLE 116. BIZAGI LIMITED: KEY STRATERGIES
- TABLE 117. IBM CORPORATION: KEY EXECUTIVES
- TABLE 118. IBM CORPORATION: COMPANY SNAPSHOT
- TABLE 119. IBM CORPORATION: PRODUCT SEGMENTS
- TABLE 120. IBM CORPORATION: PRODUCT PORTFOLIO
- TABLE 121. IBM CORPORATION: KEY STRATERGIES
- TABLE 122. MICROSOFT CORPORATION: KEY EXECUTIVES
- TABLE 123. MICROSOFT CORPORATION: COMPANY SNAPSHOT
- TABLE 124. MICROSOFT CORPORATION: SERVICE SEGMENTS
- TABLE 125. MICROSOFT CORPORATION: PRODUCT PORTFOLIO
- TABLE 126. MICROSOFT CORPORATION: KEY STRATERGIES
- TABLE 127. NEWGEN SOFTWARE TECHNOLOGIES LIMITED.: KEY EXECUTIVES
- TABLE 128. NEWGEN SOFTWARE TECHNOLOGIES LIMITED.: COMPANY SNAPSHOT
- TABLE 129. NEWGEN SOFTWARE TECHNOLOGIES LIMITED.: SERVICE SEGMENTS
- TABLE 130. NEWGEN SOFTWARE TECHNOLOGIES LIMITED.: PRODUCT PORTFOLIO
- TABLE 131. NEWGEN SOFTWARE TECHNOLOGIES LIMITED.: KEY STRATERGIES
- TABLE 132. NINTEX GLOBAL LIMITED: KEY EXECUTIVES
- TABLE 133. NINTEX GLOBAL LIMITED: COMPANY SNAPSHOT
- TABLE 134. NINTEX GLOBAL LIMITED: PRODUCT SEGMENTS
- TABLE 135. NINTEX GLOBAL LIMITED: PRODUCT PORTFOLIO
- TABLE 136. NINTEX GLOBAL LIMITED: KEY STRATERGIES
- TABLE 137. ORACLE CORPORATION: KEY EXECUTIVES
- TABLE 138. ORACLE CORPORATION: COMPANY SNAPSHOT
- TABLE 139. ORACLE CORPORATION: SERVICE SEGMENTS
- TABLE 140. ORACLE CORPORATION: PRODUCT PORTFOLIO
- TABLE 141. ORACLE CORPORATION: KEY STRATERGIES
- TABLE 142. PEGASYSTEMS INC.: KEY EXECUTIVES
- TABLE 143. PEGASYSTEMS INC.: COMPANY SNAPSHOT
- TABLE 144. PEGASYSTEMS INC.: SERVICE SEGMENTS
- TABLE 145. PEGASYSTEMS INC.: PRODUCT PORTFOLIO
- TABLE 146. PEGASYSTEMS INC.: KEY STRATERGIES
- TABLE 147. SERVICENOW, INC.: KEY EXECUTIVES
- TABLE 148. SERVICENOW, INC.: COMPANY SNAPSHOT
- TABLE 149. SERVICENOW, INC.: PRODUCT SEGMENTS
- TABLE 150. SERVICENOW, INC.: PRODUCT PORTFOLIO
- TABLE 151. SERVICENOW, INC.: KEY STRATERGIES
- TABLE 152. SOFTWARE AG: KEY EXECUTIVES
- TABLE 153. SOFTWARE AG: COMPANY SNAPSHOT
- TABLE 154. SOFTWARE AG: SERVICE SEGMENTS
- TABLE 155. SOFTWARE AG: PRODUCT PORTFOLIO
- TABLE 156. SOFTWARE AG: KEY STRATERGIES
- TABLE 157. TIBCO SOFTWARE INC.: KEY EXECUTIVES
- TABLE 158. TIBCO SOFTWARE INC.: COMPANY SNAPSHOT
- TABLE 159. TIBCO SOFTWARE INC.: SERVICE SEGMENTS
- TABLE 160. TIBCO SOFTWARE INC.: PRODUCT PORTFOLIO
LIST OF FIGURES
- FIGURE 01. WORKFLOW MANAGEMENT SYSTEMS MARKET, 2022-2032
- FIGURE 02. SEGMENTATION OF WORKFLOW MANAGEMENT SYSTEMS MARKET,2022-2032
- FIGURE 03. TOP IMPACTING FACTORS IN WORKFLOW MANAGEMENT SYSTEMS MARKET (2022 TO 2032)
- FIGURE 04. TOP INVESTMENT POCKETS IN WORKFLOW MANAGEMENT SYSTEMS MARKET (2023-2032)
- FIGURE 05. LOW BARGAINING POWER OF SUPPLIERS
- FIGURE 06. LOW THREAT OF NEW ENTRANTS
- FIGURE 07. LOW THREAT OF SUBSTITUTES
- FIGURE 08. LOW INTENSITY OF RIVALRY
- FIGURE 09. LOW BARGAINING POWER OF BUYERS
- FIGURE 10. GLOBAL WORKFLOW MANAGEMENT SYSTEMS MARKET:DRIVERS, RESTRAINTS AND OPPORTUNITIES
- FIGURE 11. WORKFLOW MANAGEMENT SYSTEMS MARKET, BY COMPONENT, 2022 AND 2032(%)
- FIGURE 12. COMPARATIVE SHARE ANALYSIS OF WORKFLOW MANAGEMENT SYSTEMS MARKET FOR SOFTWARE, BY COUNTRY 2022 AND 2032(%)
- FIGURE 13. COMPARATIVE SHARE ANALYSIS OF WORKFLOW MANAGEMENT SYSTEMS MARKET FOR SERVICES, BY COUNTRY 2022 AND 2032(%)
- FIGURE 14. WORKFLOW MANAGEMENT SYSTEMS MARKET, BY ENTERPRISE SIZE, 2022 AND 2032(%)
- FIGURE 15. COMPARATIVE SHARE ANALYSIS OF WORKFLOW MANAGEMENT SYSTEMS MARKET FOR LARGE ENTERPRISE, BY COUNTRY 2022 AND 2032(%)
- FIGURE 16. COMPARATIVE SHARE ANALYSIS OF WORKFLOW MANAGEMENT SYSTEMS MARKET FOR SMES, BY COUNTRY 2022 AND 2032(%)
- FIGURE 17. WORKFLOW MANAGEMENT SYSTEMS MARKET, BY DEPLOYMENT MODE, 2022 AND 2032(%)
- FIGURE 18. COMPARATIVE SHARE ANALYSIS OF WORKFLOW MANAGEMENT SYSTEMS MARKET FOR ON-PREMISE, BY COUNTRY 2022 AND 2032(%)
- FIGURE 19. COMPARATIVE SHARE ANALYSIS OF WORKFLOW MANAGEMENT SYSTEMS MARKET FOR CLOUD, BY COUNTRY 2022 AND 2032(%)
- FIGURE 20. WORKFLOW MANAGEMENT SYSTEMS MARKET, BY INDUSTRY, 2022 AND 2032(%)
- FIGURE 21. COMPARATIVE SHARE ANALYSIS OF WORKFLOW MANAGEMENT SYSTEMS MARKET FOR BFSI, BY COUNTRY 2022 AND 2032(%)
- FIGURE 22. COMPARATIVE SHARE ANALYSIS OF WORKFLOW MANAGEMENT SYSTEMS MARKET FOR RETAIL, BY COUNTRY 2022 AND 2032(%)
- FIGURE 23. COMPARATIVE SHARE ANALYSIS OF WORKFLOW MANAGEMENT SYSTEMS MARKET FOR EDUCATION, BY COUNTRY 2022 AND 2032(%)
- FIGURE 24. COMPARATIVE SHARE ANALYSIS OF WORKFLOW MANAGEMENT SYSTEMS MARKET FOR IT AND TELECOM, BY COUNTRY 2022 AND 2032(%)
- FIGURE 25. COMPARATIVE SHARE ANALYSIS OF WORKFLOW MANAGEMENT SYSTEMS MARKET FOR HEALTHCARE, BY COUNTRY 2022 AND 2032(%)
- FIGURE 26. COMPARATIVE SHARE ANALYSIS OF WORKFLOW MANAGEMENT SYSTEMS MARKET FOR TRANSPORTATION, BY COUNTRY 2022 AND 2032(%)
- FIGURE 27. COMPARATIVE SHARE ANALYSIS OF WORKFLOW MANAGEMENT SYSTEMS MARKET FOR OTHERS, BY COUNTRY 2022 AND 2032(%)
- FIGURE 28. WORKFLOW MANAGEMENT SYSTEMS MARKET BY REGION, 2022 AND 2032(%)
- FIGURE 29. U.S. WORKFLOW MANAGEMENT SYSTEMS MARKET, 2022-2032 ($MILLION)
- FIGURE 30. CANADA WORKFLOW MANAGEMENT SYSTEMS MARKET, 2022-2032 ($MILLION)
- FIGURE 31. UK WORKFLOW MANAGEMENT SYSTEMS MARKET, 2022-2032 ($MILLION)
- FIGURE 32. GERMANY WORKFLOW MANAGEMENT SYSTEMS MARKET, 2022-2032 ($MILLION)
- FIGURE 33. FRANCE WORKFLOW MANAGEMENT SYSTEMS MARKET, 2022-2032 ($MILLION)
- FIGURE 34. ITALY WORKFLOW MANAGEMENT SYSTEMS MARKET, 2022-2032 ($MILLION)
- FIGURE 35. SPAIN WORKFLOW MANAGEMENT SYSTEMS MARKET, 2022-2032 ($MILLION)
- FIGURE 36. REST OF EUROPE WORKFLOW MANAGEMENT SYSTEMS MARKET, 2022-2032 ($MILLION)
- FIGURE 37. CHINA WORKFLOW MANAGEMENT SYSTEMS MARKET, 2022-2032 ($MILLION)
- FIGURE 38. JAPAN WORKFLOW MANAGEMENT SYSTEMS MARKET, 2022-2032 ($MILLION)
- FIGURE 39. INDIA WORKFLOW MANAGEMENT SYSTEMS MARKET, 2022-2032 ($MILLION)
- FIGURE 40. AUSTRALIA WORKFLOW MANAGEMENT SYSTEMS MARKET, 2022-2032 ($MILLION)
- FIGURE 41. SOUTH KOREA WORKFLOW MANAGEMENT SYSTEMS MARKET, 2022-2032 ($MILLION)
- FIGURE 42. REST OF ASIA-PACIFIC WORKFLOW MANAGEMENT SYSTEMS MARKET, 2022-2032 ($MILLION)
- FIGURE 43. LATIN AMERICA WORKFLOW MANAGEMENT SYSTEMS MARKET, 2022-2032 ($MILLION)
- FIGURE 44. MIDDLE EAST WORKFLOW MANAGEMENT SYSTEMS MARKET, 2022-2032 ($MILLION)
- FIGURE 45. AFRICA WORKFLOW MANAGEMENT SYSTEMS MARKET, 2022-2032 ($MILLION)
- FIGURE 46. TOP WINNING STRATEGIES, BY YEAR (2020-2023)
- FIGURE 47. TOP WINNING STRATEGIES, BY DEVELOPMENT (2020-2023)
- FIGURE 48. TOP WINNING STRATEGIES, BY COMPANY (2020-2023)
- FIGURE 49. PRODUCT MAPPING OF TOP 10 PLAYERS
- FIGURE 50. COMPETITIVE DASHBOARD
- FIGURE 51. COMPETITIVE HEATMAP: WORKFLOW MANAGEMENT SYSTEMS MARKET
- FIGURE 52. TOP PLAYER POSITIONING, 2022
- FIGURE 53. APPIAN CORPORATION: NET REVENUE, 2020-2022 ($MILLION)
- FIGURE 54. APPIAN CORPORATION: REVENUE SHARE BY SEGMENT, 2022 (%)
- FIGURE 55. IBM CORPORATION: NET REVENUE, 2020-2022 ($MILLION)
- FIGURE 56. IBM CORPORATION: RESEARCH & DEVELOPMENT EXPENDITURE, 2020-2022 ($MILLION)
- FIGURE 57. IBM CORPORATION: REVENUE SHARE BY SEGMENT, 2022 (%)
- FIGURE 58. IBM CORPORATION: REVENUE SHARE BY REGION, 2022 (%)
- FIGURE 59. MICROSOFT CORPORATION: NET REVENUE, 2020-2022 ($MILLION)
- FIGURE 60. MICROSOFT CORPORATION: RESEARCH & DEVELOPMENT EXPENDITURE, 2020-2022 ($MILLION)
- FIGURE 61. MICROSOFT CORPORATION: REVENUE SHARE BY SEGMENT, 2022 (%)
- FIGURE 62. MICROSOFT CORPORATION: REVENUE SHARE BY REGION, 2022 (%)
- FIGURE 63. NEWGEN SOFTWARE TECHNOLOGIES LIMITED.: NET REVENUE, 2020-2022 ($MILLION)
- FIGURE 64. ORACLE CORPORATION: NET REVENUE, 2020-2022 ($MILLION)
- FIGURE 65. ORACLE CORPORATION: RESEARCH & DEVELOPMENT EXPENDITURE, 2020-2022 ($MILLION)
- FIGURE 66. ORACLE CORPORATION: REVENUE SHARE BY SEGMENT, 2022 (%)
- FIGURE 67. ORACLE CORPORATION: REVENUE SHARE BY REGION, 2022 (%)
- FIGURE 68. PEGASYSTEMS INC.: NET REVENUE, 2020-2022 ($MILLION)
- FIGURE 69. PEGASYSTEMS INC.: REVENUE SHARE BY SEGMENT, 2021 (%)
- FIGURE 70. PEGASYSTEMS INC.: REVENUE SHARE BY REGION, 2021 (%)
- FIGURE 71. SERVICENOW, INC.: NET REVENUE, 2020-2022 ($MILLION)
- FIGURE 72. SERVICENOW, INC.: REVENUE SHARE BY REGION, 2022 (%)
- FIGURE 73. SOFTWARE AG: NET REVENUE, 2020-2022 ($MILLION)
- FIGURE 74. SOFTWARE AG: REVENUE SHARE BY SEGMENT, 2022 (%)
According to a new report published by Allied Market Research, titled, "Workflow Management Systems Market," The workflow management systems market was valued at $9.8 billion in 2022, and is estimated to reach $99.9 billion by 2032, growing at a CAGR of 26.2% from 2023 to 2032.
Growing emphasis on remote work environments across regions is one of the major driving factors for the workflow management systems market. With a substantial portion of the global workforce operating in non-traditional office environments, organizations are faced with heightened optimization risks. The presence of remote employees who gain access to corporate networks and sensitive information from different locations and devices leads to vulnerabilities that malicious individuals exploit. Thus, there is a growing demand for real-time identification, regular monitoring, and optimization capabilities provided by workflow management systems. These solutions enable organizations to safeguard remote access points, detect and mitigate threats aimed at remote workers, and ensure secure connectivity, making them essential in the current landscape of remote work.
Furthermore, the market is profoundly influenced by considerable expenses related to workflow management system solutions and services. Primarily, these expenses can serve as a deterrent for smaller and medium-sized enterprises (SMEs) with constrained budgets. SMEs may perceive workflow management system as a financial burden, leading to insufficient investment in cybersecurity measures and rendering them vulnerable to cyber threats. This will further reduce the negative impact caused by the high costs of workflow management system solutions & services.
Furthermore, the notable factors positively affecting the workflow management systems market include the rising adoption of advanced technologies across several industries and the rise of remote and distributed workforces propelling the global market growth. However, high implementation costs associated with workflow management systems and complexities in integrating workflow management systems with existing systems can hinder market growth. However, the rise in the implementation of cloud-based technologies offers lucrative market opportunities for market players.
The global workflow management systems market is segmented on the basis of component, enterprise size, deployment mode, industry, and region. On the basis of component, the market is segmented into software and services. On the basis of enterprise size, the market is segmented into large enterprises and small and medium-sized enterprises (SMEs). On the basis of deployment mode, the market is segmented into on-premise and cloud. On the basis of industry, the market is segmented into BFSI, retail, education, IT and telecom, healthcare transportation and others. Region-wise, it is analyzed across North America, Europe, Asia-Pacific, and LAMEA.
The market players operating in the global workflow management systems market. This report further outlines the current trends and key areas of investment. In addition, it includes Porter's five forces analysis to understand the competitive scenario of the industry and role of each stakeholder. The report features the strategies adopted by key market players to maintain their foothold in the market. Furthermore, it highlights the competitive landscape of key market players to increase their market share and sustain intense competition in the industry. The key players operating in the market include Appian Corporation, Bizagi Limited, IBM Corporation, Microsoft Corporation, Newgen Software Technologies Limited., Nintex Global Limited, Oracle Corporation, Pegasystems Inc., ServiceNow, Inc., Software AG and TIBCO Software Inc.
KEY BENEFITS FOR STAKEHOLDERS
- The study provides an in-depth analysis of the workflow management systems market forecast along with the current and future trends to explain the imminent investment pockets.
- Information about key drivers, restraints, and opportunities and their impact analysis on workflow management systems market trends is provided in the report.
- The Porter's five forces analysis illustrates the potency of the buyers and suppliers operating in the industry.
- The quantitative analysis of the workflow management systems market from 2022 to 2032 is provided to determine the market potential.
Additional benefits you will get with this purchase are:
- Quarterly Update and* (only available with a corporate license, on listed price)
- 5 additional Company Profile of client Choice pre- or Post-purchase, as a free update.
- Free Upcoming Version on the Purchase of Five and Enterprise User License.
- 16 analyst hours of support* (post-purchase, if you find additional data requirements upon review of the report, you may receive support amounting to 16 analyst hours to solve questions, and post-sale queries)
- 15% Free Customization* (in case the scope or segment of the report does not match your requirements, 15% is equivalent to 3 working days of free work, applicable once)
- Free data Pack on the Five and Enterprise User License. (Excel version of the report)
- Free Updated report if the report is 6-12 months old or older.
- 24-hour priority response*
- Free Industry updates and white papers.
Possible Customization with this report (with additional cost and timeline, please talk to the sales executive to know more)
- Investment Opportunities
- Market share analysis of players by products/segments
- Regulatory Guidelines
- Additional company profiles with specific to client's interest
- Additional country or region analysis- market size and forecast
- Market share analysis of players at global/region/country level
- SWOT Analysis
Key Market Segments
By Component
- Services
- Software
By Enterprise Size
- Large Enterprise
- SMEs
By Deployment Mode
- On-premise
- Cloud
By Industry
- BFSI
- Retail
- Education
- IT and telecom
- Healthcare
- Transportation
- Others
By Region
- North America
- U.S.
- Canada
- Europe
- UK
- Germany
- France
- Italy
- Spain
- Rest of Europe
- Asia-Pacific
- China
- Japan
- India
- Australia
- South Korea
- Rest of Asia-Pacific
- LAMEA
- Latin America
- Middle East
- Africa
Key Market Players:
- Appian Corporation
- IBM Corporation
- Microsoft Corporation
- Pegasystems Inc.
- ServiceNow, Inc.
- Nintex Global Limited
- Software AG
- Bizagi Limited
- Oracle Corporation
- TIBCO Software Inc.
- Newgen Software Technologies Limited.
TABLE OF CONTENTS
CHAPTER 1: INTRODUCTION
- 1.1. Report description
- 1.2. Key market segments
- 1.3. Key benefits to the stakeholders
- 1.4. Research methodology
- 1.4.1. Primary research
- 1.4.2. Secondary research
- 1.4.3. Analyst tools and models
CHAPTER 2: EXECUTIVE SUMMARY
- 2.1. CXO Perspective
CHAPTER 3: MARKET OVERVIEW
- 3.1. Market definition and scope
- 3.2. Key findings
- 3.2.1. Top impacting factors
- 3.2.2. Top investment pockets
- 3.3. Porter's five forces analysis
- 3.3.1. Low bargaining power of suppliers
- 3.3.2. Low threat of new entrants
- 3.3.3. Low threat of substitutes
- 3.3.4. Low intensity of rivalry
- 3.3.5. Low bargaining power of buyers
- 3.4. Market dynamics
- 3.4.1. Drivers
- 3.4.1.1. Rising adoption of advanced technologies across several industries
- 3.4.1.2. The rise of remote and distributed workforces
- 3.4.2. Restraints
- 3.4.2.1. High implementation costs associated with workflow management systems
- 3.4.2.2. Complexities in integrating workflow management systems with existing systems
- 3.4.3. Opportunities
- 3.4.3.1. Rise in implementation of cloud-based technologies
- 3.4.1. Drivers
CHAPTER 4: WORKFLOW MANAGEMENT SYSTEMS MARKET, BY COMPONENT
- 4.1. Overview
- 4.1.1. Market size and forecast
- 4.2. Software
- 4.2.1. Key market trends, growth factors and opportunities
- 4.2.2. Market size and forecast, by region
- 4.2.3. Market share analysis by country
- 4.3. Services
- 4.3.1. Key market trends, growth factors and opportunities
- 4.3.2. Market size and forecast, by region
- 4.3.3. Market share analysis by country
CHAPTER 5: WORKFLOW MANAGEMENT SYSTEMS MARKET, BY ENTERPRISE SIZE
- 5.1. Overview
- 5.1.1. Market size and forecast
- 5.2. Large Enterprise
- 5.2.1. Key market trends, growth factors and opportunities
- 5.2.2. Market size and forecast, by region
- 5.2.3. Market share analysis by country
- 5.3. SMEs
- 5.3.1. Key market trends, growth factors and opportunities
- 5.3.2. Market size and forecast, by region
- 5.3.3. Market share analysis by country
CHAPTER 6: WORKFLOW MANAGEMENT SYSTEMS MARKET, BY DEPLOYMENT MODE
- 6.1. Overview
- 6.1.1. Market size and forecast
- 6.2. On-premise
- 6.2.1. Key market trends, growth factors and opportunities
- 6.2.2. Market size and forecast, by region
- 6.2.3. Market share analysis by country
- 6.3. Cloud
- 6.3.1. Key market trends, growth factors and opportunities
- 6.3.2. Market size and forecast, by region
- 6.3.3. Market share analysis by country
CHAPTER 7: WORKFLOW MANAGEMENT SYSTEMS MARKET, BY INDUSTRY
- 7.1. Overview
- 7.1.1. Market size and forecast
- 7.2. BFSI
- 7.2.1. Key market trends, growth factors and opportunities
- 7.2.2. Market size and forecast, by region
- 7.2.3. Market share analysis by country
- 7.3. Retail
- 7.3.1. Key market trends, growth factors and opportunities
- 7.3.2. Market size and forecast, by region
- 7.3.3. Market share analysis by country
- 7.4. Education
- 7.4.1. Key market trends, growth factors and opportunities
- 7.4.2. Market size and forecast, by region
- 7.4.3. Market share analysis by country
- 7.5. IT and telecom
- 7.5.1. Key market trends, growth factors and opportunities
- 7.5.2. Market size and forecast, by region
- 7.5.3. Market share analysis by country
- 7.6. Healthcare
- 7.6.1. Key market trends, growth factors and opportunities
- 7.6.2. Market size and forecast, by region
- 7.6.3. Market share analysis by country
- 7.7. Transportation
- 7.7.1. Key market trends, growth factors and opportunities
- 7.7.2. Market size and forecast, by region
- 7.7.3. Market share analysis by country
- 7.8. Others
- 7.8.1. Key market trends, growth factors and opportunities
- 7.8.2. Market size and forecast, by region
- 7.8.3. Market share analysis by country
CHAPTER 8: WORKFLOW MANAGEMENT SYSTEMS MARKET, BY REGION
- 8.1. Overview
- 8.1.1. Market size and forecast By Region
- 8.2. North America
- 8.2.1. Key market trends, growth factors and opportunities
- 8.2.2. Market size and forecast, by Component
- 8.2.3. Market size and forecast, by Enterprise Size
- 8.2.4. Market size and forecast, by Deployment Mode
- 8.2.5. Market size and forecast, by Industry
- 8.2.6. Market size and forecast, by country
- 8.2.6.1. U.S.
- 8.2.6.1.1. Market size and forecast, by Component
- 8.2.6.1.2. Market size and forecast, by Enterprise Size
- 8.2.6.1.3. Market size and forecast, by Deployment Mode
- 8.2.6.1.4. Market size and forecast, by Industry
- 8.2.6.2. Canada
- 8.2.6.2.1. Market size and forecast, by Component
- 8.2.6.2.2. Market size and forecast, by Enterprise Size
- 8.2.6.2.3. Market size and forecast, by Deployment Mode
- 8.2.6.2.4. Market size and forecast, by Industry
- 8.3. Europe
- 8.3.1. Key market trends, growth factors and opportunities
- 8.3.2. Market size and forecast, by Component
- 8.3.3. Market size and forecast, by Enterprise Size
- 8.3.4. Market size and forecast, by Deployment Mode
- 8.3.5. Market size and forecast, by Industry
- 8.3.6. Market size and forecast, by country
- 8.3.6.1. UK
- 8.3.6.1.1. Market size and forecast, by Component
- 8.3.6.1.2. Market size and forecast, by Enterprise Size
- 8.3.6.1.3. Market size and forecast, by Deployment Mode
- 8.3.6.1.4. Market size and forecast, by Industry
- 8.3.6.2. Germany
- 8.3.6.2.1. Market size and forecast, by Component
- 8.3.6.2.2. Market size and forecast, by Enterprise Size
- 8.3.6.2.3. Market size and forecast, by Deployment Mode
- 8.3.6.2.4. Market size and forecast, by Industry
- 8.3.6.3. France
- 8.3.6.3.1. Market size and forecast, by Component
- 8.3.6.3.2. Market size and forecast, by Enterprise Size
- 8.3.6.3.3. Market size and forecast, by Deployment Mode
- 8.3.6.3.4. Market size and forecast, by Industry
- 8.3.6.4. Italy
- 8.3.6.4.1. Market size and forecast, by Component
- 8.3.6.4.2. Market size and forecast, by Enterprise Size
- 8.3.6.4.3. Market size and forecast, by Deployment Mode
- 8.3.6.4.4. Market size and forecast, by Industry
- 8.3.6.5. Spain
- 8.3.6.5.1. Market size and forecast, by Component
- 8.3.6.5.2. Market size and forecast, by Enterprise Size
- 8.3.6.5.3. Market size and forecast, by Deployment Mode
- 8.3.6.5.4. Market size and forecast, by Industry
- 8.3.6.6. Rest of Europe
- 8.3.6.6.1. Market size and forecast, by Component
- 8.3.6.6.2. Market size and forecast, by Enterprise Size
- 8.3.6.6.3. Market size and forecast, by Deployment Mode
- 8.3.6.6.4. Market size and forecast, by Industry
- 8.4. Asia-Pacific
- 8.4.1. Key market trends, growth factors and opportunities
- 8.4.2. Market size and forecast, by Component
- 8.4.3. Market size and forecast, by Enterprise Size
- 8.4.4. Market size and forecast, by Deployment Mode
- 8.4.5. Market size and forecast, by Industry
- 8.4.6. Market size and forecast, by country
- 8.4.6.1. China
- 8.4.6.1.1. Market size and forecast, by Component
- 8.4.6.1.2. Market size and forecast, by Enterprise Size
- 8.4.6.1.3. Market size and forecast, by Deployment Mode
- 8.4.6.1.4. Market size and forecast, by Industry
- 8.4.6.2. Japan
- 8.4.6.2.1. Market size and forecast, by Component
- 8.4.6.2.2. Market size and forecast, by Enterprise Size
- 8.4.6.2.3. Market size and forecast, by Deployment Mode
- 8.4.6.2.4. Market size and forecast, by Industry
- 8.4.6.3. India
- 8.4.6.3.1. Market size and forecast, by Component
- 8.4.6.3.2. Market size and forecast, by Enterprise Size
- 8.4.6.3.3. Market size and forecast, by Deployment Mode
- 8.4.6.3.4. Market size and forecast, by Industry
- 8.4.6.4. Australia
- 8.4.6.4.1. Market size and forecast, by Component
- 8.4.6.4.2. Market size and forecast, by Enterprise Size
- 8.4.6.4.3. Market size and forecast, by Deployment Mode
- 8.4.6.4.4. Market size and forecast, by Industry
- 8.4.6.5. South Korea
- 8.4.6.5.1. Market size and forecast, by Component
- 8.4.6.5.2. Market size and forecast, by Enterprise Size
- 8.4.6.5.3. Market size and forecast, by Deployment Mode
- 8.4.6.5.4. Market size and forecast, by Industry
- 8.4.6.6. Rest of Asia-Pacific
- 8.4.6.6.1. Market size and forecast, by Component
- 8.4.6.6.2. Market size and forecast, by Enterprise Size
- 8.4.6.6.3. Market size and forecast, by Deployment Mode
- 8.4.6.6.4. Market size and forecast, by Industry
- 8.5. LAMEA
- 8.5.1. Key market trends, growth factors and opportunities
- 8.5.2. Market size and forecast, by Component
- 8.5.3. Market size and forecast, by Enterprise Size
- 8.5.4. Market size and forecast, by Deployment Mode
- 8.5.5. Market size and forecast, by Industry
- 8.5.6. Market size and forecast, by country
- 8.5.6.1. Latin America
- 8.5.6.1.1. Market size and forecast, by Component
- 8.5.6.1.2. Market size and forecast, by Enterprise Size
- 8.5.6.1.3. Market size and forecast, by Deployment Mode
- 8.5.6.1.4. Market size and forecast, by Industry
- 8.5.6.2. Middle East
- 8.5.6.2.1. Market size and forecast, by Component
- 8.5.6.2.2. Market size and forecast, by Enterprise Size
- 8.5.6.2.3. Market size and forecast, by Deployment Mode
- 8.5.6.2.4. Market size and forecast, by Industry
- 8.5.6.3. Africa
- 8.5.6.3.1. Market size and forecast, by Component
- 8.5.6.3.2. Market size and forecast, by Enterprise Size
- 8.5.6.3.3. Market size and forecast, by Deployment Mode
- 8.5.6.3.4. Market size and forecast, by Industry
CHAPTER 9: COMPETITIVE LANDSCAPE
- 9.1. Introduction
- 9.2. Top winning strategies
- 9.3. Product mapping of top 10 player
- 9.4. Competitive dashboard
- 9.5. Competitive heatmap
- 9.6. Top player positioning, 2022
CHAPTER 10: COMPANY PROFILES
- 10.1. Appian Corporation
- 10.1.1. Company overview
- 10.1.2. Key executives
- 10.1.3. Company snapshot
- 10.1.4. Operating business segments
- 10.1.5. Product portfolio
- 10.1.6. Business performance
- 10.1.7. Key strategic moves and developments
- 10.2. Bizagi Limited
- 10.2.1. Company overview
- 10.2.2. Key executives
- 10.2.3. Company snapshot
- 10.2.4. Operating business segments
- 10.2.5. Product portfolio
- 10.2.6. Key strategic moves and developments
- 10.3. IBM Corporation
- 10.3.1. Company overview
- 10.3.2. Key executives
- 10.3.3. Company snapshot
- 10.3.4. Operating business segments
- 10.3.5. Product portfolio
- 10.3.6. Business performance
- 10.3.7. Key strategic moves and developments
- 10.4. Microsoft Corporation
- 10.4.1. Company overview
- 10.4.2. Key executives
- 10.4.3. Company snapshot
- 10.4.4. Operating business segments
- 10.4.5. Product portfolio
- 10.4.6. Business performance
- 10.4.7. Key strategic moves and developments
- 10.5. Newgen Software Technologies Limited.
- 10.5.1. Company overview
- 10.5.2. Key executives
- 10.5.3. Company snapshot
- 10.5.4. Operating business segments
- 10.5.5. Product portfolio
- 10.5.6. Business performance
- 10.5.7. Key strategic moves and developments
- 10.6. Nintex Global Limited
- 10.6.1. Company overview
- 10.6.2. Key executives
- 10.6.3. Company snapshot
- 10.6.4. Operating business segments
- 10.6.5. Product portfolio
- 10.6.6. Key strategic moves and developments
- 10.7. Oracle Corporation
- 10.7.1. Company overview
- 10.7.2. Key executives
- 10.7.3. Company snapshot
- 10.7.4. Operating business segments
- 10.7.5. Product portfolio
- 10.7.6. Business performance
- 10.7.7. Key strategic moves and developments
- 10.8. Pegasystems Inc.
- 10.8.1. Company overview
- 10.8.2. Key executives
- 10.8.3. Company snapshot
- 10.8.4. Operating business segments
- 10.8.5. Product portfolio
- 10.8.6. Business performance
- 10.8.7. Key strategic moves and developments
- 10.9. ServiceNow, Inc.
- 10.9.1. Company overview
- 10.9.2. Key executives
- 10.9.3. Company snapshot
- 10.9.4. Operating business segments
- 10.9.5. Product portfolio
- 10.9.6. Business performance
- 10.9.7. Key strategic moves and developments
- 10.10. Software AG
- 10.10.1. Company overview
- 10.10.2. Key executives
- 10.10.3. Company snapshot
- 10.10.4. Operating business segments
- 10.10.5. Product portfolio
- 10.10.6. Business performance
- 10.10.7. Key strategic moves and developments
- 10.11. TIBCO Software Inc.
- 10.11.1. Company overview
- 10.11.2. Key executives
- 10.11.3. Company snapshot
- 10.11.4. Operating business segments
- 10.11.5. Product portfolio