 |
市場調査レポート
商品コード
1365743
アスレジャー市場:男女別、製品タイプ別、流通チャネル別:世界の機会分析と産業予測、2023~2032年Athleisure Market By Gender (Male , Female ), By Product Type (Sneaker , Joggers , Leggings , Hoodies , Others ), By Distribution Channel (Offline , Online ): Global Opportunity Analysis and Industry Forecast, 2023-2032 |
||||||

| アスレジャー市場:男女別、製品タイプ別、流通チャネル別:世界の機会分析と産業予測、2023~2032年 |
|
出版日: 2023年08月01日
発行: Allied Market Research
ページ情報: 英文 300 Pages
納期: 2~3営業日
|
- 全表示
- 概要
- 図表
- 目次
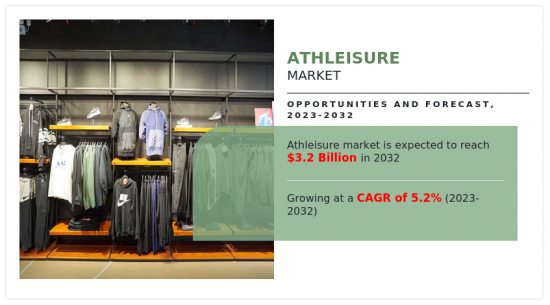
アスレジャー市場の2022年の市場規模は20億米ドルで、2032年には32億米ドルに達し、2023年から2032年までのCAGRは5.2%で成長すると推定されます。
このようなプログラムや活動に従事することの利点に関する消費者の知識の増加により、人々は様々な身体活動に積極的に取り組んでいます。このため、飲食物、衣料品、履物など、さまざまな健康関連商品の需要が高まっています。アクティブウェアやスポーツウェアのメーカーは、このような消費者動向を念頭に、魅力的な衣服デザインと組み合わせ、最終的にターゲット顧客のニーズを満たす製品の開発に戦略を練ってきました。顧客はこれらのアスレジャーウェアを快適だと感じています。
アスレジャーアパレルの質感、デザイン、外観、その他のファッション要素には、原材料の体系的な加工と設計が必要です。アスレジャーのアイテムは、ポリエステル、ナイロン、ポリプロピレン、スパンデックス、ネオプレンなど、数多くの素材を適切に設計し、組み合わせる必要があります。これと同様に、商品市場の変化、自然災害が原材料のサプライヤーに与える影響、世界経済の状況の変化、その他の変数が原材料の価格に大きな影響を与えます。価格が高いため、ほとんど売れないです。その結果、この製品の原材料価格の高さが市場全体の拡大を妨げています。
プレミアム化とは、生産者が顧客吸引力を高めるために、製品のより良い品質と独占性を強調するプロセスです。その動機は、高級品への嗜好と達成感を示したいという欲求にあります。一人当たりの富の増加により、消費者は高品質の商品を求めています。高価格のため、最高品質のアスレジャーウェアとフットウェアはプレミアムアイテムの下に位置づけられています。顧客はこの種の商品を使用する際、より高い快適満足度を示します。より高価な商品群を購入できる顧客は、こうした品質に惹かれます。その結果、市場の拡大が加速します。
目次
第1章 イントロダクション
第2章 エグゼクティブサマリー
第3章 市場概要
- 市場の定義と範囲
- 主な調査結果
- 影響要因
- 主な投資機会
- ポーターのファイブフォース分析
- 市場力学
- 促進要因
- 消費者のフィットネス活動への参加の増加
- ターゲット顧客の健康志向の高まり
- ミレニアル世代の増加
- 抑制要因
- 不安定な原材料コスト
- 偽造ブランドの入手可能性
- 機会
- プレミアム化動向は絶大な機会をもたらす
- さまざまな組織による販促活動とイニシアチブの増加
- 促進要因
第4章 アスレジャー市場:男女別
- 概要
- 男性
- 女性
第5章 アスレジャー市場:製品タイプ別
- 概要
- スニーカー
- ジョガー
- レギンス
- パーカー
- その他
第6章 アスレジャー市場:流通チャネル別
- 概要
- オフライン
- オンライン
第7章 アスレジャー市場:地域別
- 概要
- 北米
- 米国
- カナダ
- メキシコ
- 欧州
- 英国
- ドイツ
- フランス
- イタリア
- スペイン
- オランダ
- その他
- アジア太平洋
- 中国
- 日本
- インド
- 韓国
- オーストラリア
- その他
- ラテンアメリカ・中東・アフリカ
- ブラジル
- アルゼンチン
- サウジアラビア
- アラブ首長国連邦
- 南アフリカ
- その他
第8章 競争情勢
- イントロダクション
- 主要成功戦略
- 主要10企業の製品マッピング
- 競合ダッシュボード
- 競合ヒートマップ
- 主要企業のポジショニング、2022年
第9章 企業プロファイル
- Adidas AG
- ASICS Corporation
- Columbia Sportswear Company
- PVH Corp.
- Puma SE
- VF Corporation
- The Gap, Inc.
- Nike, Inc.
- Under Armour, Inc.
- lululemon athletica inc
LIST OF TABLES
- TABLE 01. GLOBAL ATHLEISURE MARKET, BY GENDER, 2022-2032 ($MILLION)
- TABLE 02. ATHLEISURE MARKET FOR MALE , BY REGION, 2022-2032 ($MILLION)
- TABLE 03. ATHLEISURE MARKET FOR FEMALE , BY REGION, 2022-2032 ($MILLION)
- TABLE 04. GLOBAL ATHLEISURE MARKET, BY PRODUCT TYPE, 2022-2032 ($MILLION)
- TABLE 05. ATHLEISURE MARKET FOR SNEAKER , BY REGION, 2022-2032 ($MILLION)
- TABLE 06. ATHLEISURE MARKET FOR JOGGERS , BY REGION, 2022-2032 ($MILLION)
- TABLE 07. ATHLEISURE MARKET FOR LEGGINGS , BY REGION, 2022-2032 ($MILLION)
- TABLE 08. ATHLEISURE MARKET FOR HOODIES , BY REGION, 2022-2032 ($MILLION)
- TABLE 09. ATHLEISURE MARKET FOR OTHERS , BY REGION, 2022-2032 ($MILLION)
- TABLE 10. GLOBAL ATHLEISURE MARKET, BY DISTRIBUTION CHANNEL, 2022-2032 ($MILLION)
- TABLE 11. ATHLEISURE MARKET FOR OFFLINE , BY REGION, 2022-2032 ($MILLION)
- TABLE 12. ATHLEISURE MARKET FOR ONLINE , BY REGION, 2022-2032 ($MILLION)
- TABLE 13. ATHLEISURE MARKET, BY REGION, 2022-2032 ($MILLION)
- TABLE 14. NORTH AMERICA ATHLEISURE MARKET, BY GENDER, 2022-2032 ($MILLION)
- TABLE 15. NORTH AMERICA ATHLEISURE MARKET, BY PRODUCT TYPE, 2022-2032 ($MILLION)
- TABLE 16. NORTH AMERICA ATHLEISURE MARKET, BY DISTRIBUTION CHANNEL, 2022-2032 ($MILLION)
- TABLE 17. NORTH AMERICA ATHLEISURE MARKET, BY COUNTRY, 2022-2032 ($MILLION)
- TABLE 18. U.S. ATHLEISURE MARKET, BY GENDER, 2022-2032 ($MILLION)
- TABLE 19. U.S. ATHLEISURE MARKET, BY PRODUCT TYPE, 2022-2032 ($MILLION)
- TABLE 20. U.S. ATHLEISURE MARKET, BY DISTRIBUTION CHANNEL, 2022-2032 ($MILLION)
- TABLE 21. CANADA ATHLEISURE MARKET, BY GENDER, 2022-2032 ($MILLION)
- TABLE 22. CANADA ATHLEISURE MARKET, BY PRODUCT TYPE, 2022-2032 ($MILLION)
- TABLE 23. CANADA ATHLEISURE MARKET, BY DISTRIBUTION CHANNEL, 2022-2032 ($MILLION)
- TABLE 24. MEXICO ATHLEISURE MARKET, BY GENDER, 2022-2032 ($MILLION)
- TABLE 25. MEXICO ATHLEISURE MARKET, BY PRODUCT TYPE, 2022-2032 ($MILLION)
- TABLE 26. MEXICO ATHLEISURE MARKET, BY DISTRIBUTION CHANNEL, 2022-2032 ($MILLION)
- TABLE 27. EUROPE ATHLEISURE MARKET, BY GENDER, 2022-2032 ($MILLION)
- TABLE 28. EUROPE ATHLEISURE MARKET, BY PRODUCT TYPE, 2022-2032 ($MILLION)
- TABLE 29. EUROPE ATHLEISURE MARKET, BY DISTRIBUTION CHANNEL, 2022-2032 ($MILLION)
- TABLE 30. EUROPE ATHLEISURE MARKET, BY COUNTRY, 2022-2032 ($MILLION)
- TABLE 31. UK ATHLEISURE MARKET, BY GENDER, 2022-2032 ($MILLION)
- TABLE 32. UK ATHLEISURE MARKET, BY PRODUCT TYPE, 2022-2032 ($MILLION)
- TABLE 33. UK ATHLEISURE MARKET, BY DISTRIBUTION CHANNEL, 2022-2032 ($MILLION)
- TABLE 34. GERMANY ATHLEISURE MARKET, BY GENDER, 2022-2032 ($MILLION)
- TABLE 35. GERMANY ATHLEISURE MARKET, BY PRODUCT TYPE, 2022-2032 ($MILLION)
- TABLE 36. GERMANY ATHLEISURE MARKET, BY DISTRIBUTION CHANNEL, 2022-2032 ($MILLION)
- TABLE 37. FRANCE ATHLEISURE MARKET, BY GENDER, 2022-2032 ($MILLION)
- TABLE 38. FRANCE ATHLEISURE MARKET, BY PRODUCT TYPE, 2022-2032 ($MILLION)
- TABLE 39. FRANCE ATHLEISURE MARKET, BY DISTRIBUTION CHANNEL, 2022-2032 ($MILLION)
- TABLE 40. ITALY ATHLEISURE MARKET, BY GENDER, 2022-2032 ($MILLION)
- TABLE 41. ITALY ATHLEISURE MARKET, BY PRODUCT TYPE, 2022-2032 ($MILLION)
- TABLE 42. ITALY ATHLEISURE MARKET, BY DISTRIBUTION CHANNEL, 2022-2032 ($MILLION)
- TABLE 43. SPAIN ATHLEISURE MARKET, BY GENDER, 2022-2032 ($MILLION)
- TABLE 44. SPAIN ATHLEISURE MARKET, BY PRODUCT TYPE, 2022-2032 ($MILLION)
- TABLE 45. SPAIN ATHLEISURE MARKET, BY DISTRIBUTION CHANNEL, 2022-2032 ($MILLION)
- TABLE 46. NETHERLANDS ATHLEISURE MARKET, BY GENDER, 2022-2032 ($MILLION)
- TABLE 47. NETHERLANDS ATHLEISURE MARKET, BY PRODUCT TYPE, 2022-2032 ($MILLION)
- TABLE 48. NETHERLANDS ATHLEISURE MARKET, BY DISTRIBUTION CHANNEL, 2022-2032 ($MILLION)
- TABLE 49. REST OF EUROPE ATHLEISURE MARKET, BY GENDER, 2022-2032 ($MILLION)
- TABLE 50. REST OF EUROPE ATHLEISURE MARKET, BY PRODUCT TYPE, 2022-2032 ($MILLION)
- TABLE 51. REST OF EUROPE ATHLEISURE MARKET, BY DISTRIBUTION CHANNEL, 2022-2032 ($MILLION)
- TABLE 52. ASIA-PACIFIC ATHLEISURE MARKET, BY GENDER, 2022-2032 ($MILLION)
- TABLE 53. ASIA-PACIFIC ATHLEISURE MARKET, BY PRODUCT TYPE, 2022-2032 ($MILLION)
- TABLE 54. ASIA-PACIFIC ATHLEISURE MARKET, BY DISTRIBUTION CHANNEL, 2022-2032 ($MILLION)
- TABLE 55. ASIA-PACIFIC ATHLEISURE MARKET, BY COUNTRY, 2022-2032 ($MILLION)
- TABLE 56. CHINA ATHLEISURE MARKET, BY GENDER, 2022-2032 ($MILLION)
- TABLE 57. CHINA ATHLEISURE MARKET, BY PRODUCT TYPE, 2022-2032 ($MILLION)
- TABLE 58. CHINA ATHLEISURE MARKET, BY DISTRIBUTION CHANNEL, 2022-2032 ($MILLION)
- TABLE 59. JAPAN ATHLEISURE MARKET, BY GENDER, 2022-2032 ($MILLION)
- TABLE 60. JAPAN ATHLEISURE MARKET, BY PRODUCT TYPE, 2022-2032 ($MILLION)
- TABLE 61. JAPAN ATHLEISURE MARKET, BY DISTRIBUTION CHANNEL, 2022-2032 ($MILLION)
- TABLE 62. INDIA ATHLEISURE MARKET, BY GENDER, 2022-2032 ($MILLION)
- TABLE 63. INDIA ATHLEISURE MARKET, BY PRODUCT TYPE, 2022-2032 ($MILLION)
- TABLE 64. INDIA ATHLEISURE MARKET, BY DISTRIBUTION CHANNEL, 2022-2032 ($MILLION)
- TABLE 65. SOUTH KOREA ATHLEISURE MARKET, BY GENDER, 2022-2032 ($MILLION)
- TABLE 66. SOUTH KOREA ATHLEISURE MARKET, BY PRODUCT TYPE, 2022-2032 ($MILLION)
- TABLE 67. SOUTH KOREA ATHLEISURE MARKET, BY DISTRIBUTION CHANNEL, 2022-2032 ($MILLION)
- TABLE 68. AUSTRALIA ATHLEISURE MARKET, BY GENDER, 2022-2032 ($MILLION)
- TABLE 69. AUSTRALIA ATHLEISURE MARKET, BY PRODUCT TYPE, 2022-2032 ($MILLION)
- TABLE 70. AUSTRALIA ATHLEISURE MARKET, BY DISTRIBUTION CHANNEL, 2022-2032 ($MILLION)
- TABLE 71. REST OF ASIA-PACIFIC ATHLEISURE MARKET, BY GENDER, 2022-2032 ($MILLION)
- TABLE 72. REST OF ASIA-PACIFIC ATHLEISURE MARKET, BY PRODUCT TYPE, 2022-2032 ($MILLION)
- TABLE 73. REST OF ASIA-PACIFIC ATHLEISURE MARKET, BY DISTRIBUTION CHANNEL, 2022-2032 ($MILLION)
- TABLE 74. LAMEA ATHLEISURE MARKET, BY GENDER, 2022-2032 ($MILLION)
- TABLE 75. LAMEA ATHLEISURE MARKET, BY PRODUCT TYPE, 2022-2032 ($MILLION)
- TABLE 76. LAMEA ATHLEISURE MARKET, BY DISTRIBUTION CHANNEL, 2022-2032 ($MILLION)
- TABLE 77. LAMEA ATHLEISURE MARKET, BY COUNTRY, 2022-2032 ($MILLION)
- TABLE 78. BRAZIL ATHLEISURE MARKET, BY GENDER, 2022-2032 ($MILLION)
- TABLE 79. BRAZIL ATHLEISURE MARKET, BY PRODUCT TYPE, 2022-2032 ($MILLION)
- TABLE 80. BRAZIL ATHLEISURE MARKET, BY DISTRIBUTION CHANNEL, 2022-2032 ($MILLION)
- TABLE 81. ARGENTINA ATHLEISURE MARKET, BY GENDER, 2022-2032 ($MILLION)
- TABLE 82. ARGENTINA ATHLEISURE MARKET, BY PRODUCT TYPE, 2022-2032 ($MILLION)
- TABLE 83. ARGENTINA ATHLEISURE MARKET, BY DISTRIBUTION CHANNEL, 2022-2032 ($MILLION)
- TABLE 84. SAUDI ARABIA ATHLEISURE MARKET, BY GENDER, 2022-2032 ($MILLION)
- TABLE 85. SAUDI ARABIA ATHLEISURE MARKET, BY PRODUCT TYPE, 2022-2032 ($MILLION)
- TABLE 86. SAUDI ARABIA ATHLEISURE MARKET, BY DISTRIBUTION CHANNEL, 2022-2032 ($MILLION)
- TABLE 87. UAE ATHLEISURE MARKET, BY GENDER, 2022-2032 ($MILLION)
- TABLE 88. UAE ATHLEISURE MARKET, BY PRODUCT TYPE, 2022-2032 ($MILLION)
- TABLE 89. UAE ATHLEISURE MARKET, BY DISTRIBUTION CHANNEL, 2022-2032 ($MILLION)
- TABLE 90. SOUTH AFRICA ATHLEISURE MARKET, BY GENDER, 2022-2032 ($MILLION)
- TABLE 91. SOUTH AFRICA ATHLEISURE MARKET, BY PRODUCT TYPE, 2022-2032 ($MILLION)
- TABLE 92. SOUTH AFRICA ATHLEISURE MARKET, BY DISTRIBUTION CHANNEL, 2022-2032 ($MILLION)
- TABLE 93. REST OF LAMEA ATHLEISURE MARKET, BY GENDER, 2022-2032 ($MILLION)
- TABLE 94. REST OF LAMEA ATHLEISURE MARKET, BY PRODUCT TYPE, 2022-2032 ($MILLION)
- TABLE 95. REST OF LAMEA ATHLEISURE MARKET, BY DISTRIBUTION CHANNEL, 2022-2032 ($MILLION)
- TABLE 96. ADIDAS AG: KEY EXECUTIVES
- TABLE 97. ADIDAS AG: COMPANY SNAPSHOT
- TABLE 98. ADIDAS AG: PRODUCT SEGMENTS
- TABLE 99. ADIDAS AG: PRODUCT PORTFOLIO
- TABLE 100. ADIDAS AG: KEY STRATERGIES
- TABLE 101. ASICS CORPORATION: KEY EXECUTIVES
- TABLE 102. ASICS CORPORATION: COMPANY SNAPSHOT
- TABLE 103. ASICS CORPORATION: PRODUCT SEGMENTS
- TABLE 104. ASICS CORPORATION: PRODUCT PORTFOLIO
- TABLE 105. ASICS CORPORATION: KEY STRATERGIES
- TABLE 106. COLUMBIA SPORTSWEAR COMPANY: KEY EXECUTIVES
- TABLE 107. COLUMBIA SPORTSWEAR COMPANY: COMPANY SNAPSHOT
- TABLE 108. COLUMBIA SPORTSWEAR COMPANY: PRODUCT SEGMENTS
- TABLE 109. COLUMBIA SPORTSWEAR COMPANY: PRODUCT PORTFOLIO
- TABLE 110. COLUMBIA SPORTSWEAR COMPANY: KEY STRATERGIES
- TABLE 111. PVH CORP.: KEY EXECUTIVES
- TABLE 112. PVH CORP.: COMPANY SNAPSHOT
- TABLE 113. PVH CORP.: PRODUCT SEGMENTS
- TABLE 114. PVH CORP.: PRODUCT PORTFOLIO
- TABLE 115. PUMA SE: KEY EXECUTIVES
- TABLE 116. PUMA SE: COMPANY SNAPSHOT
- TABLE 117. PUMA SE: PRODUCT SEGMENTS
- TABLE 118. PUMA SE: PRODUCT PORTFOLIO
- TABLE 119. PUMA SE: KEY STRATERGIES
- TABLE 120. VF CORPORATION: KEY EXECUTIVES
- TABLE 121. VF CORPORATION: COMPANY SNAPSHOT
- TABLE 122. VF CORPORATION: PRODUCT SEGMENTS
- TABLE 123. VF CORPORATION: PRODUCT PORTFOLIO
- TABLE 124. VF CORPORATION: KEY STRATERGIES
- TABLE 125. THE GAP, INC.: KEY EXECUTIVES
- TABLE 126. THE GAP, INC.: COMPANY SNAPSHOT
- TABLE 127. THE GAP, INC.: PRODUCT SEGMENTS
- TABLE 128. THE GAP, INC.: PRODUCT PORTFOLIO
- TABLE 129. THE GAP, INC.: KEY STRATERGIES
- TABLE 130. NIKE, INC.: KEY EXECUTIVES
- TABLE 131. NIKE, INC.: COMPANY SNAPSHOT
- TABLE 132. NIKE, INC.: PRODUCT SEGMENTS
- TABLE 133. NIKE, INC.: PRODUCT PORTFOLIO
- TABLE 134. NIKE, INC.: KEY STRATERGIES
- TABLE 135. UNDER ARMOUR, INC.: KEY EXECUTIVES
- TABLE 136. UNDER ARMOUR, INC.: COMPANY SNAPSHOT
- TABLE 137. UNDER ARMOUR, INC.: PRODUCT SEGMENTS
- TABLE 138. UNDER ARMOUR, INC.: PRODUCT PORTFOLIO
- TABLE 139. UNDER ARMOUR, INC.: KEY STRATERGIES
- TABLE 140. LULULEMON ATHLETICA INC: KEY EXECUTIVES
- TABLE 141. LULULEMON ATHLETICA INC: COMPANY SNAPSHOT
- TABLE 142. LULULEMON ATHLETICA INC: PRODUCT SEGMENTS
- TABLE 143. LULULEMON ATHLETICA INC: PRODUCT PORTFOLIO
- TABLE 144. LULULEMON ATHLETICA INC: KEY STRATERGIES
LIST OF FIGURES
- FIGURE 01. ATHLEISURE MARKET, 2022-2032
- FIGURE 02. SEGMENTATION OF ATHLEISURE MARKET,2022-2032
- FIGURE 03. TOP INVESTMENT POCKETS IN ATHLEISURE MARKET (2023-2032)
- FIGURE 04. LOW INTENSITY OF RIVALRY
- FIGURE 05. LOW BARGAINING POWER OF SUPPLIERS
- FIGURE 06. LOW THREAT OF NEW ENTRANTS
- FIGURE 07. LOW THREAT OF SUBSTITUTES
- FIGURE 08. LOW BARGAINING POWER OF BUYERS
- FIGURE 09. GLOBAL ATHLEISURE MARKET:DRIVERS, RESTRAINTS AND OPPORTUNITIES
- FIGURE 10. ATHLEISURE MARKET, BY GENDER, 2022 AND 2032(%)
- FIGURE 11. COMPARATIVE SHARE ANALYSIS OF ATHLEISURE MARKET FOR MALE , BY COUNTRY 2022 AND 2032(%)
- FIGURE 12. COMPARATIVE SHARE ANALYSIS OF ATHLEISURE MARKET FOR FEMALE , BY COUNTRY 2022 AND 2032(%)
- FIGURE 13. ATHLEISURE MARKET, BY PRODUCT TYPE, 2022 AND 2032(%)
- FIGURE 14. COMPARATIVE SHARE ANALYSIS OF ATHLEISURE MARKET FOR SNEAKER , BY COUNTRY 2022 AND 2032(%)
- FIGURE 15. COMPARATIVE SHARE ANALYSIS OF ATHLEISURE MARKET FOR JOGGERS , BY COUNTRY 2022 AND 2032(%)
- FIGURE 16. COMPARATIVE SHARE ANALYSIS OF ATHLEISURE MARKET FOR LEGGINGS , BY COUNTRY 2022 AND 2032(%)
- FIGURE 17. COMPARATIVE SHARE ANALYSIS OF ATHLEISURE MARKET FOR HOODIES , BY COUNTRY 2022 AND 2032(%)
- FIGURE 18. COMPARATIVE SHARE ANALYSIS OF ATHLEISURE MARKET FOR OTHERS , BY COUNTRY 2022 AND 2032(%)
- FIGURE 19. ATHLEISURE MARKET, BY DISTRIBUTION CHANNEL, 2022 AND 2032(%)
- FIGURE 20. COMPARATIVE SHARE ANALYSIS OF ATHLEISURE MARKET FOR OFFLINE , BY COUNTRY 2022 AND 2032(%)
- FIGURE 21. COMPARATIVE SHARE ANALYSIS OF ATHLEISURE MARKET FOR ONLINE , BY COUNTRY 2022 AND 2032(%)
- FIGURE 22. ATHLEISURE MARKET BY REGION, 2022 AND 2032(%)
- FIGURE 23. U.S. ATHLEISURE MARKET, 2022-2032 ($MILLION)
- FIGURE 24. CANADA ATHLEISURE MARKET, 2022-2032 ($MILLION)
- FIGURE 25. MEXICO ATHLEISURE MARKET, 2022-2032 ($MILLION)
- FIGURE 26. UK ATHLEISURE MARKET, 2022-2032 ($MILLION)
- FIGURE 27. GERMANY ATHLEISURE MARKET, 2022-2032 ($MILLION)
- FIGURE 28. FRANCE ATHLEISURE MARKET, 2022-2032 ($MILLION)
- FIGURE 29. ITALY ATHLEISURE MARKET, 2022-2032 ($MILLION)
- FIGURE 30. SPAIN ATHLEISURE MARKET, 2022-2032 ($MILLION)
- FIGURE 31. NETHERLANDS ATHLEISURE MARKET, 2022-2032 ($MILLION)
- FIGURE 32. REST OF EUROPE ATHLEISURE MARKET, 2022-2032 ($MILLION)
- FIGURE 33. CHINA ATHLEISURE MARKET, 2022-2032 ($MILLION)
- FIGURE 34. JAPAN ATHLEISURE MARKET, 2022-2032 ($MILLION)
- FIGURE 35. INDIA ATHLEISURE MARKET, 2022-2032 ($MILLION)
- FIGURE 36. SOUTH KOREA ATHLEISURE MARKET, 2022-2032 ($MILLION)
- FIGURE 37. AUSTRALIA ATHLEISURE MARKET, 2022-2032 ($MILLION)
- FIGURE 38. REST OF ASIA-PACIFIC ATHLEISURE MARKET, 2022-2032 ($MILLION)
- FIGURE 39. BRAZIL ATHLEISURE MARKET, 2022-2032 ($MILLION)
- FIGURE 40. ARGENTINA ATHLEISURE MARKET, 2022-2032 ($MILLION)
- FIGURE 41. SAUDI ARABIA ATHLEISURE MARKET, 2022-2032 ($MILLION)
- FIGURE 42. UAE ATHLEISURE MARKET, 2022-2032 ($MILLION)
- FIGURE 43. SOUTH AFRICA ATHLEISURE MARKET, 2022-2032 ($MILLION)
- FIGURE 44. REST OF LAMEA ATHLEISURE MARKET, 2022-2032 ($MILLION)
- FIGURE 45. TOP WINNING STRATEGIES, BY YEAR (2020-2023)
- FIGURE 46. TOP WINNING STRATEGIES, BY DEVELOPMENT (2020-2023)
- FIGURE 47. TOP WINNING STRATEGIES, BY COMPANY (2020-2023)
- FIGURE 48. PRODUCT MAPPING OF TOP 10 PLAYERS
- FIGURE 49. COMPETITIVE DASHBOARD
- FIGURE 50. COMPETITIVE HEATMAP: ATHLEISURE MARKET
- FIGURE 51. TOP PLAYER POSITIONING, 2022
- FIGURE 52. ADIDAS AG: NET SALES, 2020-2022 ($MILLION)
- FIGURE 53. ADIDAS AG: RESEARCH & DEVELOPMENT EXPENDITURE, 2020-2022 ($MILLION)
- FIGURE 54. ADIDAS AG: REVENUE SHARE BY SEGMENT, 2022 (%)
- FIGURE 55. ADIDAS AG: REVENUE SHARE BY REGION, 2022 (%)
- FIGURE 56. ASICS CORPORATION: NET SALES, 2020-2022 ($MILLION)
- FIGURE 57. ASICS CORPORATION: RESEARCH & DEVELOPMENT EXPENDITURE, 2020-2022 ($MILLION)
- FIGURE 58. ASICS CORPORATION: REVENUE SHARE BY SEGMENT, 2022 (%)
- FIGURE 59. COLUMBIA SPORTSWEAR COMPANY: NET SALES, 2020-2022 ($MILLION)
- FIGURE 60. COLUMBIA SPORTSWEAR COMPANY: REVENUE SHARE BY SEGMENT, 2022 (%)
- FIGURE 61. PVH CORP.: NET SALES, 2020-2022 ($MILLION)
- FIGURE 62. PVH CORP.: REVENUE SHARE BY SEGMENT, 2022 (%)
- FIGURE 63. PVH CORP.: REVENUE SHARE BY REGION, 2022 (%)
- FIGURE 64. PUMA SE: NET SALES, 2020-2022 ($MILLION)
- FIGURE 65. PUMA SE: RESEARCH & DEVELOPMENT EXPENDITURE, 2020-2022 ($MILLION)
- FIGURE 66. PUMA SE: REVENUE SHARE BY SEGMENT, 2022 (%)
- FIGURE 67. VF CORPORATION: NET REVENUE, 2020-2022 ($MILLION)
- FIGURE 68. VF CORPORATION: REVENUE SHARE BY SEGMENT, 2022 (%)
- FIGURE 69. VF CORPORATION: REVENUE SHARE BY REGION, 2022 (%)
- FIGURE 70. THE GAP, INC.: NET SALES, 2020-2022 ($MILLION)
- FIGURE 71. THE GAP, INC.: RESEARCH & DEVELOPMENT EXPENDITURE, 2020-2022 ($MILLION)
- FIGURE 72. THE GAP, INC.: REVENUE SHARE BY REGION, 2022 (%)
- FIGURE 73. NIKE, INC.: NET REVENUE, 2020-2022 ($MILLION)
- FIGURE 74. NIKE, INC.: RESEARCH & DEVELOPMENT EXPENDITURE, 2020-2022 ($MILLION)
- FIGURE 75. NIKE, INC.: REVENUE SHARE BY SEGMENT, 2022 (%)
- FIGURE 76. UNDER ARMOUR, INC.: NET REVENUE, 2020-2022 ($MILLION)
- FIGURE 77. UNDER ARMOUR, INC.: REVENUE SHARE BY SEGMENT, 2022 (%)
- FIGURE 78. LULULEMON ATHLETICA INC: NET SALES, 2020-2022 ($MILLION)
- FIGURE 79. LULULEMON ATHLETICA INC: REVENUE SHARE BY SEGMENT, 2022 (%)
- FIGURE 80. LULULEMON ATHLETICA INC: REVENUE SHARE BY REGION, 2022 (%)
According to a new report published by Allied Market Research, titled, "Athleisure Market," The athleisure market was valued at $2 billion in 2022, and is estimated to reach $3.2 billion by 2032, growing at a CAGR of 5.2% from 2023 to 2032.
Due to increased consumer knowledge of the advantages of engaging in such programs or activities, people have been actively engaging in a variety of physical activities. This has increased demand for a range of health-related goods, whether they be food and drink, clothing, or footwear. Active wear and sports clothing makers have been strategizing on developing products that combine with the attractive garment design, which ultimately meets the needs of target clients, taking this consumer trend into mind. Customers so find these athleisure clothes comfy.
Athleisure apparel's texture, design, appearance, and other fashion elements require the systematic processing and designing of raw materials. Athleisure items require the right designing and combining of numerous fabrics, including polyester, nylon, polypropylene, spandex, neoprene, and others. Similar to this, changes in the commodities market, the impact of natural disasters on the suppliers of raw materials, shifts in the state of the world's economies, and other variables are some of the major influences on the price of raw materials. Due to the high price of these goods, there are little sales. As a result, this product's high raw material prices hinder the expansion of the market as a whole.
Premiumization is the process through which producers highlight a product's better quality and exclusivity in order to increase customer attractiveness. It is motivated by a taste for premium goods and a desire to show achievement. Due to the increase in per capita wealth, consumers want high-quality goods. Due to their high price, top quality athleisure clothing and footwear are featured under premium items. Customers express greater levels of comfort satisfaction while using these types of items. Customers who can afford the more expensive product range are drawn to such qualities. In turn, this accelerates market expansion.
The athleisure market is divided by gender, product type, distribution channel, and region. By gender, the market is divided into male and female. By product type, the market is divided into sneaker, joggers, leggings, hoodies, and others. According to the distribution channel, the market is divided into offline and online. By region, the market is divided into North America (the U.S., Canada, and Mexico), Europe (UK, Germany, France, Italy, Spain, Netherlands, Rest of Europe), Asia-Pacific (China, Japan, India, South Korea, Australia, and rest of Asia-Pacific), and LAMEA (Brazil, Argentina, Saudi Arabia, United Arab Emirates, South Africa, and the Rest of LAMEA).
Some of the Major players analyzed in this report are: Adidas AG, ASICS Corporation, Columbia Sportswear Company, PVH Corp., Puma SE, VF Corporation, The Gap, Inc., Nike, Inc., Under Armour, Inc., and Lululemon Athletica Inc.
Key Benefits For Stakeholders
- This report provides a quantitative analysis of the market segments, current trends, estimations, and dynamics of the athleisure market analysis from 2022 to 2032 to identify the prevailing athleisure market opportunities.
- The market research is offered along with information related to key drivers, restraints, and opportunities.
- Porter's five forces analysis highlights the potency of buyers and suppliers to enable stakeholders make profit-oriented business decisions and strengthen their supplier-buyer network.
- In-depth analysis of the athleisure market segmentation assists to determine the prevailing market opportunities.
- Major countries in each region are mapped according to their revenue contribution to the global market.
- Market player positioning facilitates benchmarking and provides a clear understanding of the present position of the market players.
- The report includes the analysis of the regional as well as global athleisure market trends, key players, market segments, application areas, and market growth strategies.
Additional benefits you will get with this purchase are:
- Quarterly Update and* (only available with a corporate license, on listed price)
- 5 additional Company Profile of client Choice pre- or Post-purchase, as a free update.
- Free Upcoming Version on the Purchase of Five and Enterprise User License.
- 16 analyst hours of support* (post-purchase, if you find additional data requirements upon review of the report, you may receive support amounting to 16 analyst hours to solve questions, and post-sale queries)
- 15% Free Customization* (in case the scope or segment of the report does not match your requirements, 20% is equivalent to 3 working days of free work, applicable once)
- Free data Pack on the Five and Enterprise User License. (Excel version of the report)
- Free Updated report if the report is 6-12 months old or older.
- 24-hour priority response*
- Free Industry updates and white papers.
Possible Customization with this report (with additional cost and timeline talk to the sales executive to know more)
- Analysis of raw material in a product (by %)
- Average Consumer Expenditure
- Pain Point Analysis
- Historic market data
Key Market Segments
By Gender
- Male
- Female
By Product Type
- Sneaker
- Joggers
- Leggings
- Hoodies
- Others
By Distribution Channel
- Offline
- Online
By Region
- North America
- U.S.
- Canada
- Mexico
- Europe
- UK
- Germany
- France
- Italy
- Spain
- Netherlands
- Rest of Europe
- Asia-Pacific
- China
- Japan
- India
- South Korea
- Australia
- Rest of Asia-Pacific
- LAMEA
- Brazil
- Argentina
- Saudi Arabia
- UAE
- South Africa
- Rest of LAMEA
Key Market Players:
- Puma SE
- ASICS Corporation
- lululemon athletica inc
- Under Armour, Inc.
- Adidas AG
- Columbia Sportswear Company
- PVH Corp.
- VF Corporation
- Nike, Inc.
- The Gap, Inc.
TABLE OF CONTENTS
CHAPTER 1: INTRODUCTION
- 1.1. Report description
- 1.2. Key market segments
- 1.3. Key benefits to the stakeholders
- 1.4. Research Methodology
- 1.4.1. Primary research
- 1.4.2. Secondary research
- 1.4.3. Analyst tools and models
CHAPTER 2: EXECUTIVE SUMMARY
- 2.1. CXO Perspective
CHAPTER 3: MARKET OVERVIEW
- 3.1. Market definition and scope
- 3.2. Key findings
- 3.2.1. Top impacting factors
- 3.2.2. Top investment pockets
- 3.3. Porter's five forces analysis
- 3.3.1. Low intensity of rivalry
- 3.3.2. Low bargaining power of suppliers
- 3.3.3. Low threat of new entrants
- 3.3.4. Low threat of substitutes
- 3.3.5. Low bargaining power of buyers
- 3.4. Market dynamics
- 3.4.1. Drivers
- 3.4.1.1. Increase in participation of consumers in physical fitness activities
- 3.4.1.2. Rise in health and wellness trend among the target customers
- 3.4.1.3. Rise in number of millennials
- 3.4.2. Restraints
- 3.4.2.1. Volatile cost of raw materials
- 3.4.2.2. Availability of counterfeit brands
- 3.4.3. Opportunities
- 3.4.3.1. Premiumization trend provide immense opportunity
- 3.4.3.2. Rise in promotional activities & initiatives by various organizations
- 3.4.1. Drivers
CHAPTER 4: ATHLEISURE MARKET, BY GENDER
- 4.1. Overview
- 4.1.1. Market size and forecast
- 4.2. Male
- 4.2.1. Key market trends, growth factors and opportunities
- 4.2.2. Market size and forecast, by region
- 4.2.3. Market share analysis by country
- 4.3. Female
- 4.3.1. Key market trends, growth factors and opportunities
- 4.3.2. Market size and forecast, by region
- 4.3.3. Market share analysis by country
CHAPTER 5: ATHLEISURE MARKET, BY PRODUCT TYPE
- 5.1. Overview
- 5.1.1. Market size and forecast
- 5.2. Sneaker
- 5.2.1. Key market trends, growth factors and opportunities
- 5.2.2. Market size and forecast, by region
- 5.2.3. Market share analysis by country
- 5.3. Joggers
- 5.3.1. Key market trends, growth factors and opportunities
- 5.3.2. Market size and forecast, by region
- 5.3.3. Market share analysis by country
- 5.4. Leggings
- 5.4.1. Key market trends, growth factors and opportunities
- 5.4.2. Market size and forecast, by region
- 5.4.3. Market share analysis by country
- 5.5. Hoodies
- 5.5.1. Key market trends, growth factors and opportunities
- 5.5.2. Market size and forecast, by region
- 5.5.3. Market share analysis by country
- 5.6. Others
- 5.6.1. Key market trends, growth factors and opportunities
- 5.6.2. Market size and forecast, by region
- 5.6.3. Market share analysis by country
CHAPTER 6: ATHLEISURE MARKET, BY DISTRIBUTION CHANNEL
- 6.1. Overview
- 6.1.1. Market size and forecast
- 6.2. Offline
- 6.2.1. Key market trends, growth factors and opportunities
- 6.2.2. Market size and forecast, by region
- 6.2.3. Market share analysis by country
- 6.3. Online
- 6.3.1. Key market trends, growth factors and opportunities
- 6.3.2. Market size and forecast, by region
- 6.3.3. Market share analysis by country
CHAPTER 7: ATHLEISURE MARKET, BY REGION
- 7.1. Overview
- 7.1.1. Market size and forecast By Region
- 7.2. North America
- 7.2.1. Key market trends, growth factors and opportunities
- 7.2.2. Market size and forecast, by Gender
- 7.2.3. Market size and forecast, by Product Type
- 7.2.4. Market size and forecast, by Distribution Channel
- 7.2.5. Market size and forecast, by country
- 7.2.5.1. U.S.
- 7.2.5.1.1. Market size and forecast, by Gender
- 7.2.5.1.2. Market size and forecast, by Product Type
- 7.2.5.1.3. Market size and forecast, by Distribution Channel
- 7.2.5.2. Canada
- 7.2.5.2.1. Market size and forecast, by Gender
- 7.2.5.2.2. Market size and forecast, by Product Type
- 7.2.5.2.3. Market size and forecast, by Distribution Channel
- 7.2.5.3. Mexico
- 7.2.5.3.1. Market size and forecast, by Gender
- 7.2.5.3.2. Market size and forecast, by Product Type
- 7.2.5.3.3. Market size and forecast, by Distribution Channel
- 7.3. Europe
- 7.3.1. Key market trends, growth factors and opportunities
- 7.3.2. Market size and forecast, by Gender
- 7.3.3. Market size and forecast, by Product Type
- 7.3.4. Market size and forecast, by Distribution Channel
- 7.3.5. Market size and forecast, by country
- 7.3.5.1. UK
- 7.3.5.1.1. Market size and forecast, by Gender
- 7.3.5.1.2. Market size and forecast, by Product Type
- 7.3.5.1.3. Market size and forecast, by Distribution Channel
- 7.3.5.2. Germany
- 7.3.5.2.1. Market size and forecast, by Gender
- 7.3.5.2.2. Market size and forecast, by Product Type
- 7.3.5.2.3. Market size and forecast, by Distribution Channel
- 7.3.5.3. France
- 7.3.5.3.1. Market size and forecast, by Gender
- 7.3.5.3.2. Market size and forecast, by Product Type
- 7.3.5.3.3. Market size and forecast, by Distribution Channel
- 7.3.5.4. Italy
- 7.3.5.4.1. Market size and forecast, by Gender
- 7.3.5.4.2. Market size and forecast, by Product Type
- 7.3.5.4.3. Market size and forecast, by Distribution Channel
- 7.3.5.5. Spain
- 7.3.5.5.1. Market size and forecast, by Gender
- 7.3.5.5.2. Market size and forecast, by Product Type
- 7.3.5.5.3. Market size and forecast, by Distribution Channel
- 7.3.5.6. Netherlands
- 7.3.5.6.1. Market size and forecast, by Gender
- 7.3.5.6.2. Market size and forecast, by Product Type
- 7.3.5.6.3. Market size and forecast, by Distribution Channel
- 7.3.5.7. Rest of Europe
- 7.3.5.7.1. Market size and forecast, by Gender
- 7.3.5.7.2. Market size and forecast, by Product Type
- 7.3.5.7.3. Market size and forecast, by Distribution Channel
- 7.4. Asia-Pacific
- 7.4.1. Key market trends, growth factors and opportunities
- 7.4.2. Market size and forecast, by Gender
- 7.4.3. Market size and forecast, by Product Type
- 7.4.4. Market size and forecast, by Distribution Channel
- 7.4.5. Market size and forecast, by country
- 7.4.5.1. China
- 7.4.5.1.1. Market size and forecast, by Gender
- 7.4.5.1.2. Market size and forecast, by Product Type
- 7.4.5.1.3. Market size and forecast, by Distribution Channel
- 7.4.5.2. Japan
- 7.4.5.2.1. Market size and forecast, by Gender
- 7.4.5.2.2. Market size and forecast, by Product Type
- 7.4.5.2.3. Market size and forecast, by Distribution Channel
- 7.4.5.3. India
- 7.4.5.3.1. Market size and forecast, by Gender
- 7.4.5.3.2. Market size and forecast, by Product Type
- 7.4.5.3.3. Market size and forecast, by Distribution Channel
- 7.4.5.4. South Korea
- 7.4.5.4.1. Market size and forecast, by Gender
- 7.4.5.4.2. Market size and forecast, by Product Type
- 7.4.5.4.3. Market size and forecast, by Distribution Channel
- 7.4.5.5. Australia
- 7.4.5.5.1. Market size and forecast, by Gender
- 7.4.5.5.2. Market size and forecast, by Product Type
- 7.4.5.5.3. Market size and forecast, by Distribution Channel
- 7.4.5.6. Rest of Asia-Pacific
- 7.4.5.6.1. Market size and forecast, by Gender
- 7.4.5.6.2. Market size and forecast, by Product Type
- 7.4.5.6.3. Market size and forecast, by Distribution Channel
- 7.5. LAMEA
- 7.5.1. Key market trends, growth factors and opportunities
- 7.5.2. Market size and forecast, by Gender
- 7.5.3. Market size and forecast, by Product Type
- 7.5.4. Market size and forecast, by Distribution Channel
- 7.5.5. Market size and forecast, by country
- 7.5.5.1. Brazil
- 7.5.5.1.1. Market size and forecast, by Gender
- 7.5.5.1.2. Market size and forecast, by Product Type
- 7.5.5.1.3. Market size and forecast, by Distribution Channel
- 7.5.5.2. Argentina
- 7.5.5.2.1. Market size and forecast, by Gender
- 7.5.5.2.2. Market size and forecast, by Product Type
- 7.5.5.2.3. Market size and forecast, by Distribution Channel
- 7.5.5.3. Saudi Arabia
- 7.5.5.3.1. Market size and forecast, by Gender
- 7.5.5.3.2. Market size and forecast, by Product Type
- 7.5.5.3.3. Market size and forecast, by Distribution Channel
- 7.5.5.4. UAE
- 7.5.5.4.1. Market size and forecast, by Gender
- 7.5.5.4.2. Market size and forecast, by Product Type
- 7.5.5.4.3. Market size and forecast, by Distribution Channel
- 7.5.5.5. South Africa
- 7.5.5.5.1. Market size and forecast, by Gender
- 7.5.5.5.2. Market size and forecast, by Product Type
- 7.5.5.5.3. Market size and forecast, by Distribution Channel
- 7.5.5.6. Rest of LAMEA
- 7.5.5.6.1. Market size and forecast, by Gender
- 7.5.5.6.2. Market size and forecast, by Product Type
- 7.5.5.6.3. Market size and forecast, by Distribution Channel
CHAPTER 8: COMPETITIVE LANDSCAPE
- 8.1. Introduction
- 8.2. Top winning strategies
- 8.3. Product Mapping of Top 10 Player
- 8.4. Competitive Dashboard
- 8.5. Competitive Heatmap
- 8.6. Top player positioning, 2022
CHAPTER 9: COMPANY PROFILES
- 9.1. Adidas AG
- 9.1.1. Company overview
- 9.1.2. Key Executives
- 9.1.3. Company snapshot
- 9.1.4. Operating business segments
- 9.1.5. Product portfolio
- 9.1.6. Business performance
- 9.1.7. Key strategic moves and developments
- 9.2. ASICS Corporation
- 9.2.1. Company overview
- 9.2.2. Key Executives
- 9.2.3. Company snapshot
- 9.2.4. Operating business segments
- 9.2.5. Product portfolio
- 9.2.6. Business performance
- 9.2.7. Key strategic moves and developments
- 9.3. Columbia Sportswear Company
- 9.3.1. Company overview
- 9.3.2. Key Executives
- 9.3.3. Company snapshot
- 9.3.4. Operating business segments
- 9.3.5. Product portfolio
- 9.3.6. Business performance
- 9.3.7. Key strategic moves and developments
- 9.4. PVH Corp.
- 9.4.1. Company overview
- 9.4.2. Key Executives
- 9.4.3. Company snapshot
- 9.4.4. Operating business segments
- 9.4.5. Product portfolio
- 9.4.6. Business performance
- 9.5. Puma SE
- 9.5.1. Company overview
- 9.5.2. Key Executives
- 9.5.3. Company snapshot
- 9.5.4. Operating business segments
- 9.5.5. Product portfolio
- 9.5.6. Business performance
- 9.5.7. Key strategic moves and developments
- 9.6. VF Corporation
- 9.6.1. Company overview
- 9.6.2. Key Executives
- 9.6.3. Company snapshot
- 9.6.4. Operating business segments
- 9.6.5. Product portfolio
- 9.6.6. Business performance
- 9.6.7. Key strategic moves and developments
- 9.7. The Gap, Inc.
- 9.7.1. Company overview
- 9.7.2. Key Executives
- 9.7.3. Company snapshot
- 9.7.4. Operating business segments
- 9.7.5. Product portfolio
- 9.7.6. Business performance
- 9.7.7. Key strategic moves and developments
- 9.8. Nike, Inc.
- 9.8.1. Company overview
- 9.8.2. Key Executives
- 9.8.3. Company snapshot
- 9.8.4. Operating business segments
- 9.8.5. Product portfolio
- 9.8.6. Business performance
- 9.8.7. Key strategic moves and developments
- 9.9. Under Armour, Inc.
- 9.9.1. Company overview
- 9.9.2. Key Executives
- 9.9.3. Company snapshot
- 9.9.4. Operating business segments
- 9.9.5. Product portfolio
- 9.9.6. Business performance
- 9.9.7. Key strategic moves and developments
- 9.10. lululemon athletica inc
- 9.10.1. Company overview
- 9.10.2. Key Executives
- 9.10.3. Company snapshot
- 9.10.4. Operating business segments
- 9.10.5. Product portfolio
- 9.10.6. Business performance
- 9.10.7. Key strategic moves and developments