
|
市場調査レポート
商品コード
1344384
リージョナルジェット市場:プラットフォーム別、座席数別、最大離陸重量別:世界の機会分析と産業予測、2023-2032年Regional Jet Market By Platform, By Seating Capacity, By Maximum Take-off Weight : Global Opportunity Analysis and Industry Forecast, 2023-2032 |
||||||
|
|||||||

| リージョナルジェット市場:プラットフォーム別、座席数別、最大離陸重量別:世界の機会分析と産業予測、2023-2032年 |
|
出版日: 2023年06月01日
発行: Allied Market Research
ページ情報: 英文 258 Pages
納期: 2~3営業日
|

- 全表示
- 概要
- 図表
- 目次
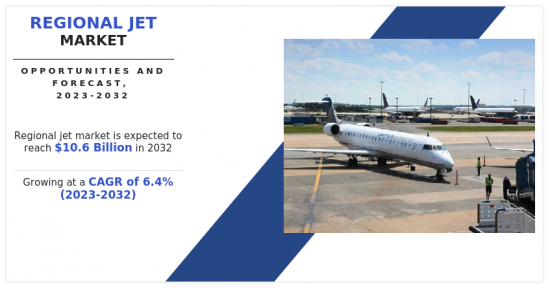
リージョナルジェット市場は、航空需要の増加、地域間接続需要の拡大により、2023年から2032年にかけて6.4%の大幅な成長が見込まれます。
リージョナルジェットは、その効率性、敏捷性、滑走路の短い小規模空港での運用能力で知られています。リージョナルジェット市場の主要航空機メーカーには、Embraer、Bombardier、Sukhoiなどがあり、地域の航空会社とその乗客の多様なニーズに応えるため、さまざまな座席数と能力を備えたリージョナルジェットモデルを幅広く提供しています。
途上経済国、特にアジア太平洋、ラテンアメリカ、中東では、急速な都市化、経済成長、中間層の急増が見られます。このような人口動態の変化は、効率的な地域航空旅行の選択肢に対する需要を生み出し、これらの地域におけるリージョナルジェット市場の成長を牽引しています。これらの地域の政府や観光局は、観光開発を積極的に推進し、国内外の旅行者を誘致しています。リージョナルジェットは、観光客を地域内のさまざまな目的地に接続することで、地域観光を促進する上で重要な役割を果たしています。これがリージョナルジェットの需要を押し上げ、市場の拡大を支えています。例えば、リージョナルジェットは、スコットランドのハイランド地方、ノルウェーのフィヨルド、ギリシャの島々といった観光地と観光客を結ぶ重要な役割を担っており、小規模な地方空港がこれらの息を呑むような場所へのゲートウェイとして機能しています。
目次
第1章 イントロダクション
第2章 エグゼクティブサマリー
第3章 市場概要
- 市場の定義と範囲
- 主な調査結果
- 影響要因
- 主な投資機会
- ポーターのファイブフォース分析
- 市場力学
- 促進要因
- 地域間接続に対する需要の増加
- 機材の更新と効率化
- 旅客航空輸送量の増加
- 抑制要因
- インフラの限界と空港の制約
- 大型機や高速鉄道との競合
- 機会
- 合理的なコストで客室の快適性を大幅に改善
- 技術の進歩と革新
- 促進要因
- COVID-19:市場への影響分析
第4章 リージョナルジェット市場:プラットフォーム別
- 概要
- 民間航空機
- 軍用航空機
第5章 リージョナルジェット市場:座席数別
- 概要
- 15~80席
- 80~125席
第6章 リージョナルジェット市場:最大離陸重量別
- 概要
- 20,000ポンド~80,000ポンド
- 81,000ポンド~160,000ポンド
第7章 リージョナルジェット市場:地域別
- 概要
- 北米
- 米国
- カナダ
- メキシコ
- 欧州
- 英国
- ドイツ
- スペイン
- フランス
- その他欧州
- アジア太平洋
- 中国
- インド
- 日本
- 韓国
- その他アジア太平洋地域
- ラテンアメリカ・中東・アフリカ
- ラテンアメリカ
- 中東
- アフリカ
第8章 競合情勢
- イントロダクション
- 主要成功戦略
- 主要10社の製品マッピング
- 競合ダッシュボード
- 競合ヒートマップ
- 主要企業のポジショニング、2022年
第9章 企業プロファイル
- Airbus
- ANTONOV COMPANY
- ATR
- BAE Systems
- Bombardier
- Commercial Aircraft Corporation of China, Ltd.
- De Havilland
- Embraer
- MITSUBISHI HEAVY INDUSTRIES, LTD.
- Saab AB
LIST OF TABLES
- TABLE 01. GLOBAL REGIONAL JET MARKET, BY PLATFORM, 2022-2032 ($MILLION)
- TABLE 02. REGIONAL JET MARKET FOR COMMERCIAL AIRCRAFT, BY REGION, 2022-2032 ($MILLION)
- TABLE 03. REGIONAL JET MARKET FOR MILITARY AIRCRAFT, BY REGION, 2022-2032 ($MILLION)
- TABLE 04. GLOBAL REGIONAL JET MARKET, BY SEATING CAPACITY, 2022-2032 ($MILLION)
- TABLE 05. REGIONAL JET MARKET FOR 15-80 SEATS, BY REGION, 2022-2032 ($MILLION)
- TABLE 06. REGIONAL JET MARKET FOR 80-125 SEATS, BY REGION, 2022-2032 ($MILLION)
- TABLE 07. GLOBAL REGIONAL JET MARKET, BY MAXIMUM TAKE-OFF WEIGHT, 2022-2032 ($MILLION)
- TABLE 08. REGIONAL JET MARKET FOR 20,000 LBS TO 80,000 LBS., BY REGION, 2022-2032 ($MILLION)
- TABLE 09. REGIONAL JET MARKET FOR 81,000 LBS TO 1,60,000 LBS., BY REGION, 2022-2032 ($MILLION)
- TABLE 10. REGIONAL JET MARKET, BY REGION, 2022-2032 ($MILLION)
- TABLE 11. NORTH AMERICA REGIONAL JET MARKET, BY PLATFORM, 2022-2032 ($MILLION)
- TABLE 12. NORTH AMERICA REGIONAL JET MARKET, BY SEATING CAPACITY, 2022-2032 ($MILLION)
- TABLE 13. NORTH AMERICA REGIONAL JET MARKET, BY MAXIMUM TAKE-OFF WEIGHT, 2022-2032 ($MILLION)
- TABLE 14. NORTH AMERICA REGIONAL JET MARKET, BY COUNTRY, 2022-2032 ($MILLION)
- TABLE 15. U.S. REGIONAL JET MARKET, BY PLATFORM, 2022-2032 ($MILLION)
- TABLE 16. U.S. REGIONAL JET MARKET, BY SEATING CAPACITY, 2022-2032 ($MILLION)
- TABLE 17. U.S. REGIONAL JET MARKET, BY MAXIMUM TAKE-OFF WEIGHT, 2022-2032 ($MILLION)
- TABLE 18. CANADA REGIONAL JET MARKET, BY PLATFORM, 2022-2032 ($MILLION)
- TABLE 19. CANADA REGIONAL JET MARKET, BY SEATING CAPACITY, 2022-2032 ($MILLION)
- TABLE 20. CANADA REGIONAL JET MARKET, BY MAXIMUM TAKE-OFF WEIGHT, 2022-2032 ($MILLION)
- TABLE 21. MEXICO REGIONAL JET MARKET, BY PLATFORM, 2022-2032 ($MILLION)
- TABLE 22. MEXICO REGIONAL JET MARKET, BY SEATING CAPACITY, 2022-2032 ($MILLION)
- TABLE 23. MEXICO REGIONAL JET MARKET, BY MAXIMUM TAKE-OFF WEIGHT, 2022-2032 ($MILLION)
- TABLE 24. EUROPE REGIONAL JET MARKET, BY PLATFORM, 2022-2032 ($MILLION)
- TABLE 25. EUROPE REGIONAL JET MARKET, BY SEATING CAPACITY, 2022-2032 ($MILLION)
- TABLE 26. EUROPE REGIONAL JET MARKET, BY MAXIMUM TAKE-OFF WEIGHT, 2022-2032 ($MILLION)
- TABLE 27. EUROPE REGIONAL JET MARKET, BY COUNTRY, 2022-2032 ($MILLION)
- TABLE 28. UK REGIONAL JET MARKET, BY PLATFORM, 2022-2032 ($MILLION)
- TABLE 29. UK REGIONAL JET MARKET, BY SEATING CAPACITY, 2022-2032 ($MILLION)
- TABLE 30. UK REGIONAL JET MARKET, BY MAXIMUM TAKE-OFF WEIGHT, 2022-2032 ($MILLION)
- TABLE 31. GERMANY REGIONAL JET MARKET, BY PLATFORM, 2022-2032 ($MILLION)
- TABLE 32. GERMANY REGIONAL JET MARKET, BY SEATING CAPACITY, 2022-2032 ($MILLION)
- TABLE 33. GERMANY REGIONAL JET MARKET, BY MAXIMUM TAKE-OFF WEIGHT, 2022-2032 ($MILLION)
- TABLE 34. SPAIN REGIONAL JET MARKET, BY PLATFORM, 2022-2032 ($MILLION)
- TABLE 35. SPAIN REGIONAL JET MARKET, BY SEATING CAPACITY, 2022-2032 ($MILLION)
- TABLE 36. SPAIN REGIONAL JET MARKET, BY MAXIMUM TAKE-OFF WEIGHT, 2022-2032 ($MILLION)
- TABLE 37. FRANCE REGIONAL JET MARKET, BY PLATFORM, 2022-2032 ($MILLION)
- TABLE 38. FRANCE REGIONAL JET MARKET, BY SEATING CAPACITY, 2022-2032 ($MILLION)
- TABLE 39. FRANCE REGIONAL JET MARKET, BY MAXIMUM TAKE-OFF WEIGHT, 2022-2032 ($MILLION)
- TABLE 40. REST OF EUROPE REGIONAL JET MARKET, BY PLATFORM, 2022-2032 ($MILLION)
- TABLE 41. REST OF EUROPE REGIONAL JET MARKET, BY SEATING CAPACITY, 2022-2032 ($MILLION)
- TABLE 42. REST OF EUROPE REGIONAL JET MARKET, BY MAXIMUM TAKE-OFF WEIGHT, 2022-2032 ($MILLION)
- TABLE 43. ASIA-PACIFIC REGIONAL JET MARKET, BY PLATFORM, 2022-2032 ($MILLION)
- TABLE 44. ASIA-PACIFIC REGIONAL JET MARKET, BY SEATING CAPACITY, 2022-2032 ($MILLION)
- TABLE 45. ASIA-PACIFIC REGIONAL JET MARKET, BY MAXIMUM TAKE-OFF WEIGHT, 2022-2032 ($MILLION)
- TABLE 46. ASIA-PACIFIC REGIONAL JET MARKET, BY COUNTRY, 2022-2032 ($MILLION)
- TABLE 47. CHINA REGIONAL JET MARKET, BY PLATFORM, 2022-2032 ($MILLION)
- TABLE 48. CHINA REGIONAL JET MARKET, BY SEATING CAPACITY, 2022-2032 ($MILLION)
- TABLE 49. CHINA REGIONAL JET MARKET, BY MAXIMUM TAKE-OFF WEIGHT, 2022-2032 ($MILLION)
- TABLE 50. INDIA REGIONAL JET MARKET, BY PLATFORM, 2022-2032 ($MILLION)
- TABLE 51. INDIA REGIONAL JET MARKET, BY SEATING CAPACITY, 2022-2032 ($MILLION)
- TABLE 52. INDIA REGIONAL JET MARKET, BY MAXIMUM TAKE-OFF WEIGHT, 2022-2032 ($MILLION)
- TABLE 53. JAPAN REGIONAL JET MARKET, BY PLATFORM, 2022-2032 ($MILLION)
- TABLE 54. JAPAN REGIONAL JET MARKET, BY SEATING CAPACITY, 2022-2032 ($MILLION)
- TABLE 55. JAPAN REGIONAL JET MARKET, BY MAXIMUM TAKE-OFF WEIGHT, 2022-2032 ($MILLION)
- TABLE 56. SOUTH KOREA REGIONAL JET MARKET, BY PLATFORM, 2022-2032 ($MILLION)
- TABLE 57. SOUTH KOREA REGIONAL JET MARKET, BY SEATING CAPACITY, 2022-2032 ($MILLION)
- TABLE 58. SOUTH KOREA REGIONAL JET MARKET, BY MAXIMUM TAKE-OFF WEIGHT, 2022-2032 ($MILLION)
- TABLE 59. REST OF ASIA-PACIFIC REGIONAL JET MARKET, BY PLATFORM, 2022-2032 ($MILLION)
- TABLE 60. REST OF ASIA-PACIFIC REGIONAL JET MARKET, BY SEATING CAPACITY, 2022-2032 ($MILLION)
- TABLE 61. REST OF ASIA-PACIFIC REGIONAL JET MARKET, BY MAXIMUM TAKE-OFF WEIGHT, 2022-2032 ($MILLION)
- TABLE 62. LAMEA REGIONAL JET MARKET, BY PLATFORM, 2022-2032 ($MILLION)
- TABLE 63. LAMEA REGIONAL JET MARKET, BY SEATING CAPACITY, 2022-2032 ($MILLION)
- TABLE 64. LAMEA REGIONAL JET MARKET, BY MAXIMUM TAKE-OFF WEIGHT, 2022-2032 ($MILLION)
- TABLE 65. LAMEA REGIONAL JET MARKET, BY COUNTRY, 2022-2032 ($MILLION)
- TABLE 66. LATIN AMERICA REGIONAL JET MARKET, BY PLATFORM, 2022-2032 ($MILLION)
- TABLE 67. LATIN AMERICA REGIONAL JET MARKET, BY SEATING CAPACITY, 2022-2032 ($MILLION)
- TABLE 68. LATIN AMERICA REGIONAL JET MARKET, BY MAXIMUM TAKE-OFF WEIGHT, 2022-2032 ($MILLION)
- TABLE 69. MIDDLE EAST REGIONAL JET MARKET, BY PLATFORM, 2022-2032 ($MILLION)
- TABLE 70. MIDDLE EAST REGIONAL JET MARKET, BY SEATING CAPACITY, 2022-2032 ($MILLION)
- TABLE 71. MIDDLE EAST REGIONAL JET MARKET, BY MAXIMUM TAKE-OFF WEIGHT, 2022-2032 ($MILLION)
- TABLE 72. AFRICA REGIONAL JET MARKET, BY PLATFORM, 2022-2032 ($MILLION)
- TABLE 73. AFRICA REGIONAL JET MARKET, BY SEATING CAPACITY, 2022-2032 ($MILLION)
- TABLE 74. AFRICA REGIONAL JET MARKET, BY MAXIMUM TAKE-OFF WEIGHT, 2022-2032 ($MILLION)
- TABLE 75. AIRBUS: KEY EXECUTIVES
- TABLE 76. AIRBUS: COMPANY SNAPSHOT
- TABLE 77. AIRBUS: PRODUCT SEGMENTS
- TABLE 78. AIRBUS: PRODUCT PORTFOLIO
- TABLE 79. AIRBUS: KEY STRATERGIES
- TABLE 80. ANTONOV COMPANY: KEY EXECUTIVES
- TABLE 81. ANTONOV COMPANY: COMPANY SNAPSHOT
- TABLE 82. ANTONOV COMPANY: PRODUCT SEGMENTS
- TABLE 83. ANTONOV COMPANY: PRODUCT PORTFOLIO
- TABLE 84. ATR: KEY EXECUTIVES
- TABLE 85. ATR: COMPANY SNAPSHOT
- TABLE 86. ATR: PRODUCT SEGMENTS
- TABLE 87. ATR: PRODUCT PORTFOLIO
- TABLE 88. ATR: KEY STRATERGIES
- TABLE 89. BAE SYSTEMS: KEY EXECUTIVES
- TABLE 90. BAE SYSTEMS: COMPANY SNAPSHOT
- TABLE 91. BAE SYSTEMS: PRODUCT SEGMENTS
- TABLE 92. BAE SYSTEMS: PRODUCT PORTFOLIO
- TABLE 93. BAE SYSTEMS: KEY STRATERGIES
- TABLE 94. BOMBARDIER: KEY EXECUTIVES
- TABLE 95. BOMBARDIER: COMPANY SNAPSHOT
- TABLE 96. BOMBARDIER: PRODUCT SEGMENTS
- TABLE 97. BOMBARDIER: PRODUCT PORTFOLIO
- TABLE 98. COMMERCIAL AIRCRAFT CORPORATION OF CHINA, LTD.: KEY EXECUTIVES
- TABLE 99. COMMERCIAL AIRCRAFT CORPORATION OF CHINA, LTD.: COMPANY SNAPSHOT
- TABLE 100. COMMERCIAL AIRCRAFT CORPORATION OF CHINA, LTD.: PRODUCT SEGMENTS
- TABLE 101. COMMERCIAL AIRCRAFT CORPORATION OF CHINA, LTD.: PRODUCT PORTFOLIO
- TABLE 102. COMMERCIAL AIRCRAFT CORPORATION OF CHINA, LTD.: KEY STRATERGIES
- TABLE 103. DE HAVILLAND: KEY EXECUTIVES
- TABLE 104. DE HAVILLAND: COMPANY SNAPSHOT
- TABLE 105. DE HAVILLAND: PRODUCT SEGMENTS
- TABLE 106. DE HAVILLAND: PRODUCT PORTFOLIO
- TABLE 107. DE HAVILLAND: KEY STRATERGIES
- TABLE 108. EMBRAER: KEY EXECUTIVES
- TABLE 109. EMBRAER: COMPANY SNAPSHOT
- TABLE 110. EMBRAER: PRODUCT SEGMENTS
- TABLE 111. EMBRAER: PRODUCT PORTFOLIO
- TABLE 112. MITSUBISHI HEAVY INDUSTRIES, LTD.: KEY EXECUTIVES
- TABLE 113. MITSUBISHI HEAVY INDUSTRIES, LTD.: COMPANY SNAPSHOT
- TABLE 114. MITSUBISHI HEAVY INDUSTRIES, LTD.: PRODUCT SEGMENTS
- TABLE 115. MITSUBISHI HEAVY INDUSTRIES, LTD.: PRODUCT PORTFOLIO
- TABLE 116. MITSUBISHI HEAVY INDUSTRIES, LTD.: KEY STRATERGIES
- TABLE 117. SAAB AB: KEY EXECUTIVES
- TABLE 118. SAAB AB: COMPANY SNAPSHOT
- TABLE 119. SAAB AB: PRODUCT SEGMENTS
- TABLE 120. SAAB AB: PRODUCT PORTFOLIO
LIST OF FIGURES
- FIGURE 01. REGIONAL JET MARKET, 2022-2032
- FIGURE 02. SEGMENTATION OF REGIONAL JET MARKET, 2022-2032
- FIGURE 03. TOP INVESTMENT POCKETS IN REGIONAL JET MARKET (2023-2032)
- FIGURE 04. LOW BARGAINING POWER OF SUPPLIERS
- FIGURE 05. LOW THREAT OF NEW ENTRANTS
- FIGURE 06. LOW THREAT OF SUBSTITUTES
- FIGURE 07. LOW INTENSITY OF RIVALRY
- FIGURE 08. LOW BARGAINING POWER OF BUYERS
- FIGURE 09. DRIVERS, RESTRAINTS AND OPPORTUNITIES: GLOBALREGIONAL JET MARKET
- FIGURE 09. REGIONAL JET MARKET, BY PLATFORM, 2022(%)
- FIGURE 10. COMPARATIVE SHARE ANALYSIS OF REGIONAL JET MARKET FOR COMMERCIAL AIRCRAFT, BY COUNTRY 2022 AND 2032(%)
- FIGURE 11. COMPARATIVE SHARE ANALYSIS OF REGIONAL JET MARKET FOR MILITARY AIRCRAFT, BY COUNTRY 2022 AND 2032(%)
- FIGURE 12. REGIONAL JET MARKET, BY SEATING CAPACITY, 2022(%)
- FIGURE 13. COMPARATIVE SHARE ANALYSIS OF REGIONAL JET MARKET FOR 15-80 SEATS, BY COUNTRY 2022 AND 2032(%)
- FIGURE 14. COMPARATIVE SHARE ANALYSIS OF REGIONAL JET MARKET FOR 80-125 SEATS, BY COUNTRY 2022 AND 2032(%)
- FIGURE 15. REGIONAL JET MARKET, BY MAXIMUM TAKE-OFF WEIGHT, 2022(%)
- FIGURE 16. COMPARATIVE SHARE ANALYSIS OF REGIONAL JET MARKET FOR 20,000 LBS TO 80,000 LBS., BY COUNTRY 2022 AND 2032(%)
- FIGURE 17. COMPARATIVE SHARE ANALYSIS OF REGIONAL JET MARKET FOR 81,000 LBS TO 1,60,000 LBS., BY COUNTRY 2022 AND 2032(%)
- FIGURE 18. REGIONAL JET MARKET BY REGION, 2022
- FIGURE 19. U.S. REGIONAL JET MARKET, 2022-2032 ($MILLION)
- FIGURE 20. CANADA REGIONAL JET MARKET, 2022-2032 ($MILLION)
- FIGURE 21. MEXICO REGIONAL JET MARKET, 2022-2032 ($MILLION)
- FIGURE 22. UK REGIONAL JET MARKET, 2022-2032 ($MILLION)
- FIGURE 23. GERMANY REGIONAL JET MARKET, 2022-2032 ($MILLION)
- FIGURE 24. SPAIN REGIONAL JET MARKET, 2022-2032 ($MILLION)
- FIGURE 25. FRANCE REGIONAL JET MARKET, 2022-2032 ($MILLION)
- FIGURE 26. REST OF EUROPE REGIONAL JET MARKET, 2022-2032 ($MILLION)
- FIGURE 27. CHINA REGIONAL JET MARKET, 2022-2032 ($MILLION)
- FIGURE 28. INDIA REGIONAL JET MARKET, 2022-2032 ($MILLION)
- FIGURE 29. JAPAN REGIONAL JET MARKET, 2022-2032 ($MILLION)
- FIGURE 30. SOUTH KOREA REGIONAL JET MARKET, 2022-2032 ($MILLION)
- FIGURE 31. REST OF ASIA-PACIFIC REGIONAL JET MARKET, 2022-2032 ($MILLION)
- FIGURE 32. LATIN AMERICA REGIONAL JET MARKET, 2022-2032 ($MILLION)
- FIGURE 33. MIDDLE EAST REGIONAL JET MARKET, 2022-2032 ($MILLION)
- FIGURE 34. AFRICA REGIONAL JET MARKET, 2022-2032 ($MILLION)
- FIGURE 35. TOP WINNING STRATEGIES, BY YEAR
- FIGURE 36. TOP WINNING STRATEGIES, BY DEVELOPMENT
- FIGURE 37. TOP WINNING STRATEGIES, BY COMPANY
- FIGURE 38. PRODUCT MAPPING OF TOP 10 PLAYERS
- FIGURE 39. COMPETITIVE DASHBOARD
- FIGURE 40. COMPETITIVE HEATMAP: REGIONAL JET MARKET
- FIGURE 41. TOP PLAYER POSITIONING, 2022
- FIGURE 42. AIRBUS: RESEARCH & DEVELOPMENT EXPENDITURE, 2020-2022 ($MILLION)
- FIGURE 43. AIRBUS: NET SALES, 2020-2022 ($MILLION)
- FIGURE 44. AIRBUS: REVENUE SHARE BY SEGMENT, 2022 (%)
- FIGURE 45. AIRBUS: REVENUE SHARE BY REGION, 2021 (%)
- FIGURE 46. BAE SYSTEMS: NET SALES, 2020-2022 ($MILLION)
- FIGURE 47. BAE SYSTEMS: RESEARCH & DEVELOPMENT EXPENDITURE, 2020-2022 ($MILLION)
- FIGURE 48. BAE SYSTEMS: REVENUE SHARE BY SEGMENT, 2021 (%)
- FIGURE 49. BAE SYSTEMS: REVENUE SHARE BY REGION, 2021 (%)
- FIGURE 50. BOMBARDIER: RESEARCH & DEVELOPMENT EXPENDITURE, 2020-2022 ($MILLION)
- FIGURE 51. BOMBARDIER: NET REVENUE, 2020-2022 ($MILLION)
- FIGURE 52. BOMBARDIER: REVENUE SHARE BY SEGMENT, 2022 (%)
- FIGURE 53. BOMBARDIER: REVENUE SHARE BY REGION, 2022 (%)
- FIGURE 54. EMBRAER: NET SALES, 2020-2022 ($MILLION)
- FIGURE 55. EMBRAER: REVENUE SHARE BY SEGMENT, 2022 (%)
- FIGURE 56. EMBRAER: REVENUE SHARE BY REGION, 2022 (%)
- FIGURE 57. MITSUBISHI HEAVY INDUSTRIES, LTD.: NET SALES, 2020-2022 ($MILLION)
- FIGURE 58. MITSUBISHI HEAVY INDUSTRIES, LTD.: REVENUE SHARE BY SEGMENT, 2022 (%)
- FIGURE 59. SAAB AB: NET REVENUE, 2020-2022 ($MILLION)
- FIGURE 60. SAAB AB: RESEARCH & DEVELOPMENT EXPENDITURE, 2020-2022 ($MILLION)
- FIGURE 61. SAAB AB: REVENUE SHARE BY SEGMENT, 2022 (%)
- FIGURE 62. SAAB AB: REVENUE SHARE BY REGION, 2022 (%)
The Regional Jet Market is expected to experience a significant growth rate of 6.4% from 2023-2032 owing to the increasing demand for air travel, growing demand for regional connectivity- Allied Market Research
Regional jets are known for their efficiency, agility, and ability to operate in smaller airports with shorter runways. The major aircraft manufacturers in the regional jet market include Embraer, Bombardier, Sukhoi and others offer a range of regional jet models with varying seating capacities and capabilities to cater to the diverse needs of regional airlines and their passengers.
Developing economies, particularly in Asia-Pacific, Latin America, and the Middle East, are witnessing rapid urbanization, economic growth, and a burgeoning middle class. This demographic shift creates a demand for efficient regional air travel options, driving the growth of the regional jet market in these regions. Governments and tourism boards in these regions are actively promoting tourism development, attracting both domestic and international travelers. Regional jets play a vital role in facilitating regional tourism by connecting tourists to various destinations within the region. This drives the demand for regional jets and supports market expansion. For instance, regional jets play a vital role in connecting tourists to destinations such as the Scottish Highlands, the Norwegian fjords, or the Greek islands, where smaller regional airports serve as gateways to these breathtaking locations.
The regional jet market is segmented on the basis of platform, seating capacity, maximum take-off weight, and region. By platform, the market is segmented into commercial aircraft and military aircraft. Further, by seating capacity, the market is segmented into 15-80 seats and 80-125 seats. By maximum take-off weight, the market is segmented into 20,000 lbs. to 80,000 lbs. and 81,000 lbs. to 1,60,000 lbs.
By region, it is analyzed across North America (U.S., Canada, and Mexico), Europe (UK, Germany, Spain, France, and the Rest of Europe), Asia-Pacific (China, India, Japan, South Korea, and the Rest of Asia-Pacific), and LAMEA (Latin America, Middle East, and Africa).
Key Benefits For Stakeholders
- This report provides a quantitative analysis of the market segments, current trends, estimations, and dynamics of the regional jet market analysis from 2022 to 2032 to identify the prevailing regional jet market opportunities.
- The market research is offered along with information related to key drivers, restraints, and opportunities.
- Porter's five forces analysis highlights the potency of buyers and suppliers to enable stakeholders make profit-oriented business decisions and strengthen their supplier-buyer network.
- In-depth analysis of the regional jet market segmentation assists to determine the prevailing market opportunities.
- Major countries in each region are mapped according to their revenue contribution to the global market.
- Market player positioning facilitates benchmarking and provides a clear understanding of the present position of the market players.
- The report includes the analysis of the regional as well as global regional jet market trends, key players, market segments, application areas, and market growth strategies.
Key Market Segments
By Seating Capacity
- 15-80 Seats
- 80-125 Seats
By Maximum Take-off Weight
- 20,000 lbs to 80,000 lbs.
- 81,000 lbs to 1,60,000 lbs.
By Platform
- Commercial Aircraft
- Military Aircraft
By Region
- North America
- U.S.
- Canada
- Mexico
- Europe
- UK
- Germany
- Spain
- France
- Rest of Europe
- Asia-Pacific
- China
- India
- Japan
- South Korea
- Rest of Asia-Pacific
- LAMEA
- Latin America
- Middle East
- Africa
Key Market Players:
- Airbus
- ANTONOV COMPANY
- ATR
- BAE Systems
- Bombardier
- Commercial Aircraft Corporation of China, Ltd.
- De Havilland
- Embraer
- MITSUBISHI HEAVY INDUSTRIES, LTD.
- Saab AB
TABLE OF CONTENTS
CHAPTER 1: INTRODUCTION
- 1.1. Report description
- 1.2. Key market segments
- 1.3. Key benefits to the stakeholders
- 1.4. Research Methodology
- 1.4.1. Primary research
- 1.4.2. Secondary research
- 1.4.3. Analyst tools and models
CHAPTER 2: EXECUTIVE SUMMARY
- 2.1. CXO Perspective
CHAPTER 3: MARKET OVERVIEW
- 3.1. Market definition and scope
- 3.2. Key findings
- 3.2.1. Top impacting factors
- 3.2.2. Top investment pockets
- 3.3. Porter's five forces analysis
- 3.3.1. Low bargaining power of suppliers
- 3.3.2. Low threat of new entrants
- 3.3.3. Low threat of substitutes
- 3.3.4. Low intensity of rivalry
- 3.3.5. Low bargaining power of buyers
- 3.4. Market dynamics
- 3.4.1. Drivers
- 3.4.1.1. Increasing Demand for Regional Connectivity
- 3.4.1.2. Fleet Renewal and Efficiency
- 3.4.1.3. Increased passenger air traffic
- 3.4.1. Drivers
- 3.4.2. Restraints
- 3.4.2.1. Infrastructure Limitations and Airport Constraints
- 3.4.2.2. Competition from Larger Aircraft and High-Speed Rail
- 3.4.3. Opportunities
- 3.4.3.1. Embracing significant improvements to cabin comfort at reasonable costs
- 3.4.3.2. Technological Advancements and Innovation
- 3.5. COVID-19 Impact Analysis on the market
CHAPTER 4: REGIONAL JET MARKET, BY PLATFORM
- 4.1. Overview
- 4.1.1. Market size and forecast
- 4.2. Commercial Aircraft
- 4.2.1. Key market trends, growth factors and opportunities
- 4.2.2. Market size and forecast, by region
- 4.2.3. Market share analysis by country
- 4.3. Military Aircraft
- 4.3.1. Key market trends, growth factors and opportunities
- 4.3.2. Market size and forecast, by region
- 4.3.3. Market share analysis by country
CHAPTER 5: REGIONAL JET MARKET, BY SEATING CAPACITY
- 5.1. Overview
- 5.1.1. Market size and forecast
- 5.2. 15-80 Seats
- 5.2.1. Key market trends, growth factors and opportunities
- 5.2.2. Market size and forecast, by region
- 5.2.3. Market share analysis by country
- 5.3. 80-125 Seats
- 5.3.1. Key market trends, growth factors and opportunities
- 5.3.2. Market size and forecast, by region
- 5.3.3. Market share analysis by country
CHAPTER 6: REGIONAL JET MARKET, BY MAXIMUM TAKE-OFF WEIGHT
- 6.1. Overview
- 6.1.1. Market size and forecast
- 6.2. 20,000 lbs to 80,000 lbs.
- 6.2.1. Key market trends, growth factors and opportunities
- 6.2.2. Market size and forecast, by region
- 6.2.3. Market share analysis by country
- 6.3. 81,000 lbs to 1,60,000 lbs.
- 6.3.1. Key market trends, growth factors and opportunities
- 6.3.2. Market size and forecast, by region
- 6.3.3. Market share analysis by country
CHAPTER 7: REGIONAL JET MARKET, BY REGION
- 7.1. Overview
- 7.1.1. Market size and forecast By Region
- 7.2. North America
- 7.2.1. Key trends and opportunities
- 7.2.2. Market size and forecast, by Platform
- 7.2.3. Market size and forecast, by Seating Capacity
- 7.2.4. Market size and forecast, by Maximum Take-off Weight
- 7.2.5. Market size and forecast, by country
- 7.2.5.1. U.S.
- 7.2.5.1.1. Key market trends, growth factors and opportunities
- 7.2.5.1.2. Market size and forecast, by Platform
- 7.2.5.1.3. Market size and forecast, by Seating Capacity
- 7.2.5.1.4. Market size and forecast, by Maximum Take-off Weight
- 7.2.5.2. Canada
- 7.2.5.2.1. Key market trends, growth factors and opportunities
- 7.2.5.2.2. Market size and forecast, by Platform
- 7.2.5.2.3. Market size and forecast, by Seating Capacity
- 7.2.5.2.4. Market size and forecast, by Maximum Take-off Weight
- 7.2.5.3. Mexico
- 7.2.5.3.1. Key market trends, growth factors and opportunities
- 7.2.5.3.2. Market size and forecast, by Platform
- 7.2.5.3.3. Market size and forecast, by Seating Capacity
- 7.2.5.3.4. Market size and forecast, by Maximum Take-off Weight
- 7.3. Europe
- 7.3.1. Key trends and opportunities
- 7.3.2. Market size and forecast, by Platform
- 7.3.3. Market size and forecast, by Seating Capacity
- 7.3.4. Market size and forecast, by Maximum Take-off Weight
- 7.3.5. Market size and forecast, by country
- 7.3.5.1. UK
- 7.3.5.1.1. Key market trends, growth factors and opportunities
- 7.3.5.1.2. Market size and forecast, by Platform
- 7.3.5.1.3. Market size and forecast, by Seating Capacity
- 7.3.5.1.4. Market size and forecast, by Maximum Take-off Weight
- 7.3.5.2. Germany
- 7.3.5.2.1. Key market trends, growth factors and opportunities
- 7.3.5.2.2. Market size and forecast, by Platform
- 7.3.5.2.3. Market size and forecast, by Seating Capacity
- 7.3.5.2.4. Market size and forecast, by Maximum Take-off Weight
- 7.3.5.3. Spain
- 7.3.5.3.1. Key market trends, growth factors and opportunities
- 7.3.5.3.2. Market size and forecast, by Platform
- 7.3.5.3.3. Market size and forecast, by Seating Capacity
- 7.3.5.3.4. Market size and forecast, by Maximum Take-off Weight
- 7.3.5.4. France
- 7.3.5.4.1. Key market trends, growth factors and opportunities
- 7.3.5.4.2. Market size and forecast, by Platform
- 7.3.5.4.3. Market size and forecast, by Seating Capacity
- 7.3.5.4.4. Market size and forecast, by Maximum Take-off Weight
- 7.3.5.5. Rest of Europe
- 7.3.5.5.1. Key market trends, growth factors and opportunities
- 7.3.5.5.2. Market size and forecast, by Platform
- 7.3.5.5.3. Market size and forecast, by Seating Capacity
- 7.3.5.5.4. Market size and forecast, by Maximum Take-off Weight
- 7.4. Asia-Pacific
- 7.4.1. Key trends and opportunities
- 7.4.2. Market size and forecast, by Platform
- 7.4.3. Market size and forecast, by Seating Capacity
- 7.4.4. Market size and forecast, by Maximum Take-off Weight
- 7.4.5. Market size and forecast, by country
- 7.4.5.1. China
- 7.4.5.1.1. Key market trends, growth factors and opportunities
- 7.4.5.1.2. Market size and forecast, by Platform
- 7.4.5.1.3. Market size and forecast, by Seating Capacity
- 7.4.5.1.4. Market size and forecast, by Maximum Take-off Weight
- 7.4.5.2. India
- 7.4.5.2.1. Key market trends, growth factors and opportunities
- 7.4.5.2.2. Market size and forecast, by Platform
- 7.4.5.2.3. Market size and forecast, by Seating Capacity
- 7.4.5.2.4. Market size and forecast, by Maximum Take-off Weight
- 7.4.5.3. Japan
- 7.4.5.3.1. Key market trends, growth factors and opportunities
- 7.4.5.3.2. Market size and forecast, by Platform
- 7.4.5.3.3. Market size and forecast, by Seating Capacity
- 7.4.5.3.4. Market size and forecast, by Maximum Take-off Weight
- 7.4.5.4. South Korea
- 7.4.5.4.1. Key market trends, growth factors and opportunities
- 7.4.5.4.2. Market size and forecast, by Platform
- 7.4.5.4.3. Market size and forecast, by Seating Capacity
- 7.4.5.4.4. Market size and forecast, by Maximum Take-off Weight
- 7.4.5.5. Rest of Asia-Pacific
- 7.4.5.5.1. Key market trends, growth factors and opportunities
- 7.4.5.5.2. Market size and forecast, by Platform
- 7.4.5.5.3. Market size and forecast, by Seating Capacity
- 7.4.5.5.4. Market size and forecast, by Maximum Take-off Weight
- 7.5. LAMEA
- 7.5.1. Key trends and opportunities
- 7.5.2. Market size and forecast, by Platform
- 7.5.3. Market size and forecast, by Seating Capacity
- 7.5.4. Market size and forecast, by Maximum Take-off Weight
- 7.5.5. Market size and forecast, by country
- 7.5.5.1. Latin America
- 7.5.5.1.1. Key market trends, growth factors and opportunities
- 7.5.5.1.2. Market size and forecast, by Platform
- 7.5.5.1.3. Market size and forecast, by Seating Capacity
- 7.5.5.1.4. Market size and forecast, by Maximum Take-off Weight
- 7.5.5.2. Middle East
- 7.5.5.2.1. Key market trends, growth factors and opportunities
- 7.5.5.2.2. Market size and forecast, by Platform
- 7.5.5.2.3. Market size and forecast, by Seating Capacity
- 7.5.5.2.4. Market size and forecast, by Maximum Take-off Weight
- 7.5.5.3. Africa
- 7.5.5.3.1. Key market trends, growth factors and opportunities
- 7.5.5.3.2. Market size and forecast, by Platform
- 7.5.5.3.3. Market size and forecast, by Seating Capacity
- 7.5.5.3.4. Market size and forecast, by Maximum Take-off Weight
CHAPTER 8: COMPETITIVE LANDSCAPE
- 8.1. Introduction
- 8.2. Top winning strategies
- 8.3. Product Mapping of Top 10 Player
- 8.4. Competitive Dashboard
- 8.5. Competitive Heatmap
- 8.6. Top player positioning, 2022
CHAPTER 9: COMPANY PROFILES
- 9.1. Airbus
- 9.1.1. Company overview
- 9.1.2. Key Executives
- 9.1.3. Company snapshot
- 9.1.4. Operating business segments
- 9.1.5. Product portfolio
- 9.1.6. Business performance
- 9.1.7. Key strategic moves and developments
- 9.2. ANTONOV COMPANY
- 9.2.1. Company overview
- 9.2.2. Key Executives
- 9.2.3. Company snapshot
- 9.2.4. Operating business segments
- 9.2.5. Product portfolio
- 9.3. ATR
- 9.3.1. Company overview
- 9.3.2. Key Executives
- 9.3.3. Company snapshot
- 9.3.4. Operating business segments
- 9.3.5. Product portfolio
- 9.3.6. Key strategic moves and developments
- 9.4. BAE Systems
- 9.4.1. Company overview
- 9.4.2. Key Executives
- 9.4.3. Company snapshot
- 9.4.4. Operating business segments
- 9.4.5. Product portfolio
- 9.4.6. Business performance
- 9.4.7. Key strategic moves and developments
- 9.5. Bombardier
- 9.5.1. Company overview
- 9.5.2. Key Executives
- 9.5.3. Company snapshot
- 9.5.4. Operating business segments
- 9.5.5. Product portfolio
- 9.5.6. Business performance
- 9.6. Commercial Aircraft Corporation of China, Ltd.
- 9.6.1. Company overview
- 9.6.2. Key Executives
- 9.6.3. Company snapshot
- 9.6.4. Operating business segments
- 9.6.5. Product portfolio
- 9.6.6. Key strategic moves and developments
- 9.7. De Havilland
- 9.7.1. Company overview
- 9.7.2. Key Executives
- 9.7.3. Company snapshot
- 9.7.4. Operating business segments
- 9.7.5. Product portfolio
- 9.7.6. Key strategic moves and developments
- 9.8. Embraer
- 9.8.1. Company overview
- 9.8.2. Key Executives
- 9.8.3. Company snapshot
- 9.8.4. Operating business segments
- 9.8.5. Product portfolio
- 9.8.6. Business performance
- 9.9. MITSUBISHI HEAVY INDUSTRIES, LTD.
- 9.9.1. Company overview
- 9.9.2. Key Executives
- 9.9.3. Company snapshot
- 9.9.4. Operating business segments
- 9.9.5. Product portfolio
- 9.9.6. Business performance
- 9.9.7. Key strategic moves and developments
- 9.10. Saab AB
- 9.10.1. Company overview
- 9.10.2. Key Executives
- 9.10.3. Company snapshot
- 9.10.4. Operating business segments
- 9.10.5. Product portfolio
- 9.10.6. Business performance